Multi TimeFrame Currency Meter

3.4


This Currency Meter Calculates Strength Using a currency basket of 28 pairs?

This Currency Meter uses a basket of 28 currency pair to define strength. This is very important because it gives an wholesome view of the strength of a currency by considering its reaction to all major currencies paired with it.


This Currency Meter is Multi-timeframe!!!

Majority of the currency strength indicators around the market today only has a single time frame view. Even with the so called multi-timeframe versions, they provide a list of time frames for you but you will still only be able to view a single time frame per chart.

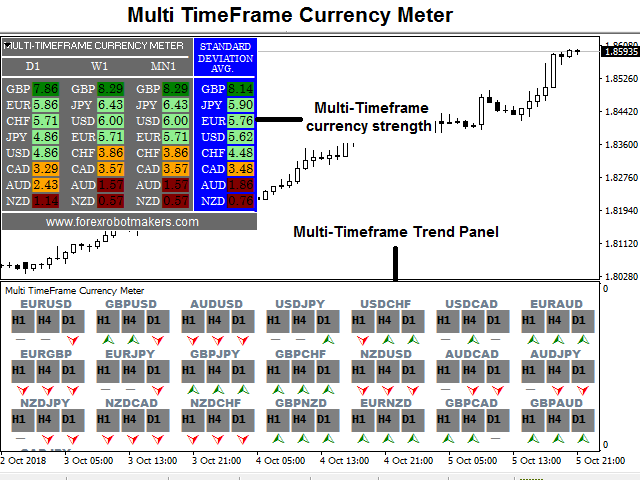
This indicator shows currency strengths of different time frames in one chart thus giving you a clear picture of the long and short term sentiments of the market in a single view.


Another Awesome About This Currency Meter is Multi-timeframe Averaging!

The final strength displayed is an Average strength of 3 time frames. Why is this important?

While a long term trend might define the short term market sentiment, yet the short term sentiments is what builds the long term. I have seen several cases where a single news release changes the direction of a trend indefinitely. Thus to clearly define the currency strength, you have to consider both Higher Time frames and Lower time frames.


Information You Can Get with This Currency Strength meter

  1. Direction of a trend: By comparing the strengths of the two currencies in a pair, the direction of that pair can be easily deduced. E.g EUR=7.9, USD=2.9. Then EURUSD is in a bullish trend because EUR is stronger than USD.
  2. Strength of a trend: The strength of the trend of a particular pair can be simply deduced from the difference between the values of the currencies that make the pair.
    Example 1: AUD=6.0, USD=5.9. The difference is just (6.0-5.9=0.1). This is a very weak trend.
    Example 2: AUD=8.0, USD=3.0. The difference is (8.0-3.0=5.0). This is a very strong trend.
  3. Volatility: With the difference between the currencies in a pair, you can easily deduce the volatility of that pair. A difference less than three (3.0) signifies weak movement and thus an indication of low volatility . A difference greater than four (4.0) signifies strong movement and thus an indication of high volatility.

These are just a few of the general information you can get from this Currency Strength Meter but the list goes on depending on your trading strategy.


Input menu

  • Time Frame 1: First Time Frame
  • Time Frame 2: Second Time Frame
  • Time Frame 3: Third Time Frame
  • TrendPanelBackGround: Editable Panel Background color.
  • TrendPanelText: Editable Panel text color.

YOU CAN NOW DOWNLOAD FREE VERSIONS OF OUR PAID INDICATORS . IT'S OUR WAY OF GIVING BACK TO THE COMMUNITY !

>>>  GO HERE TO DOWNLOAD


Recensioni 8
testacc
616
testacc 2019.04.09 07:26 
 

I have spent a lot of time with various currency meters and know their strengths, weaknesses and failings. This currency Meter is a robust useful and effective tool. Although it is Daily, Weekly and Monthly, because of the way it works it is far more sensitive at those settings than you would intuitively expect. That is why one of the reviews here find it changes so often on lower timeframes. The daily for instance picks up intra day trends well that are tradeable on a 1min timeframe at s/r (once a trend is established) well without being quite as sensitive as some other methods. It strikes a good optimal balance for me between sensitive and stable. The developer has modded it so it is stable when it starts on a new period.

I have contacted the developer for help and he has been extremely accommodating, quick to reply and more helpful than I'd have expected.

goor311
493
goor311 2023.10.25 05:08 
 

Rented the multi-time frame currency meter.So far so good. 3-4 trades and I am in profit! But I am so glad I rented it and I will buy it when time is up.I like what I see. I particularly like the strength part of the meter-I can determine how far the currency pair will go either down or up

Prodotti consigliati
Genesis Matrix Pro is a professional multi-timeframe trend detection indicator designed to help traders identify high-quality market alignment with clarity and structure. It combines 12 different technical indicators into one visual alignment matrix, allowing traders to quickly see when market conditions are bullish, bearish, or neutral. A signal is generated only when the selected strategies are aligned, helping reduce noise and improve decision-making. PLEASE CONTACT ME AFTER PURCHASE TO GET
Step into the world of Forex trading with confidence, clarity, and precision using   Gold Indicator   a next-generation tool engineered to take your trading performance to the next level. Whether you’re a seasoned professional or just beginning your journey in the currency markets, Gold Indicator equips you with powerful insights and help you trade smarter, not harder. Built on the proven synergy of three advanced indicators, Gold Indicator focuses exclusively on medium and long-term trends eli
The Candlestick Pattern Detector is an advanced MetaTrader 4 indicator designed to identify and highlight candlestick patterns on your charts. Currently, the indicator detects one specific candlestick pattern - the pinbar, known for its significance in technical analysis and trading strategies. This tool provides traders with visual cues, making it easier to spot potential market reversals or continuations. Features: Customizable Colors: Users can customize the colors of the bullish and bearish
Candle Pattern Finder Candle Pattern Finder is a powerful MT4 indicator designed to help traders easily detect key candlestick patterns in real-time. Whether you're trading trends, reversals, or consolidations, this tool highlights important price action signals directly on the chart — helping you make faster and more confident trading decisions. Detects popular candlestick patterns: Bullish/Bearish Engulfing Hammer & Inverted Hammer Shooting Star & Hanging Man Three White Soldiers Three Black
FREE
The market session currency meter is an advanced currency meter designed majorly for intra-day trading. The meter tracks price movements and volatilities across the different market sessions daily. With this market meter you will be able to see how price moved within the four (4) major market sessions ( SYDNEY , TOKYO , LONDON and NEW YORK ). The indicator comes with an inbuilt daily savers time adjuster that automatically adjusts the hours for each session when ever the daily savers time (DST)
MA Alignment Scanner
Benedict Jamora
5 (1)
This indicator scans and displays currency pairs that have recently aligned moving averages on a given timeframe. You can configure which pairs the indicator will scan. It also includes all types of alert options. Bullish MA Alignment =  MA1>MA2>MA3>MA4>MA5 Bearish MA Alignment =  MA1<MA2<MA3<MA4<MA5 Features Attach to one chart and scans all the currency pairs configured and visible in the Market Watch Window It can monitor all the available timeframes from M1 to MN1 and sends alerts on every
Candle finder robot MT4 Candle finder robot is one of the trading assistant tools that helps the trader, this tool helps the trader to examine all the currency pairs that are in the Metatrader watch list in detail within a few seconds. Find the desired signals. According to the strategy that is defined for this robot, in your watch list, it carefully looks for trend change candles, there are many trend change candles that traders use in their trading decisions. This robot can simply check all t
Mini Currency Strength Meter
Opengates Success International
Mini Currency Strength Meter Mini Currency Strength Meter is a PORTABLE (mini) currency strength meter created to measure/analyze currency strength and pass the information to the trader through a graphical display of each currency group's strength rates by percentage. USAGE: It is useful in two ways for trading: 1. Solo Trading 2. Basket Trading (Currency Group Trading) HOW TO USE IT EFFECTIVELY Solo trading: It can be used for solo trading by analyzing the strength of each group of
Trend Line Map Pro
STE S.S.COMPANY
4.5 (16)
Trend Line Map indicator is an addons for Trend Screener Indicator . It's working as a scanner for all signals generated by Trend screener ( Trend Line Signals ) . It's a Trend Line Scanner based on Trend Screener Indicator.  If you don't have Trend Screener Pro Indicator, the Trend Line Map Pro will not work. LIMITED TIME OFFER : Trend Line Map Indicator is available for only 50 $ and lifetime. ( Original price 125$ ) By accessing to our MQL5 Blog,  you can find all our premium indicators wit
OPGTS Currency Strength Meter
Opengates Success International
3 (1)
OPGTS Currency Strength Meter is an indicator created to measure and analyze the currency strength and pass the information to the trader through a graphical display of each currency group's strength rates by percentage. Each bar it shows represents the currency's strength or weakness. USAGE: It is useful in two ways for trading: 1. Solo Trading 2. Basket Trading (Currency Group Trading) HOW TO USE IT EFFECTIVELY Solo trading: It can be used for solo trading by analyzing the strength o
MT Unstoppable
Issara Seeboonrueang
Please feel free to contact me if you need any further information. Please let me know if you have any questions. I hope the above is useful to you. MT Unstoppable :  is a swing trade or trend strategy through signal filtering with experience.  indicator for trade by yourself TRADE: Forex TIME FRAME:  All Time Frame    (Not M1 ,  Introducing timeframe H1) SYMBOL PAIR: All Symbol  SETTINGS: TREND: Period, Trend Zone  and   Trend Zone Meter Multi Timeframe ( For backtest, history data
Quantum Falcon Signal Free is a smart visual trading indicator for MetaTrader 4 designed for Forex and Gold traders. The indicator combines: • Trend analysis • RSI momentum confirmation • MACD momentum filtering • ATR volatility filtering • Higher timeframe confirmation • Smart exit signal detection Main Features: • Smart Buy and Sell signals • Exit Buy / Exit Sell alerts • Real-time dashboard on chart • Professional candle arrows • Multi-timeframe trend confirmation • ATR market volatility filt
FREE
RQL Trend Board – Description RQL Trend Board   is a simple but powerful multi-timeframe trend dashboard. It shows the current market bias across several timeframes at the same time, using an internal trend-classification method. Each timeframe is displayed as a colored box:   Green   – bullish bias → look for   long   setups   Yellow   – ranging / unclear →   no trade zone   Red   – bearish bias → look for   short   setups The indicator gives a clear   overall picture   of where the
FREE
TWO PAIRS SQUARE HEDGE METER INDICATOR Try this brilliant 2 pairs square indicator It draws a square wave of the relation between your two inputs symbols when square wave indicates -1 then it is very great opportunity to SELL pair1 and BUY Pair2 when square wave indicates +1 then it is very great opportunity to BUY pair1 and SELL Pair2 the inputs are : 2 pairs of symbols         then index value : i use 20 for M30 charts ( you can try other values : 40/50 for M15 , : 30 for M30 , : 10 for H1 ,
MicroMini FFMV Dashboard
Opengates Success International
MicroMini FFMV Dashboard This is a custom indicator created to give Traders a full view of what is going on in the market. It uses a real time data to access the market and display every bit of information needed to make successful trading. THIS IS A MicroMini size of the FULL FOREX MARKET VIEW DASHBOARD INDICATOR. This is for those who don't like the Indicator to cover all the charts and for those who don't like BOGU S things. They practically perform the same operation but MicroMini FFMV Dashb
URGENCY “Limited launch pricing” “Price increases after version 2.0” Currencies Gold Momentum Flow Dashboard  — See Market Strength Instantly A powerful all-in-one dashboard that shows real-time momentum across multiple timeframes (M5–D1) for forex and gold. Multi-timeframe ROC analysis Built-in trade signals (alignment & momentum shifts) Currency strength meter Heatmap for instant trend recognition Alerts + one-click pair switching Stop switching charts — see the entire market in
Il nostro indicatore Basic Support and Resistance è la soluzione necessaria per aumentare l'analisi tecnica.Questo indicatore consente di proiettare i livelli di supporto e resistenza sul grafico/ MT5 gratuita Funzionalità Integrazione dei livelli di Fibonacci: Con la possibilità di visualizzare i livelli di Fibonacci insieme a livelli di supporto e resistenza, il nostro indicatore ti dà una visione ancora più profonda del comportamento del mercato e delle possibili aree di inversione. Ottimi
Currency Strength Matrix (CSM) is an indicator that will show you the current strength of the major currencies in several timeframes allowing you to sort the currencies for strength and spot possible trading setups. This indicator is ideal for scalping and in all those events of sudden big moves. This DEMO only shows 4 currencies and 4 timeframes, for the full version please check https://www.mql5.com/en/market/product/24252 How does it work? The CSM compares the value of the current moving ave
FREE
Virtual Exchange Reserve Equity Monitor In an environment where exchanges offer increasingly high leverage ratios, it is all the more important for traders to tightly regulate their level of equity .  This software is designed to be run in the background on any virtual private server that can run Meta Trader 4/5.  It implements basic equity control functions ahead of the broker---allowing users to set their own equity trailing stop, an equity limit to lock-in a certain profit margin, and a unive
FREE
StrengthDashboard
Hans Alexander Nolawon Djurberg
Strength Dashboard is an advanced and easy to use MT4 dashboard indicator that detects and shows latest strength percentage of each currency during all 28 pairs. It's very good for trend detection and scalping trade even when the market is flat and range ,it shows each pairs which need to open order in certain direction ,when there is up trend that pair will be in Green color for buy signal and vice versa for sell signal is in Red color and then the color is in Grey ,means the market is neutral/
Noize Absorption Index MT4
Ekaterina Saltykova
5 (1)
Noize Absorption Index - is the manual trading system that measures the difference of pressure between bears forces and bulls forces. Green line - is a noize free index that showing curent situation. Zero value of index shows totally choppy/flat market.Values above zero level shows how powerfull bullish wave is and values below zero measures bearish forces.Up arrow appears on bearish market when it's ready to reverse, dn arrow appears on weak bullish market, as a result of reverse expectation. S
If you are tired of jumping from chart to chart or loading up a 1000 of currency pairs on restricted MetaTrader 4 terminal to see what are the best trading opportunities out of the Asian Session, then Sessions Indicator Scanner may be the perfect indicator for you. Based on Steve Mauro's Forex training, the Sessions Indicator was developed to scan the entire Forex market at the opening of the London Session and the closing of the Asian Session. This can also be used for those who incorporate bre
Hello, This is an easy symbol change panel. This is a full version of Symbol1 2Changer Symbols must be active on your Market Watch list. Parameters: SymbolList - you can add more symbols with a comma(,) ratio - change the size LineNumber - you can set that how many symbols are displayed per line. button_width - modify the button size button_height - modify the button size Thank you.
ScalpingOne
Xian Er Sha Ao
Scalping Day Trading Support Utility Scalping One for MT4 setting faile (for white Chart)    http://www.emkyuradias.shop/indexenglish.html One position is displayed with one button. View P & L, Lot, and Point in real time. It is possible to switch the display of positions of only chart currencies and all currency pairs.   Supports automatic identification in Japanese and English   Account currency notation corresponds to dollar, euro, pound, yen (automatic identification) Lot, take profit and
Proxy OrderFlow MT4
Vincent Jose Proenca
5 (1)
Indicatore basato sul disequilibrio del tick-spread. TF: Funziona su tutti i timeframe (da M1 a D1). Coppie: Compatibile con Forex, indici, oro e CFD (regolazione automatica per JPY, Oro e CFD). Impostazioni: TickWindow (200) – finestra di osservazione dei tick SpreadWeight (1.5) – peso dello spread NormalizationPeriod (20) – periodo di normalizzazione (z-score) Overbought / Oversold (±3.0) – soglie di allerta AlertCooldown (300s) – tempo di raffreddamento tra gli avvisi Conclusione: Proxy Or
PyramidExpert
Joel Protusada
P Y R A M I D   E X P E R T    This Forex utility is a complex exit strategy and order management tool that executes four trading methods; scalping, pyramid style, hedging, and scaling method to close trades with a profit.           V E R Y  I M P O R T A N T     This is not a stand alone expert advisor. Use it with your own volatility-based strategy. Once you found the currency pair to trade, you can just attach this tool to the chart of the chosen pair and it will do the
Currency Quote
Bott Consulting Group
Real-time trend, pricing, and volume details in the corner of the current chart. This indicator displays useful trend, pricing, and volume information in the corner of the current chart. With this indicator, you get real-time market trend, pricing (Ask, Bid, spread, Open, High, Low, change from previous bar Close), and volume (current, High, average). After the indicator is executed, you will see this real-time data in the upper right-hand corner of the chart or an alert indicating that an error
Laguerre SuperTrend Clouds adds an Adaptive Laguerre averaging algorithm and alerts to the widely popular SuperTrend indicator. As the name suggests, Laguerre SuperTrend Clouds (LSC) is a trending indicator which works best in trendy (not choppy) markets. The SuperTrend is an extremely popular indicator for intraday and daily trading, and can be used on any timeframe. Incorporating Laguerre's equation to this can facilitate more robust trend detection and smoother filters. The LSC uses the impro
High Pass Filter Candlesticks
Safwan Rushdi Khalil Arekat
This indicator applies the  biquad high pass filter to the price-chart data, and displays the filter output for the OHLC as candlesticks. The candlesticks corresponds to the actual calculations of the filter value  during the formation of each price bar (not from all historical highs lows or closes). The shape of the bars therefore corresponds directly to the shape of each price bar. High pass filters are an underappreciated type of oscillator that are seldom used in technical analysis in the st
FREE
The Best One Scalping Trade Panel functional manual trade panel with risk reward, auto SL by candle ( original solution), lot size calculation, one-click trading, scale in and out of trades (partial close),  Works with all symbols not just currency pairs, perfect works on DAX, NASDAQ, GOLD, ...... I earn every day during live stream on ZakopiecFX - join Me Risk by lot Risk by percent SL by points SL by Candle, Renko, RangeBar ( original solution) TP by point TP by Risk/Reward Auto Trailing by P
Gli utenti di questo prodotto hanno anche acquistato
Neuro Poseidon MT4
Daria Rezueva
4.95 (38)
Neuro Poseidon is a new indicator by Daria Rezueva. It combines precise trading signals with adaptive TP/SL levels - creating best possible trades as a result! Message me and get  Neuro Poseidon Assistant  as a gift to automize your trading process! What makes it stand out? 1. Proven profitability on all assets and timeframes 2. Only confirmed BUY and SELL signals present on the chart 3. Adaptive TP & SL levels generated by the software for each trade 4. Easy to understand - suitable for all
Indicatore Miraculous – Strumento Forex e Binario 100% Non-Repaint Basato sul Quadrato di Nove di Gann Questo video presenta l' Indicatore Miraculous , uno strumento di trading altamente accurato e potente, sviluppato specificamente per i trader di Forex e Opzioni Binarie . Ciò che rende unico questo indicatore è la sua base sul leggendario Quadrato di Nove di Gann e sulla Legge della Vibrazione di Gann , rendendolo uno degli strumenti di previsione più precisi disponibili nel trading moderno. L
Gann Made Easy
Oleg Rodin
4.84 (165)
Gann Made Easy è un sistema di trading Forex professionale e facile da usare che si basa sui migliori principi del trading utilizzando la teoria di mr. WD Gann. L'indicatore fornisce segnali ACQUISTA e VENDI accurati, inclusi i livelli di Stop Loss e Take Profit. Puoi fare trading anche in movimento utilizzando le notifiche PUSH. CONTATTAMI DOPO L'ACQUISTO PER RICEVERE GRATUITAMENTE LE ISTRUZIONI DI TRADING E OTTIMI INDICATORI EXTRA! Probabilmente hai già sentito parlare molte volte dei metodi d
Prop Firm Sniper MT4  is a professional market structure indicator that automatically identifies high-probability BUY and SELL opportunities using BOS and CHoCH analysis. Recommended Timeframes: For backtesting, use the indicator on   M5 or M15   for Gold (XAUUSD), and   M15 or H1   for more volatile Forex pairs such as   GBPUSD, USDJPY, EURGBP , and similar markets. CONTACT ME AFTER PURCHASE TO CLAIM YOUR FREE BONUSES! Prop Firm Sniper  is a professional market structure indicator designed t
Dynamic Forex28 Navigator
Bernhard Schweigert
4.43 (7)
Dynamic Forex28 Navigator - Lo strumento di trading Forex di nuova generazione. ATTUALMENTE SCONTATO DEL 49%. Dynamic Forex28 Navigator è l'evoluzione dei nostri indicatori popolari di lunga data, che combinano la potenza di tre in uno: Advanced Currency Strength28 Indicator (695 recensioni) + Advanced Currency IMPULSE con ALERT (520 recensioni) + CS28 Combo Signals (Bonus). Dettagli sull'indicatore https://www.mql5.com/en/blogs/post/758844 Cosa offre l'indicatore di forza di nuova generazione?
RelicusRoad Pro
Relicus LLC
4.65 (107)
RelicusRoad Pro: Sistema Operativo Quantitativo di Mercato 70% DI SCONTO ACCESSO A VITA (TEMPO LIMITATO) - UNISCITI A 2.000+ TRADER Perché la maggior parte dei trader fallisce anche con indicatori "perfetti"? Perché operano su Singoli Concetti isolati. Un segnale senza contesto è una scommessa. Per vincere serve CONFLUENZA . RelicusRoad Pro non è un semplice indicatore. È un Ecosistema Quantitativo completo . Mappa la "Fair Value Road", distinguendo tra rumore e rotture strutturali. Smetti di in
Scalper Inside PRO
Alexey Minkov
4.68 (69)
Scalper Inside PRO Scalper Inside PRO is an intraday trend and scalping indicator that uses exclusive built-in algorithms to evaluate market direction and key target levels. The indicator automatically calculates entry and exit points and several profit target levels, and it shows detailed performance statistics, so you can see how different instruments and strategies behaved on historical data. This helps you select instruments that fit current market conditions. You can also connect your own a
MetaBands M4
Vahidreza Heidar Gholami
3.5 (6)
MetaBands uses powerful and unique algorithms to draw channels and detect trends so that it can provide traders with potential points for entering and exiting trades. It’s a channel indicator plus a powerful trend indicator. It includes different types of channels which can be merged to create new channels simply by using the input parameters. MetaBands uses all types of alerts to notify users about market events. Features Supports most of the channel algorithms Powerful trend detection algorith
Questo prodotto è stato aggiornato per il mercato 2026 e ottimizzato per le ultime build di MT5. AVVISO DI AGGIORNAMENTO PREZZO: Smart Trend Trading System è attualmente disponibile a $99 . Il prezzo aumenterà a $199 dopo i prossimi 30 acquisti . OFFERTA SPECIALE: Dopo aver acquistato Smart Trend Trading System, inviami un messaggio privato per ricevere Smart Universal EA GRATIS e trasformare i tuoi segnali Smart Trend in operazioni automatiche. Smart Trend Trading System è un sistema di tradin
BTMM State Engine Pro is a MetaTrader 4 indicator for traders who use the Beat The Market Maker approach: Asian session context, kill zone timing, level progression, peak formation detection, and a multi-pair scanner from a single chart. It combines cycle state logic with a built-in scanner dashboard so you do not need the same tool on many charts at once. What it does Draws the Asian session range; session times can follow broker server offset or be set in inputs. Tracks level progression (L
Advanced Supply Demand
Bernhard Schweigert
4.91 (300)
Speciale Trading- SCONTO DEL 30% La soluzione migliore per qualsiasi trader principiante o esperto! Questo indicatore è uno strumento di trading unico, di alta qualità e conveniente, perché abbiamo incorporato una serie di funzionalità proprietarie e una nuova formula. Con questo aggiornamento, potrai visualizzare doppie zone di timeframe. Non solo potrai visualizzare un TF più alto, ma anche entrambi, il TF del grafico e il TF più alto: MOSTRA ZONE ANNIDATE. Tutti i trader che operano con Of
L'indicatore Quadrato di Gann è uno strumento potente di analisi di mercato basato sull'articolo "Formula Matematica per le Previsioni di Mercato" scritto da W.D. Gann. Questo strumento utilizza concetti matematici e teorie di Gann per effettuare un'analisi precisa del mercato. Utilizza i quadrati di 144, 90, 52 e anche il quadrato di 9. Inoltre, integra il metodo del  per il quadrato di 9 e la sua relazione con canali e modelli stellari di quel quadrato. Manuale Utente e Applicazione: Prima di
Neo Wave PRO
Nikolay Raykov
5 (1)
Price & Time Market Structure Indicator A professional market structure tool that analyzes waves through both price and time — not price alone. Main Description NeoWave PRO is a professional market structure indicator for MetaTrader 4 designed for traders who want to move beyond traditional one-dimensional wave tools such as ZigZag, swing indicators, and basic high/low systems. Most wave indicators analyze only one thing: Price. But a real market wave is not only a price movement. A true wave de
Enigma scalper fx
Yonny Pascal Ekwa Mezui
Enigma Scalper  Overview Enigma Scalper Pro is a multi-filter breakout indicator designed for traders who want clean entry signals with confirmation from several technical conditions instead of relying on a single trigger. The indicator combines: 3-Bar Breakout pattern detection Higher Timeframe confluence Bollinger Band extreme filtering RSI momentum analysis Optional EMA trend filtering ATR-based SL/TP projection Signals are generated only after candle close to ensure stable non-repainting beh
PRO Renko System
Oleg Rodin
5 (30)
PRO Renko System è un sistema di trading altamente accurato appositamente progettato per il trading di grafici RENKO. Questo è un sistema universale che può essere applicato a vari strumenti di trading. Il sistema neutralizza efficacemente il cosiddetto rumore di mercato che consente di accedere a segnali di inversione accurati. L'indicatore è molto facile da usare e ha un solo parametro responsabile della generazione del segnale. Puoi facilmente adattare lo strumento a qualsiasi strumento di
The indicator scans for Dinapoli thrust pattern in multiple timeframes for the all markets filtered and shows the results on Dashboard. Key Features Dashboard can be used for all markets It can scan for thrust pattern on MN1, W1, D1, H4, H1, M30, M15 ,M5, M1 timeframes Ability to choose number of bars required above/below displaced moving average to define thrust Parameters UseMarketWatch: Set true to copy all symbols available in market watch MarketWatchCount : Set the number of symbols that
ATTUALMENTE SCONTATO DEL 40% La soluzione migliore per ogni principiante o trader esperto! Questo indicatore è uno strumento di trading unico, di alta qualità e conveniente perché abbiamo incorporato una serie di caratteristiche proprietarie e una nuova formula. Con un solo grafico è possibile leggere la forza delle valute per 28 coppie Forex! Immaginate come migliorerà il vostro trading perché sarete in grado di individuare l'esatto punto di innesco di una nuova tendenza o di un'opportunità
Questo indicatore è un indicatore per l'analisi automatica delle onde perfetto per il trading pratico! Caso... Nota:   non sono abituato a usare nomi occidentali per la classificazione delle onde a causa dell'influenza della convenzione di denominazione di Tang Lun (Tang Zhong Shuo Zen), ho chiamato l'onda base come   penna   e la banda dell'onda secondaria come   segmento   At allo stesso tempo, il segmento ha la direzione del trend. La denominazione   è principalmente segmento di trend   (que
Introduction Harmonic Patterns are best used to predict potential turning point. Traditionally, Harmonic Pattern was identified manually connecting peaks and troughs points in the chart. Manual harmonic pattern detection is painfully tedious and not suitable for everyone. You are often exposed under subjective pattern identification with manual pattern detection. To avoid these limitations, Harmonic Pattern Plus was designed to automate your harmonic pattern detection process. The functionality
KT Alpha Hunter Arrows MT4
KEENBASE SOFTWARE SOLUTIONS
La maggior parte degli indicatori a frecce ti dà un segnale e poi ti lascia capire da solo tutto il resto. KT Alpha Hunter Arrows ti offre un piano di trading completo. Ogni freccia di segnale viene visualizzata con un piano già tracciato: linea di ingresso, stop loss, quattro livelli di take profit e un verdetto edge in tempo reale che ti indica se quel simbolo e quel timeframe meritano di essere tradati in quel momento. Il pacchetto include un Trade Manager EA che gestisce l’esecuzione dopo il
Trend Lines PRO
Roman Podpora
5 (1)
LINEE DI TENDENZA PRO       Aiuta a capire dove il mercato sta realmente cambiando direzione. L'indicatore mostra reali inversioni di tendenza e punti in cui i principali attori rientrano. Vedi  Linee BOS   Cambiamenti di tendenza e livelli chiave su timeframe più ampi, senza impostazioni complesse o rumore inutile. I segnali non vengono ridisegnati e rimangono sul grafico dopo la chiusura della barra. VERSIONE MT 5     -      Svela il suo massimo potenziale se abbinato all'indicatore   RFI LEVE
Block Master Pro
Stanislav Konin
5 (3)
The Block Master Pro indicator is designed to visually identify areas on the chart where significant volumes from major market participants are likely concentrated. These areas, known as order blocks, represent price ranges where large players place their orders, potentially signaling a price reversal and movement in the opposite direction. Key Features: Order Block Identification: Block Master Pro effectively identifies order blocks by pinpointing price ranges where large orders are placed. Th
Enigmera
Ivan Stefanov
5 (8)
ENIGMERA: Il cuore del mercato Importante: La demo di MQL5.com funziona nel Strategy Tester e potrebbe non riflettere completamente le funzionalità di Enigmera. Consulta la descrizione, gli screenshot e il video per maggiori dettagli. Non esitare a inviarmi un messaggio se hai domande! Il codice dell'indicatore è stato completamente riscritto. La versione 3.0 aggiunge nuove funzionalità e corregge i bug accumulati dall'inizio dell'indicatore. Introduzione Questo indicatore e sistema di trading
Delta Fusion Pro
Francesco Secchi
5 (2)
Delta Fusion Pro – Analisi Avanzata del Flusso Ordini per il Trading Intraday Delta Fusion Pro è un indicatore professionale per MetaTrader 4 che rivela il flusso degli ordini aggressivi, mostrando in tempo reale l’intensità e la direzione della pressione istituzionale. A differenza dei classici indicatori volumetrici, analizza la differenza (delta) tra i volumi Ask e Bid per anticipare inversioni, confermare trend e individuare zone di interesse professionale. Caratteristiche Principali Siste
Current event:  https://c.mql5.com/1/326/A2SR2025_NoMusic.gif R. Cos'è l'A2SR ?   * È un indicatore tecnico leader (nessuna riverniciatura, nessun ritardo). -- Guida : -- su https://www.mql5.com/en/blogs/post/734748/page4#comment_16532516 -- e https://www.mql5.com/en/users/yohana/blog A2SR ha una tecnica speciale per determinare i livelli di supporto (domanda) e resistenza (offerta). A differenza del modo ordinario che abbiamo visto in rete, A2SR ha un concetto originale nel determinare i li
Market Structure Patterns MT4
Samuel Manoel De Souza
5 (18)
Market Structure Patterns   è un indicatore basato sui   Smart Money Concepts   che mostra gli   elementi SMC/ICT   che possono portare le tue decisioni di trading a un livello superiore. Approfitta di   alert ,   notifiche push   e   email   per essere avvisato quando si forma un elemento sul grafico, il prezzo supera un livello e/o entra in una zona. Gli sviluppatori possono accedere ai valori degli elementi dell’indicatore utilizzando le   variabili globali , consentendo l’automazione delle d
Questo prodotto è stato aggiornato per il mercato 2026 e ottimizzato per le ultime build di MT5. AVVISO DI AGGIORNAMENTO PREZZO: Smart Price Action Concepts è attualmente disponibile a $200 . Il prezzo aumenterà a $299 dopo i prossimi 30 acquisti . OFFERTA SPECIALE: Dopo l’acquisto, inviami un messaggio privato per ricevere un bonus gratuito + regalo . Prima di tutto, vale la pena sottolineare che questo strumento di trading è un indicatore non-repainting, non-redrawing e non-lagging, il che lo
Sniper Delta Imbalance is a professional tool for deep delta analysis — the difference between buyer and seller volumes. It takes volume analysis to the next level, allowing traders to see in real time who controls the price — buyers or sellers — and to find precise entry points based on the actions of major market participants. This tool represents a unique style of analysis based on the ratio of demand and supply volumes and can be used to detect who holds control over price. At the core o
RFI levels PRO
Roman Podpora
5 (1)
L'indicatore mostra accuratamente i punti di inversione e le zone di ritorno dei prezzi in cui il       Principali attori   . Vedi dove si formano le nuove tendenze e prendi decisioni con la massima precisione, mantenendo il controllo su ogni operazione. VERSION MT5     -     Rivela il suo massimo potenziale se combinato con l'indicatore   TREND LINES PRO Cosa mostra l'indicatore: Strutture di inversione e livelli di inversione con attivazione all'inizio di un nuovo trend. Visualizzazione dei l
GOLD Impulse with Alert
Bernhard Schweigert
4.67 (12)
Questo indicatore è una super combinazione dei nostri 2 prodotti Advanced Currency IMPULSE with ALERT  +   Currency Strength Exotics . Funziona per tutti i time frame e mostra graficamente l'impulso di forza o debolezza per le 8 valute principali più un simbolo! Questo indicatore è specializzato nel mostrare l'accelerazione della forza delle valute per qualsiasi simbolo come oro, coppie esotiche, materie prime, indici o futures. Primo nel suo genere, qualsiasi simbolo può essere aggiunto all
Altri dall’autore
M W Pattern Pro
Noiros Tech
4.14 (7)
M & W Pattern Pro is an advanced scanner for M and W patters , it uses extra filters to ensure scanned patterns are profitable. The indicator can be used with all symbols and time frames. The indicator is a non repaint indicator with accurate statistics calculations. To use , simply scan the most profitable pair using the statistics dashboard accuracy , then enter trades on signal arrow and exit at the TP and SL levels. STATISTICS : Accuracy 1 : This is the percentage of the times price hits TP
Note : The slow loading of the indicator issue has been addressed . This new version loads fast and does not slow the platform. Version 1.3 : We have updated the indicator to include an historical bar scanning option . So instead of scanning all bars in the history (which can make the indicator slow sometimes ) , you can select the maximum number of bars it can scan which can increase the performance and make the indicator faster. This indicator scans the 1-3 Trendline pattern . The indicato
YOU CAN NOW DOWNLOAD FREE VERSIONS OF OUR PAID INDICATORS . IT'S OUR WAY OF GIVING BACK TO THE COMMUNITY ! >>>    GO HERE TO DOWNLOAD This system is an Heiken Ashi system based on RSI calculations . The system is a free open source script originally published on TradingView by JayRogers . We have taken the liberty of converting the pine script to Mq4 indicator . We have also added a new feature which enables to filter signals and reduces noise on the arrow signals. Background HEIKEN ASHI Th
FREE
Flag Pattern Pro
Noiros Tech
5 (4)
Flag Pattern pro is a   Price Action (PA)   analytical tool that scans the   continuation patterns   known as   "Flag and Pennant Patterns"   . Flag and Pennant patterns are continuation patterns characterized by a move in a previous trend direction after a shallow retracement usually below 50% of the original move . Deep retracements can however be sometimes found at the 61.8 % levels. The original move is know as the   flag pole   and the   retracement   is called the flag.   Indicator Funda
YOU CAN NOW DOWNLOAD FREE VERSIONS OF OUR PAID INDICATORS . IT'S OUR WAY OF GIVING BACK TO THE COMMUNITY ! >>>    GO HERE TO DOWNLOAD The   Volatility Ratio   was developed by Jack D. Schwager to identify trading range and signal potential breakouts. The volatility ratio is defined as the current day's true range divided by the true range over a certain number of days N (i.e. N periods).  How to Use Volatility Ratio The use of a volatility ratio helps to identify situations where the price of
FREE
YOU CAN NOW DOWNLOAD FREE VERSIONS OF OUR PAID INDICATORS . IT'S OUR WAY OF GIVING BACK TO THE COMMUNITY ! >>>    GO HERE TO DOWNLOAD More About Advanced Currency Meter Every good forex system has the following basic components: Ability to recognize the trend direction. Ability to identify the strength of the trend and answer the basic question Is the market trending or is it in a range? Ability to identify safe entry points that will give a perfect risk to reward (RR) ratio on every position.
FREE
YOU CAN NOW DOWNLOAD FREE VERSIONS OF OUR PAID INDICATORS . IT'S OUR WAY OF GIVING BACK TO THE COMMUNITY ! >>>    GO HERE TO DOWNLOAD This system is an Heiken Ashi system based on RSI calculations . The system is a free open source script originally published on TradingView by JayRogers . We have taken the liberty of converting the pine script to Mq4 indicator . We have also added a new feature which enables to filter signals and reduces noise on the arrow signals. Background HEIKEN ASHI Th
FREE
FRM Half Trend
Noiros Tech
3.5 (2)
YOU CAN NOW DOWNLOAD FREE VERSIONS OF OUR PAID INDICATORS . IT'S OUR WAY OF GIVING BACK TO THE COMMUNITY ! >>>    GO HERE TO DOWNLOAD   The system is a free open source pine script originally published on TradingView by everget   . It was converted to Mt4 by Forex Robot Makers. This system is a  popular trend indicator based on ATR ( Average True Range ) , Moving Averages and the Donchian channel . System BackGround ATR The average true range is an indicator of the price volatility of an asse
FREE
Volatility Ratio
Noiros Tech
4.27 (15)
YOU CAN NOW DOWNLOAD FREE VERSIONS OF OUR PAID INDICATORS . IT'S OUR WAY OF GIVING BACK TO THE COMMUNITY ! >>>    GO HERE TO DOWNLOAD The Volatility Ratio was developed by Jack D. Schwager to identify trading range and signal potential breakouts. The volatility ratio is defined as the current day's true range divided by the true range over a certain number of days N (i.e. N periods).  How to Use Volatility Ratio The use of a volatility ratio helps to identify situations where the price of a s
FREE
Channel Vertex is a price action pattern formed by price Chanel and a triangle pattern . Price channels basically indicates possible support and resistance zones around a price movement and retracement    or breakout at these levels can indicate possible trend continuation or reversal .  Majority of the times price fluctuations forms triangle patterns defined by 3 vertexes , these triangle patterns most times defines a trend continuation.  A triangle pattern is a trend continuation pattern that
High Volume Turns
Noiros Tech
4.38 (8)
YOU CAN NOW DOWNLOAD FREE VERSIONS OF OUR PAID INDICATORS . IT'S OUR WAY OF GIVING BACK TO THE COMMUNITY ! >>>  GO HERE TO DOWNLOAD Most of the time, market reversals / pull backs usually follow volume and price spikes thus  these spikes could be the first indication of an exhaustion and possible reversal/pullback. High volume Turns is an indicator that scans the market for price and volume spikes around over-bought/over-sold market conditions. These spikes when spotted serves as the first indi
FREE
Volume Strength 28
Noiros Tech
3.75 (8)
Version 1.6 ! Volume Strength 28 is better , easier to use and more awesome ! Based on complaint we got from the reviews, we understood many don't know how to really use the time frame setting on the input menu thus they have complaints of volatility, thus we have designed an Automatic Time Frame selection system that is suitable for novice traders.! The design of the indicator has been changed along with some calculation metrics. Based on complaints of high volatility we have been getting ,we
YOU CAN NOW DOWNLOAD FREE VERSIONS OF OUR PAID INDICATORS . IT'S OUR WAY OF GIVING BACK TO THE COMMUNITY ! >>>    GO HERE TO DOWNLOAD V1 Scalper is an easy to use tool designed for trend scalping. It tries to spot good entry points in a major trend by using swing high and lows formed along the trend . This tool can be used on Fx Pairs , Indices , Commodities and stocks. Not often  but in some signals , the arrow might repaint on the current candle so extra confirmation tools are advised for tr
FREE
YOU CAN NOW DOWNLOAD FREE VERSIONS OF OUR PAID INDICATORS . IT'S OUR WAY OF GIVING BACK TO THE COMMUNITY ! >>>    GO HERE TO DOWNLOAD The popular saying in forex  "The Trend is your friend"   has always stood the test of time because it is valid statement for every generation of traders and in every market. Most successful traders do not fight against the trend but lend to flow with it.  Sometimes finding the best pair to trade can be a daunting task even when you have a good strategy . Some
FREE
YOU CAN NOW DOWNLOAD FREE VERSIONS OF OUR PAID INDICATORS . IT'S OUR WAY OF GIVING BACK TO THE COMMUNITY ! >>>    GO HERE TO DOWNLOAD Camarilla Pivots Historical plots the historical data of the camarilla pivot point levels on the chart. The Camarilla Pivot levels was originated in 1989 by Nick Scott. The levels are used as primary support and resistance levels by Intraday traders. The levels are calculated with the following formula: R4 = C + RANGE * 1.1/2 R3 = C + RANGE * 1.1/4 R2 = C + RANG
FREE
YOU CAN NOW DOWNLOAD FREE VERSIONS OF OUR PAID INDICATORS . IT'S OUR WAY OF GIVING BACK TO THE COMMUNITY ! >>>    GO HERE TO DOWNLOAD Momentum channel is a simple momentum based system yet with a great degree of accuracy in detecting turning points. The market momentum are defined by Average True Range Channels . When price breaks these channels most times , it is an indication of a shift in market momentum and thus a possible new trend formation. The system can be traded on any time frame and
FREE
Ask any successful forex traders the secret of their success and they will tell you that the first key to a successful forex trading is proper trade management. Trade management is what differentiates the rookie from the pro in Forex. While the rookie trades based on emotions and greed, the pro trades based on certain logic and rules . These logic and rules are all embodied in a successful Trade Management System. Advanced Trade Manager is a combination of different trade management systems desi
Good News ! Advanced Currency Meter is more awesome now ! If you have been a fan of the free version of Advanced Currency Meter then I will implore you not to be discourage because you will soon find that the new paid version is worth every dime. Unlike the free version the new paid version of Advanced Currency Meter now has a newly added panel called the “% Daily Range” . Why A Paid Version Now? We believe you like good things and many who has used Advanced Currency Meter over the years will te
Pivots Dashboard
Noiros Tech
5 (1)
Pivots Dashboard is the single most complete instruments set for Pivot Points trading currently available in the market. We have done a comprehensive research prior to the product design to make sure that this product meets every need of Pivot Point trading. Pivots Points are significant levels technical analysts can use to determine directional movement and potential support/resistance levels. Pivot Points are thus predictive or leading indicators. While the points were originally used by floor
WOLFE WAVE PATTERNs First discovered by Bille Wolfe . The wolfe wave  is a 5 wave price action pattern that is formed by supply and demand in a market and the fight to reach equilibrium in the market . The entry spot of the pattern is defined by the breakout of the trend created by wave 1 and wave 3 . This pattern forms in any market where there is supply and demand thus it can also be used to trade commodities and stocks. Wolfe Waves are reversal patterns that usually carry a low risk margin. P
Swing Continuation
Noiros Tech
2.6 (5)
The swing continuation pattern happens in a trend direction after a short reversal / pull back . As the name suggests , these patterns occurs along the swing high and swing lows of a trend , this makes the patterns very low risk patterns with potential high rewards . The swing continuation indicator also combines Currency Meter as a filter for its execution. The idea is to go with both the price trend flow and currency trend flow. Which means the price action must be supported by the currency st
CONGESTION BREAKOUT PRO This indicator scans the breakout of congestion zones . This indicator unlike any other congestion indicator you will find in the market right now,  it uses an advanced algorithm not peculiar to most traditional congestion indicators available today . The advanced algorithm used to define the congestions  is greatly responsible for the high rate real congestion zones and low rate fake congestion zones spotted by this product. UNDERSTANDING CONGESTION Congestion are ar
The market session currency meter is an advanced currency meter designed majorly for intra-day trading. The meter tracks price movements and volatilities across the different market sessions daily. With this market meter you will be able to see how price moved within the four (4) major market sessions ( SYDNEY , TOKYO , LONDON and NEW YORK ). The indicator comes with an inbuilt daily savers time adjuster that automatically adjusts the hours for each session when ever the daily savers time (DST)
The  Complete Smart Market Concepts  indicator is your all-in-one institutional-grade tool designed to decode  Smart Money Concepts (SMC)  and reveal how the "big players" — banks, hedge funds, and institutions — truly move the forex markets. Built specifically for traders who want to trade like the smart money, this  indicator automatically identifies and plots the most essential SMC elements directly on your charts, giving you crystal-clear insights without manual drawing or guesswork.  
This Currency Meter Calculates Strength Using a currency basket of 28 pairs? This Currency Meter uses a basket of 28 currency pair to define strength. This is very important because it gives an wholesome view of the strength of a currency by considering its reaction to all major currencies paired with it. This Currency Meter is Multi-timeframe!!! Majority of the currency strength indicators around the market today only has a single time frame view. Even with the so called multi-timeframe versio
M & W Pattern Pro is an advanced scanner for M and W patters , it uses extra filters to ensure scanned patterns are profitable. The indicator can be used with all symbols and time frames. The indicator is a non repaint indicator with accurate statistics calculations. To use , simply scan the most profitable pair using the statistics dashboard accuracy , then enter trades on signal arrow and exit at the TP and SL levels. STATISTICS : Accuracy 1 : This is the percentage of the times price hits TP
Flag Pattern pro is a   Price Action (PA)   analytical tool that scans the   continuation patterns   known as   "Flag and Pennant Patterns"   . Flag and Pennant patterns are continuation patterns characterized by a move in a previous trend direction after a shallow retracement usually below 50% of the original move . Deep retracements can however be sometimes found at the 61.8 % levels. The original move is know as the   flag pole   and the   retracement   is called the flag. Indicator Fundam
This indicator scans the 1-3 Trendline pattern . The indicator is a 100 % non repaint low risk breakout system . The patterns are formed around swing high and swing lows which make them a low risk pattern with high reward. PATTERN BACKGROUND The 1-3 Trendline Breakout pattern is formed by four(4) points which are composed of three (3) primary points and the pattern neck. A trendline is always formed by the point 1 and the neck of the pattern . When price breaks out of the trendline formed , it
Channel Vertex is a price action pattern formed by price Chanel and a triangle pattern . Price channels basically indicates possible support and resistance zones around a price movement and retracement    or breakout at these levels can indicate possible trend continuation or reversal .  Majority of the times price fluctuations forms triangle patterns defined by 3 vertexes , these triangle patterns most times defines a trend continuation.  A triangle pattern is a trend continuation pattern that
CONGESTION BREAKOUT PRO This indicator scans the breakout of congestion zones . This indicator unlike any other congestion indicator you will find in the market right now,  it uses an advanced algorithm not peculiar to most traditional congestion indicators available today . The advanced algorithm used to define the congestions  is greatly responsible for the high rate real congestion zones and low rate fake congestion zones spotted by this product. UNDERSTANDING CONGESTION Congestion are ar
Filtro:
goor311
493
goor311 2023.10.25 05:08 
 

Rented the multi-time frame currency meter.So far so good. 3-4 trades and I am in profit! But I am so glad I rented it and I will buy it when time is up.I like what I see. I particularly like the strength part of the meter-I can determine how far the currency pair will go either down or up

sunnychow
9043
sunnychow 2019.07.09 15:03 
 

L'utente non ha lasciato alcun commento sulla valutazione.

testacc
616
testacc 2019.04.09 07:26 
 

I have spent a lot of time with various currency meters and know their strengths, weaknesses and failings. This currency Meter is a robust useful and effective tool. Although it is Daily, Weekly and Monthly, because of the way it works it is far more sensitive at those settings than you would intuitively expect. That is why one of the reviews here find it changes so often on lower timeframes. The daily for instance picks up intra day trends well that are tradeable on a 1min timeframe at s/r (once a trend is established) well without being quite as sensitive as some other methods. It strikes a good optimal balance for me between sensitive and stable. The developer has modded it so it is stable when it starts on a new period.

I have contacted the developer for help and he has been extremely accommodating, quick to reply and more helpful than I'd have expected.

Joyospa
130
Joyospa 2018.05.07 06:34 
 

Does not work. Just see gray screen

Noiros Tech
103229
Risposta dello sviluppatore Nesimeye Oswald 2025.10.16 01:26
scootr
48
scootr 2018.02.03 03:43 
 

L'utente non ha lasciato alcun commento sulla valutazione.

petesill
46
petesill 2018.01.30 14:11 
 

L'utente non ha lasciato alcun commento sulla valutazione.

janacrane
55
janacrane 2018.01.30 11:43 
 

L'utente non ha lasciato alcun commento sulla valutazione.

Michalangelo
343
Michalangelo 2017.12.23 20:23 
 

Didnt get what is promised. Calculations change too fast. at one moment GBP is weakest in all TFs, 5 minutes after it is strongest on all TFs. Totally useless, it doesnt help you decide which currency pair to trade. I also rented currency strength trader which was also totally useless. Wish I could get my money back.. Not even satisfied. 1 star

Noiros Tech
103229
Risposta dello sviluppatore Nesimeye Oswald 2025.10.16 01:25
Rispondi alla recensione