Stochastic MT5 TFs by your choice
- Indikatoren
- Version: 5.9
- Aktualisiert: 18 November 2021
- Aktivierungen: 5

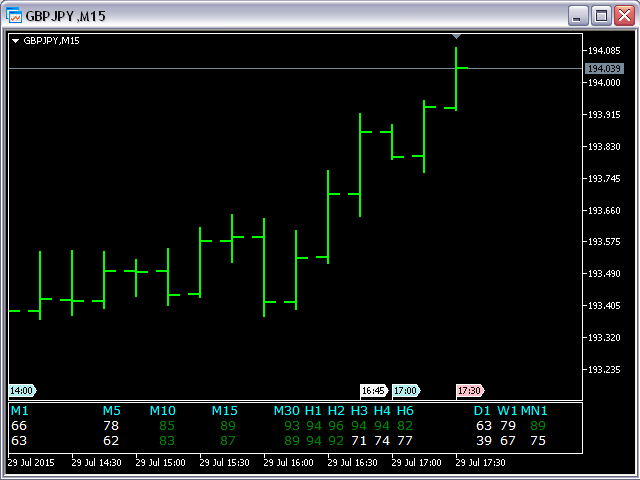
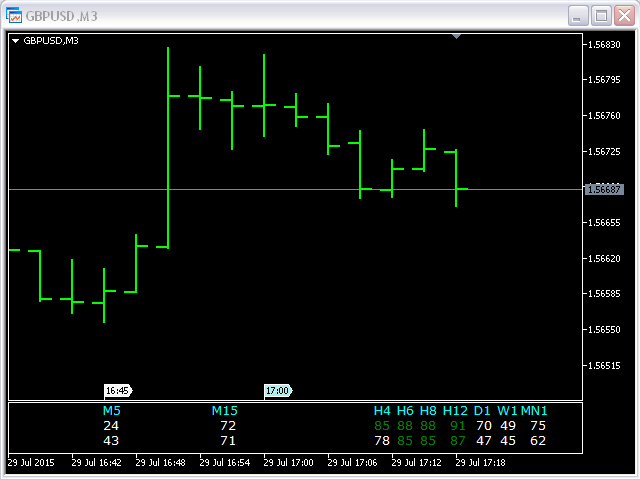
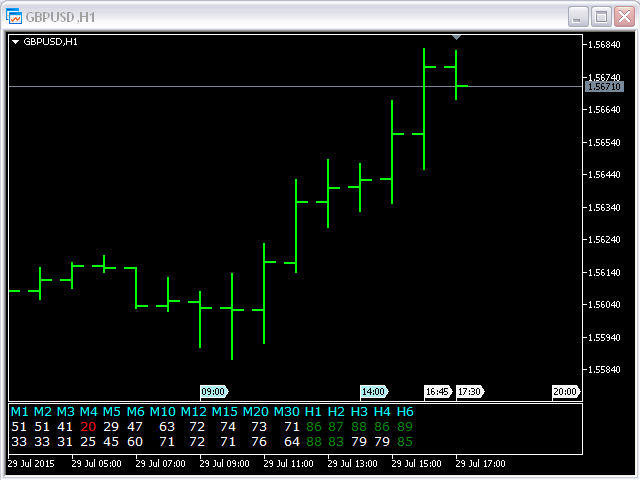
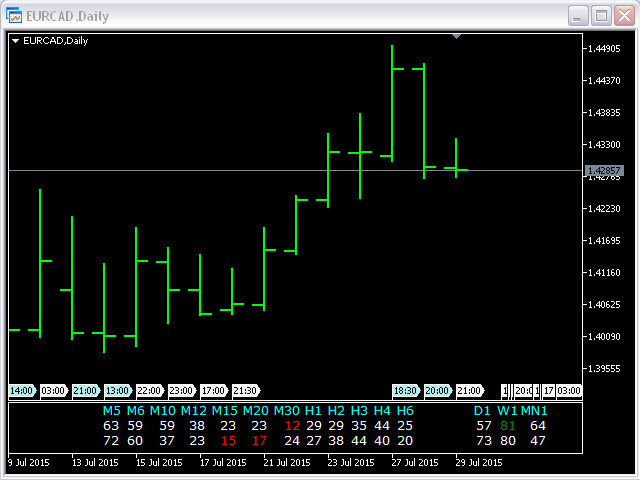
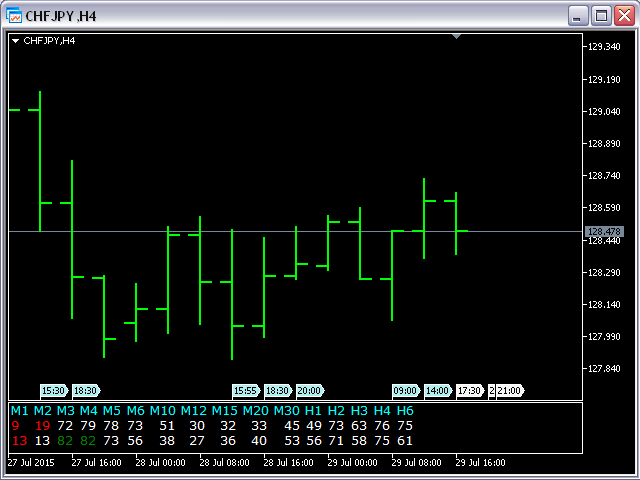
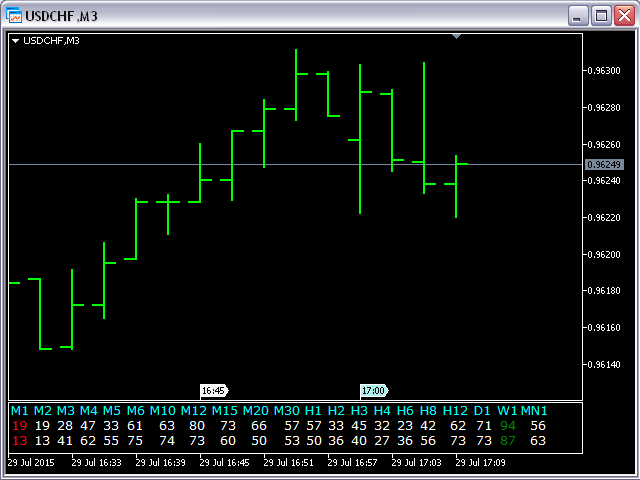
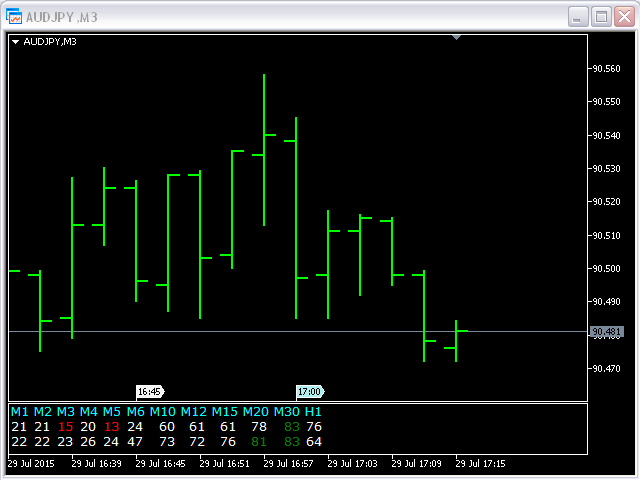
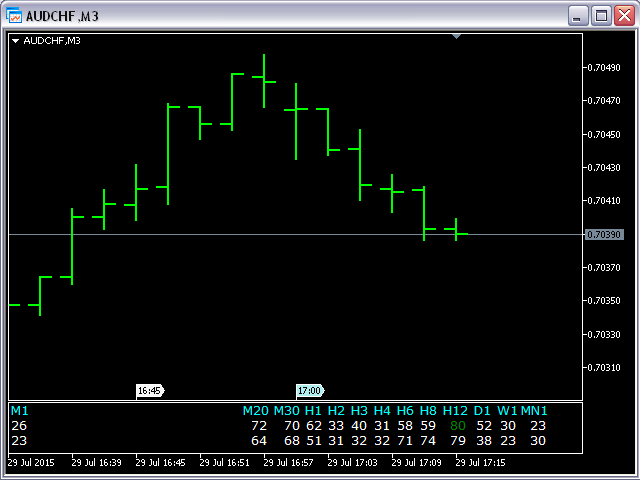
Dieser Indikator basiert auf dem klassischen Stochastik-Oszillator und wird für diejenigen hilfreich sein, die nicht nur eine visuelle, sondern auch eine digitale Darstellung des Indikators lieben und zu nutzen wissen. Stochastik MT5 Indikator zeigt Werte aus jedem Zeitrahmen:
- M1, M2, M3, M4, M5, M6, M10, M12, M15, M20, M30, H1, H2, H3, H4, H6, H8, H12, D1, W1, UND MN1.
Sie können die Haupteingabeparameter für jede Stochastik für jeden TF ändern und Sie haben die Wahl, welche TFs Sie sehen möchten.
Der Indikator zeigt die digitale Darstellung der Hauptlinie (%K) und der zweiten Linie (%D) an.
Beispiel für M1
- TF_M1 = wahr;
- K_Periode1 = 5;
- D_Periode1 = 3;
- S_Periode1 = 3;
- ENUM_MA_METHOD Methode1 = MODE_SMA;
- ENUM_STO_PRICE Preis1 = STO_LOWHIGH;
Eingabeparameter:
- OverboughtLevel = 80;
- OversoldLevel = 20;
- aColor = clrAqua; - Farbe für die Beschriftung der TFs;
- wColor = clrWhite; - Farbe für die Daten zwischen OverboughtLevel und OversoldLevel;
Hinweis
- Wenn Sie das Währungspaar für den geöffneten Chart ändern, müssen Sie einige Sekunden (nächster Tick) auf die Neuberechnung warten.
- Bevor Sie diesen Indikator verwenden, müssen Sie alle Charts (alle TFs) für die aktuellen Währungspaare öffnen.