Up Down v6
- 지표
- 버전: 16.0
- 업데이트됨: 6 2월 2026
- 활성화: 5
on demo mode use date to work.
on version 13 wave added.13.1 histogram and trigger line can be changeble.
wave can be set 200-500. can have different signal on wave 200
on version 14 ema used.so can see mountly chart signals also.
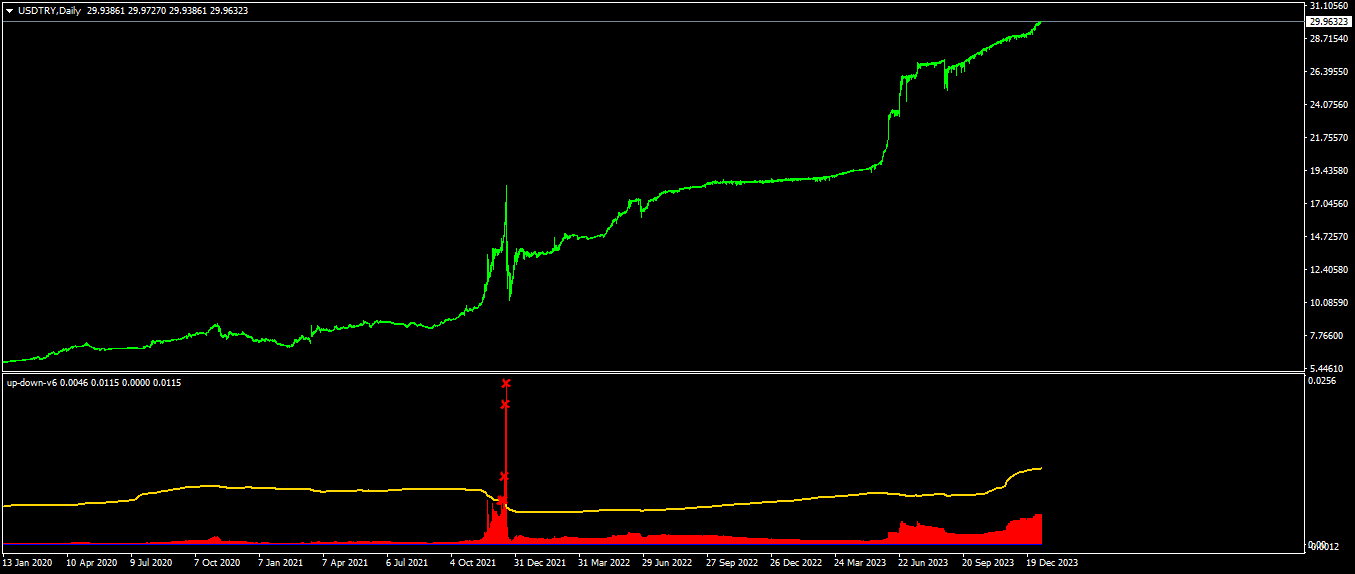
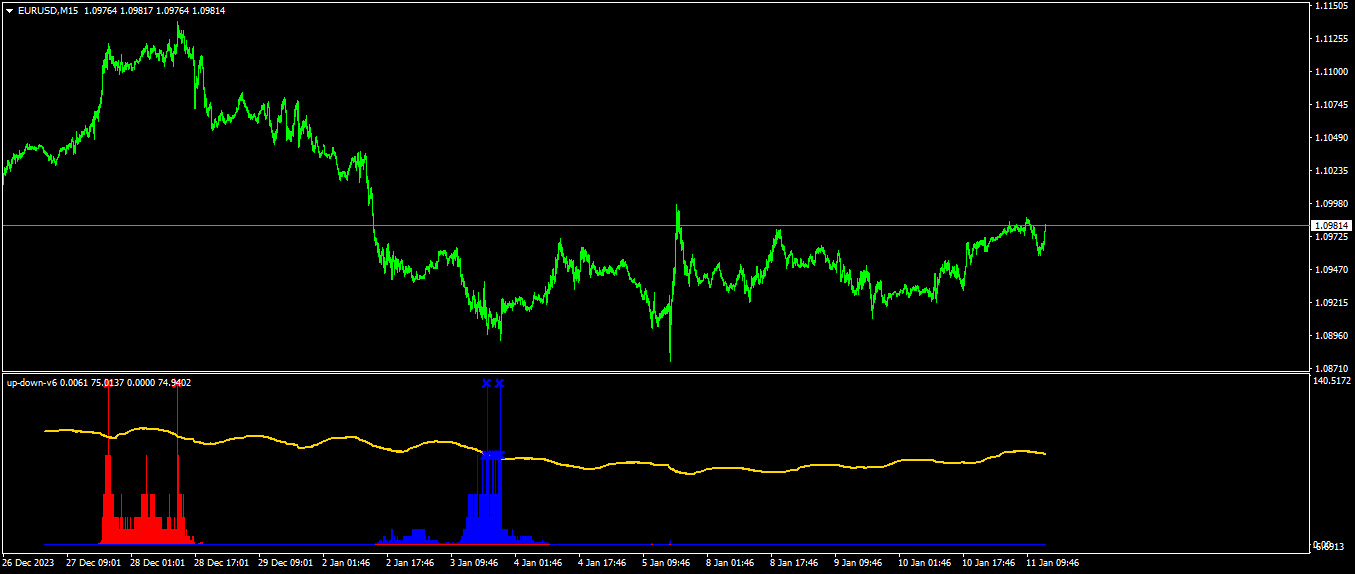
up-down indicator is no repaint and works all pairs and all time frames charts.
it is suitable also 1 m charts for all pairs.
and hold long way to signal.
dont gives too many signals.
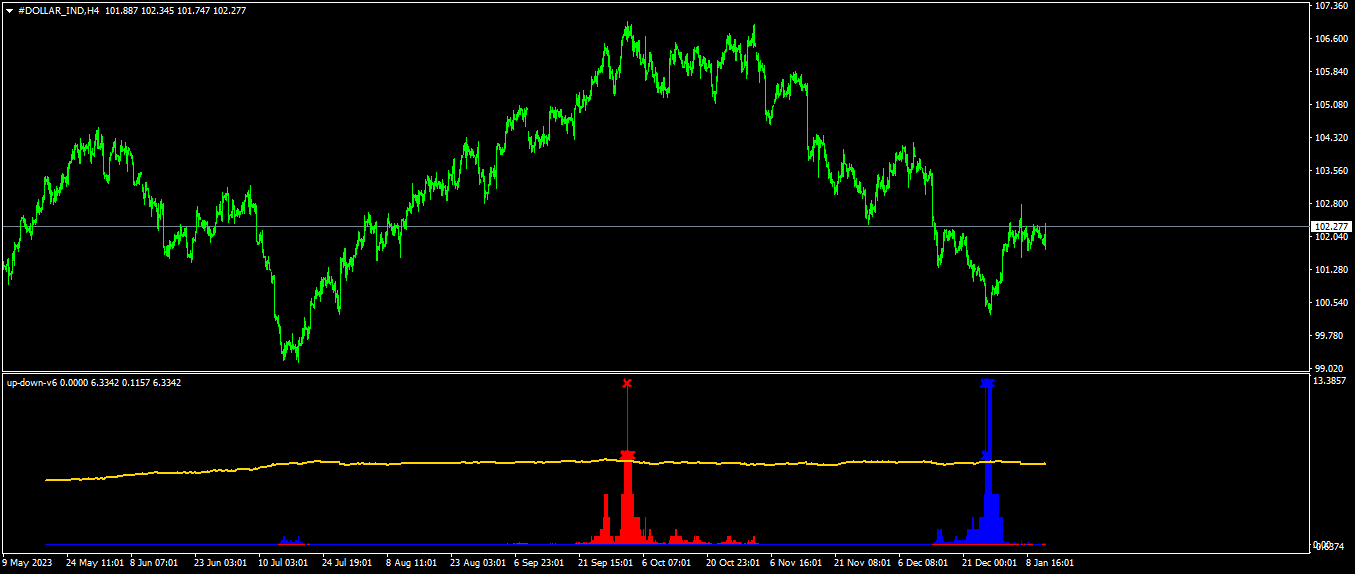
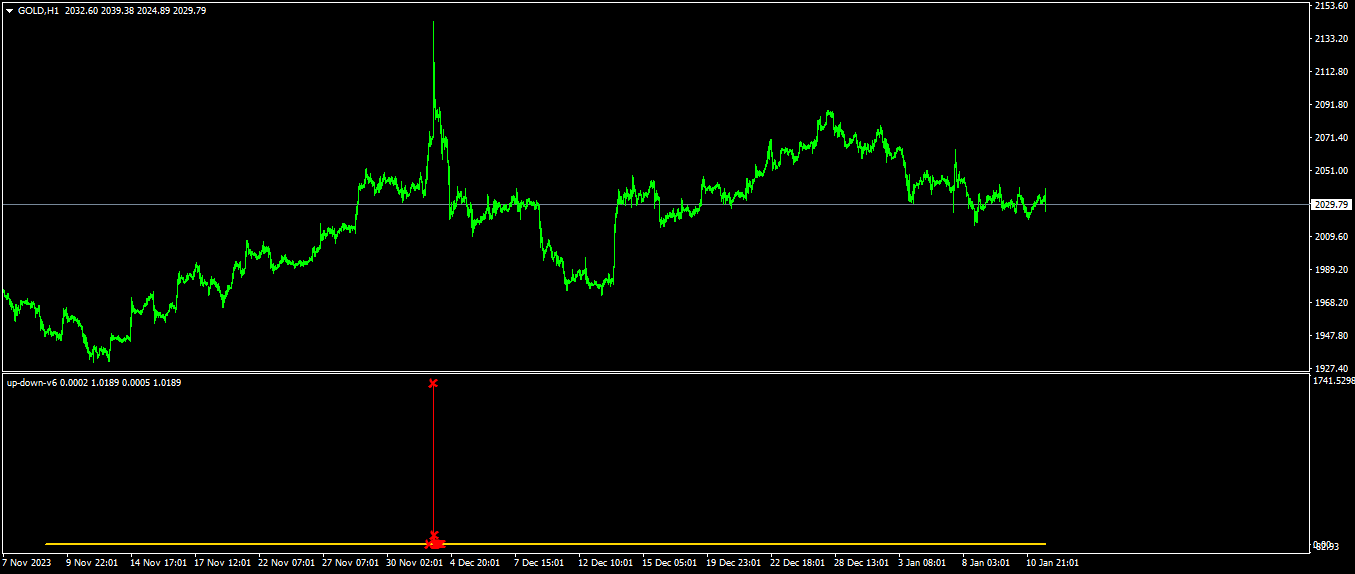
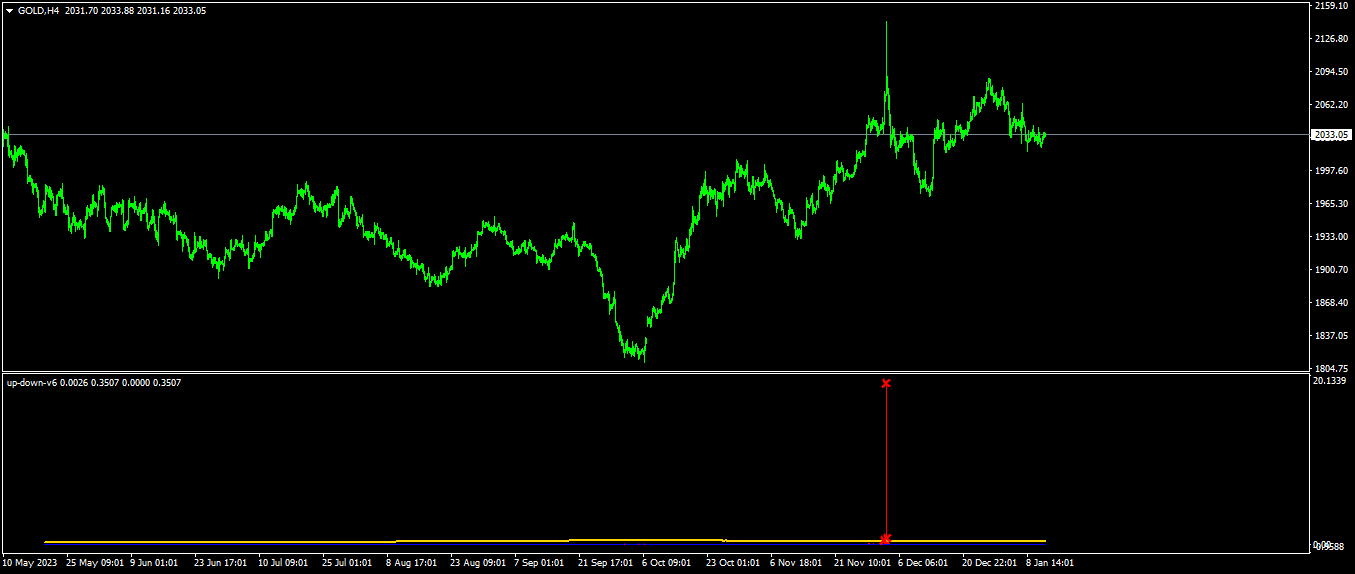
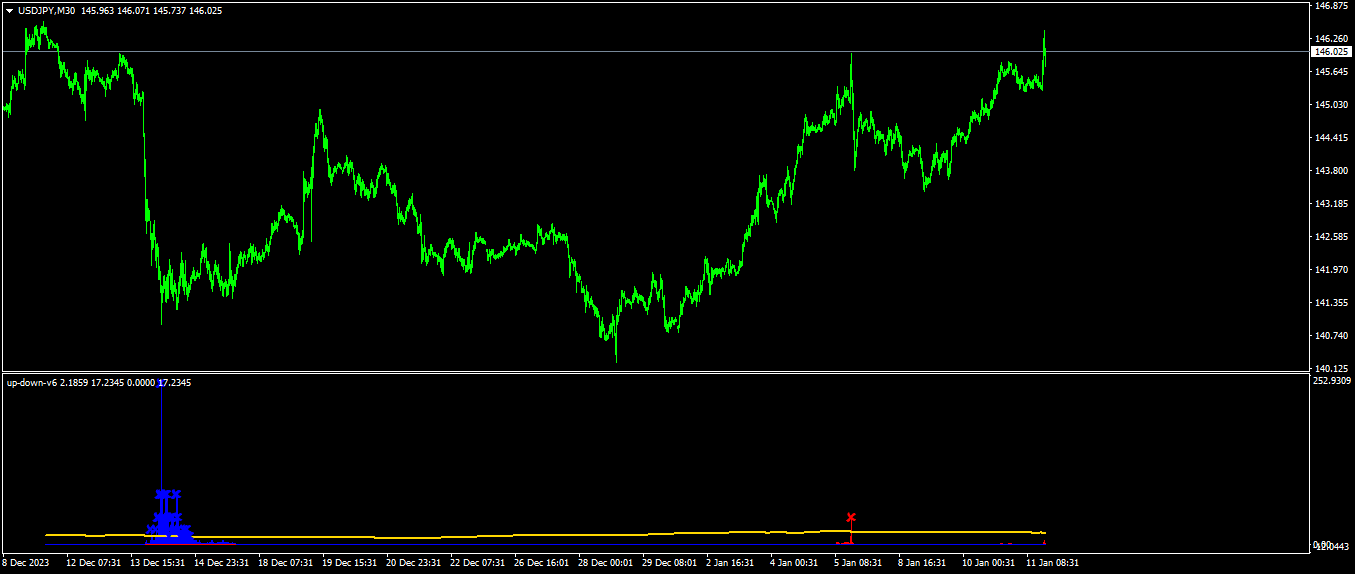
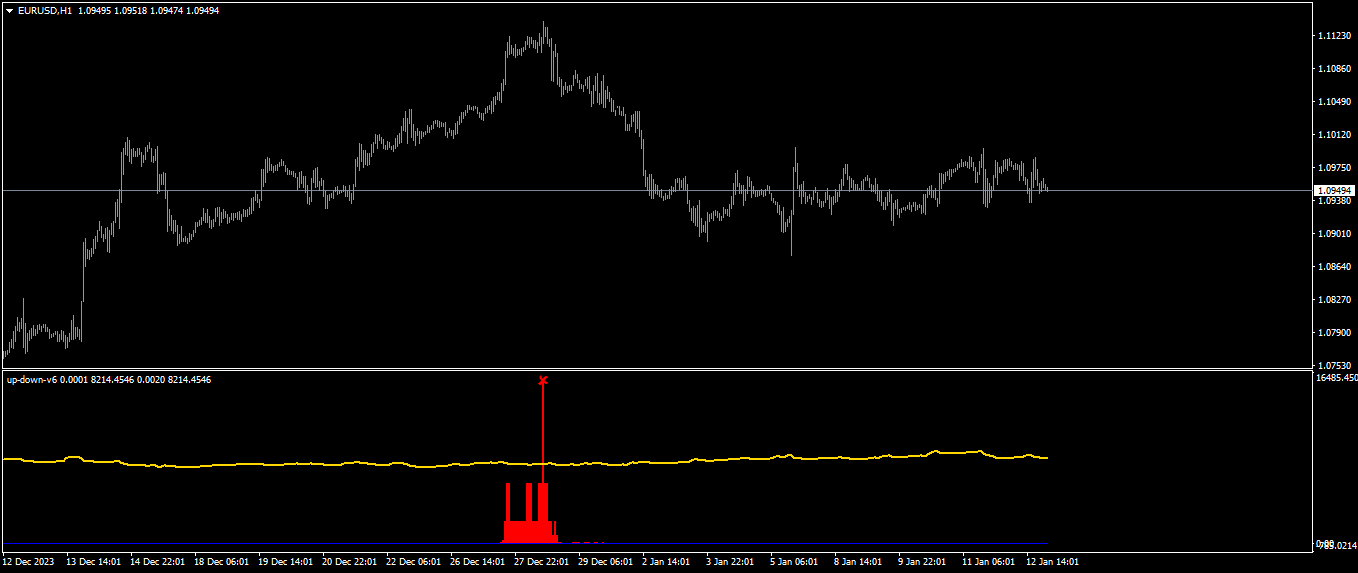
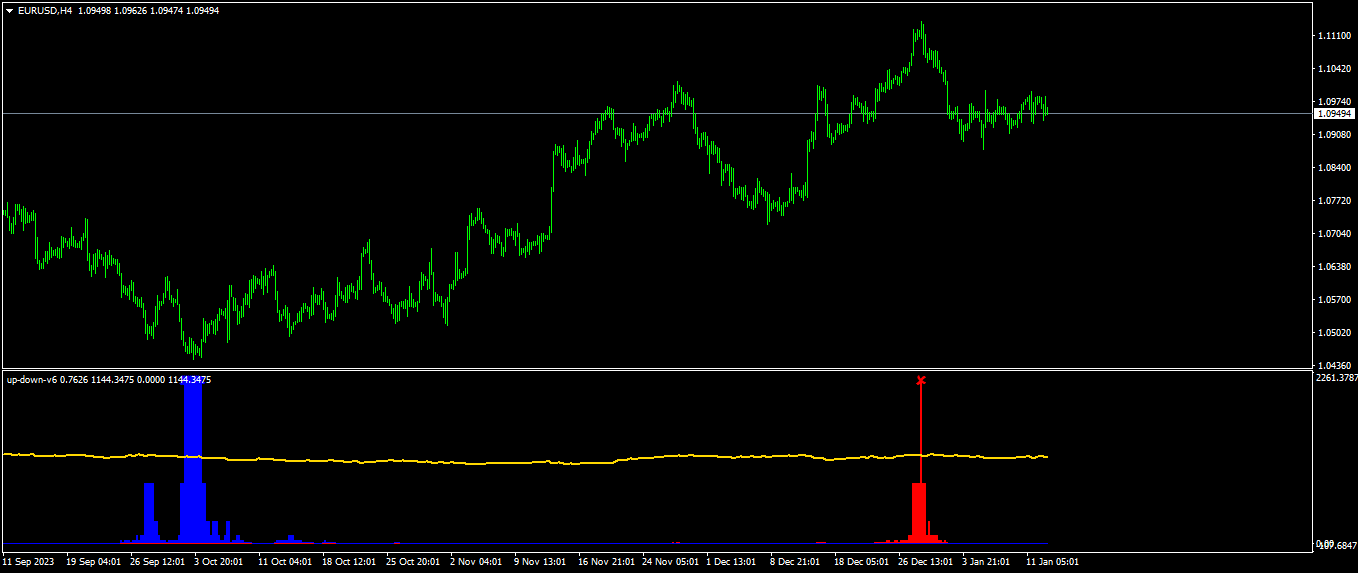
when red histogram cross trigger line that is up signal.and price probably will down
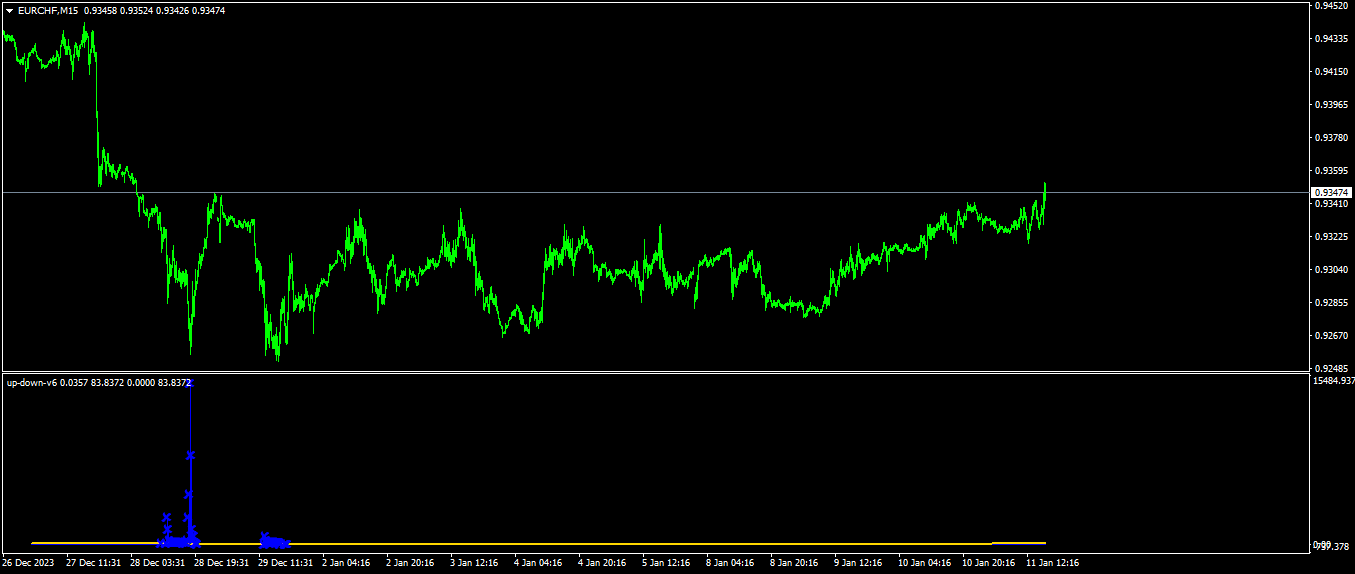
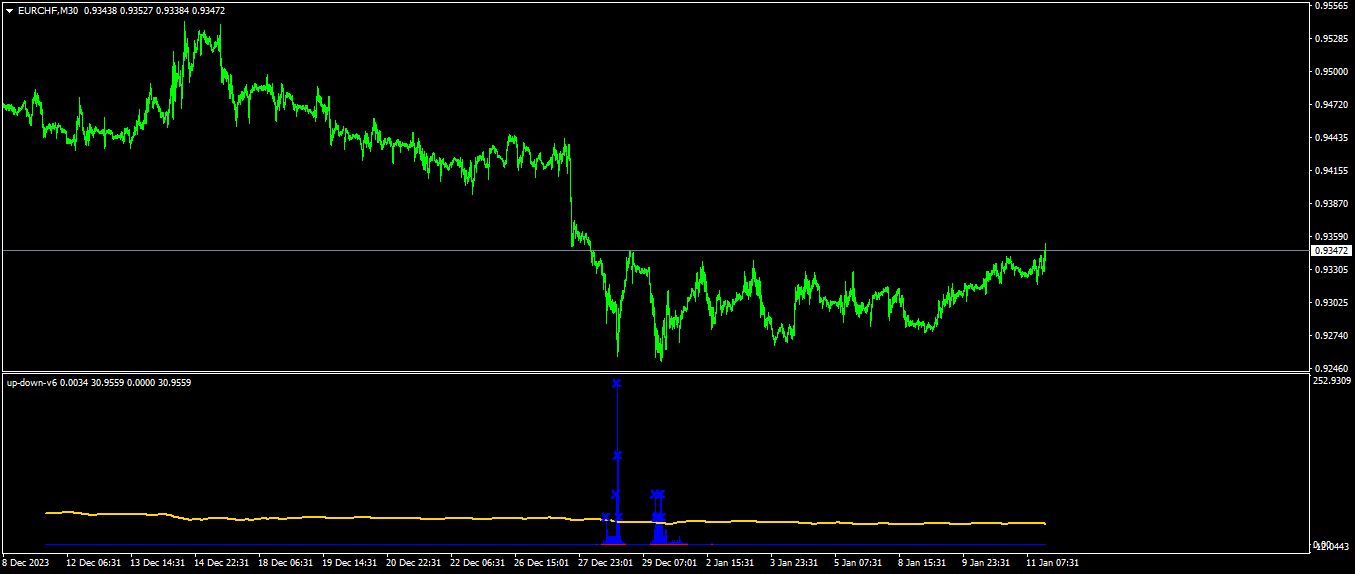
when blue histogram cross trigger line that is down signal.and price probably will go up.
when the signals not seen press + button on terminal .
i have ad the c value.default is 2.7
also you can set the signals with the c value increasing or decreasing however you want acordig to the chart
thise value need to change acording to pair you use.
set the value in daily periot or h4 periot to up and down places has seen.
after that ,use same c value for that pair
you will see sometimes h4 signal sometimes 15 m.different periots.
when the signal has been seen any periot chart act acording to it.
thise system is a mathematic kind of aproach to prices to find up, down points.


Amazing indicator! i tested it for 6 months.You need to monitor this indicator well enough to understand how it works. Thanks Guner Koca!
Highly recommended!