Neue Handelsroboter und Indikatoren für den MetaTrader 5 - 138

Täglich Wöchentlich Monatlich Hoch Tief - Ihr ultimatives Werkzeug für präzise Marktanalysen
Die 200 Gratis-Download-Aktion ist beendet. Der Preis ist jetzt aktualisiert worden. Vielen Dank an alle!
Sie lieben es? Hassen Sie es? Lassen Sie es mich in einer Bewertung wissen! Funktionswünsche und Ideen für neue Tools sind sehr willkommen :)
Probieren Sie "Der AUDCAD Trader" :
https://www.mql5.com/en/market/product/151841 Überblick:
Verbessern Sie Ihre Handelsstrategie mit Daily Weekly Monthly

Haben Sie es satt, Dutzende von Charts manuell zu schließen oder mehrere Positionen einzeln zu verwalten?
Mit Close All Pro können Sie Ihren Arbeitsbereich blitzschnell aufräumen - das spart Zeit, reduziert das Durcheinander und rationalisiert Ihren Trading-Workflow. Sie lieben es? Hassen Sie es? Lassen Sie es mich in einer Bewertung wissen! Funktionswünsche und Ideen für neue Tools sind sehr willkommen :) Probieren Sie "The AUDCAD Trader" aus :
https://www.mql5.com/en/market/product/151841 ️
FREE

Smart Hedge Trader - MT5 Expert Advisor Link zur MT4-Version Smart Hedge Trader MT4 Smart Hedge Trader ist ein MT5 Expert Advisor, der entwickelt wurde, um Trades mit einem dynamischen Hedging-Ansatz in Kombination mit konfigurierbaren Risikokontrollen zu verwalten. Er analysiert die Marktbedingungen und führt kalkulierte Strategien aus, um das Risiko über mehrere Positionen hinweg zu verwalten. Dieser EA eignet sich für Händler, die ein strukturiertes, automatisiertes Handelssystem suchen, das

ECN ProSmart: Ein innovativer Algorithmus für den Intersessionshandel In der schnelllebigen Welt des Devisenhandels, in der jede Sekunde zählt, ist ein revolutionäres Tool entstanden - ECN ProSmart. Dieser Expert Advisor automatisiert nicht nur den Handel, sondern verändert den Ansatz für den Handel an der Schnittstelle globaler Sessions, indem er intelligente Analyse und Flexibilität der Strategien kombiniert. Mit dem Markt synchronisierte Präzision ECN ProSmart basiert auf der Untersuchung der

Die Verwendung von Breakout EA (Expert Advisor) hat eindeutige Vorteile gegenüber dem manuellen Breakout-Handel und kombiniert die Stärken von Breakout-Strategien mit der Leistungsfähigkeit der Automatisierung in MQL4/MQL5 wie folgt:
Vorteile der Verwendung von Breakout EA 1. 100% automatisch
Der EA kann Breakout-Punkte erkennen und sofort Handelsaufträge senden, ohne dass Sie den Bildschirm beobachten müssen
Geeignet für Strategien, die "Geschwindigkeit" bei der Eingabe von Aufträgen nach de

Gold Boom - Professionelle Goldhandels-Explosion (XAU/USD) Gold Boom ist ein moderner Expert Advisor (EA) auf Basis von MQL5, der speziell für den Handel mit XAU/USD (Gold) entwickelt wurde.
Er nutzt ein professionelles Pending-Order-System , das auf High-Frequency Trading (HFT) -Techniken basiert, ähnlich denen, die von führenden institutionellen Handelsunternehmen verwendet werden. Wichtige Informationen: Hauptsymbol: XAU/USD (Gold) Mindesteinlage: $200 Mindest-Hebelwirkung: 1:30 Empfohlener Z

Signale aus dem Telegram-Kanal auf MT4/MT5 kopieren (Telegram Bot muss als Admin im Kanal hinzugefügt werden) Eingabe * Telegram-Bot-Token: Holen Sie sich Ihr Bot-Token durch Chatten mit @BotFather * Multi-Order für Multi-TP-Signale * Signale filtern nach "nicht enthaltenem Text" * Option zum Ändern/Schließen per Antwortnachricht * Range Entry Modus: Keine offene Order, wenn der Preis außerhalb der Range liegt Einrichtung auf Ihrem MT4/MT5: - MT4/MT5 => Tools => Optionen => Expert Advisors => Hä

Gold EA: Bewährte Leistung für den 1-Minuten-Goldhandel Verwandeln Sie Ihr Trading mit unserem Gold EA, der sorgfältig für 1-Minuten-Charts entwickelt wurde und in 5 Jahren ein Wachstum von über 2000% von nur $100-$1000 erzielt hat. Kein Martingale, keine KI-Gimmicks : Reine, bewährte Strategien mit robustem Geldmanagement, Stop Loss und Take Profit für eine zuverlässige Performance über mehrere Charts hinweg. Flexible Handelsmodi : Wählen Sie Fixed Balance für sichere Gewinne, Mark IV für kühne

Momentum Echo - Real-Multi Currency Alert System Überblick: Momentum Echo ist ein Echtzeit-Warnsystem zur präzisen Preisüberwachung. Es identifiziert aggressive Marktbewegungen und erfasst kritische Momente, in denen sich der Preis entgegen der normalen Spanne bewegt, was ein mögliches Zeichen ist: Verpassen Sie nie ein Retracement, selbst wenn Sie nicht an Ihrem Handelscomputer sitzen Stop Hunts zur Eliminierung von Handelspositionen Volatilität bricht aus Konsolidierungszonen aus Der Preis ver

GoldenPulse XAU Trend EA ist ein präzisionsgefertigter Expert Advisor, der ausschließlich für den Handel mit XAUUSD (Gold) entwickelt wurde. Er nutzt eine robuste Konvergenz von vier leistungsstarken Indikatoren - Standardabweichung, Stochastik-Oszillator, Williams' %R und MACD-Signal - um hochwahrscheinliche Trend- und Momentum-Setups auf dem Goldmarkt zu erkennen. Mit dem Schwerpunkt auf Volatilitätsfilterung, überkauften/überverkauften Umkehrungen und Momentum-Bestätigung passt sich der EA d

ATR RiskMaster - Losgrößenberechnung auf Basis der ATR-Volatilität ATR RiskMaster 1.00 ist ein leistungsstarkes Dienstprogramm (läuft als Expert Advisor oder Indikator), das die Berechnung von Losgrößen, Stop-Loss- und Take-Profit-Levels auf der Grundlage der Marktvolatilität unter Verwendung der Average True Range (ATR) automatisiert. Perfekt für Trader, die Wert auf konsequentes Risikomanagement und Präzision legen. Erklärte Eingaben & Funktionen ️ RiskPercent (1.0%)
Legt den Prozentsatz

️ PropShield ist Ihr automatischer Wächter für die Herausforderungen von Eigenhandelsunternehmen und finanzierten Konten. Wenn Sie schon einmal an einer Herausforderung gescheitert sind, weil Sie das tägliche Drawdown-Limit nur um ein paar Dollar überschritten haben, oder wenn es Ihnen schwerfällt, Ihre eigenen Risikoregeln während volatiler Märkte durchzusetzen, dann ist PropShield für Sie gemacht. Dies ist keine Handelsstrategie - es ist ein Sicherheitssystem, das Ihr Konto rund um die Uhr ü

Beschreibung: Advanced Position Closer EA überwacht Ihre offenen Marktaufträge pro Symbol, zeigt die Zählungen direkt auf Ihrem Chart an und schließt die Aufträge automatisch, wenn konfigurierbare Schwellenwerte erreicht werden. Er unterstützt sowohl globale als auch symbolbezogene Einstellungen für Richtung, Gewinn/Verlust-Filterung und die Entscheidung, ob alle übereinstimmenden Orders geschlossen werden sollen oder nur diejenigen, die Ihre Filter durchlaufen haben.
Externe Parameter:
1. Glo

RexCatch EA wurde entwickelt, um alle Formen von Boxen oder Rechtecken mit der angegebenen Farbe zu erkennen, die später für die Ausführung von Aufträgen verwendet werden, sowohl Kauf als auch Verkauf in Form von Angebot und Nachfrage. Dieser EA ist auch in der Lage, auf dem Chart installierte Indikatoren zu lesen, die Kästchen- oder Rechteckformen anzeigen, wie z.B. der Angebots-Nachfrage-Indikator oder Kästchen und Rechtecke, die manuell erstellt werden, indem man ihnen die in den EA-Einstellu
CYP Trade Manager Pro MT5: Der Vorteil des Traders im Positionsmanagement
Transformieren Sie Ihr Handelsmanagement - konzentrieren Sie sich auf das Wesentliche Warum die meisten Trader scheitern - und wie der CYP Trade Manager Pro das Problem löst
Viele Trader haben solide Einstiegsstrategien, aber es fehlt ihnen an einem angemessenen Handelsmanagement - dem entscheidenden Unterschied zwischen Profis und Amateuren. Der CYP Trade Manager Pro kümmert sich um die kritische "After-Entry"-Phase de

Dieser EA implementiert eine Range-Trading-Strategie mit drei Schlüsselindikatoren: Bollinger Bänder : Identifiziert überkaufte (oberes Band) und überverkaufte (unteres Band) Bedingungen Standardperiode: 20, Abweichung: 2,0 Relative Stärke Index (RSI) : Bestätigt überkaufte/überverkaufte Bedingungen Standard-Periode: 14 Überkaufte Schwelle: 70 Überkaufter Schwellenwert: 30 Gleitender Durchschnitt : Bestimmt die allgemeine Trendrichtung Standard-Periode: 35 (SMA) Einstiegsbedingungen: Kaufsignal
FREE
️ **Drawdown Tracker Pro** - Intelligente Risikokontrolle für Prop-Trader Viele Trader scheitern an der Herausforderung ihrer Prop-Firma, nicht weil sie schlecht sind sondern weil sie ihren Equity Drawdown nicht deutlich genug und in Echtzeit verfolgen. Dieses Tool behebt dieses Problem. Der **Drawdown Tracker Pro** ist ein fortschrittlicher MT5-Indikator, der für Trader entwickelt wurde, die innerhalb der täglichen Drawdown-Grenzen bleiben müssen. - insbesondere bei Herausforderungen mit FTM
Engulfing with EMAs Indicator
Nutzen Sie die Möglichkeiten der fortschrittlichen Erkennung von Candlestick-Mustern mit dem Engulfing with EMAs Indicator , einem hochmodernen Tool für MetaTrader 5. Dieser futuristische Indikator kombiniert die Präzision der Engulfing-Musteranalyse mit der Trendfolgestärke der exponentiellen gleitenden Durchschnitte (EMA 21 und EMA 50) und versetzt Händler in die Lage, hochwahrscheinliche Setups für alle Währungspaare und Zeitrahmen zu identifizieren. Hauptmerkm

GoldenNight ist ein Expert Advisor (EA), der speziell für den Handel mit dem XAUUSD während der ruhigen Nachtsitzung entwickelt wurde.
Die Strategie ist einfach, und der Code ist robust. Der EA kann zwischen 19 :00 und 23:00 Uhr mehrere Long-Trades eröffnen, wobei eine Grid-Funktion einen zusätzlichen Trade ermöglicht, um den Einstieg zu optimieren. Es ist ein adaptiver Trailing-Stop-Mechanismus implementiert, der einen integrierten ATR-Indikator (Average True Range) zur dynamischen Anpassung

Suchen Sie nach einer einfachen und effektiven Möglichkeit, Ihre Handelssignale auf dem neuesten Stand zu halten? Mit TradeLink können Sie jetzt alle Ihre MQL5-Handelssignale direkt und einfach an Telegram senden! Warum ist TradeLink die richtige Wahl für Sie? Benutzerfreundlichkeit: Kein technisches Fachwissen erforderlich. Geben Sie einfach Ihren Token ein und beginnen Sie mit dem Senden von Alarmen. Ultra-schnell: Sofortige Warnmeldungen, sobald Signale auf MQL5 erscheinen. Hohe Sicherh
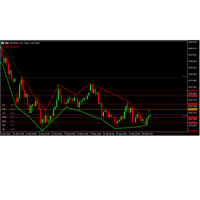
Vorteile des AutoTrendlinesMTF_WithRSI-Indikators Multi-Timeframe-Trendlinien Zeichnet automatisch Unterstützungs-/Widerstands-Trendlinien auf mehreren Zeitrahmen (aktuell, H1, H4). Einstellbarer Rückblickzeitraum ( LookbackBars ) und Swing-Stärke ( SwingStrength ) zur Anpassung. Tägliche Pivot-Punkte Berechnet und zeigt tägliche Pivot-Ebenen (P, R1/S1, R2/S2, R3/S3) mit anpassbaren Farben an. Schalten Sie die Sichtbarkeit für jedes Niveau einzeln um. Automatische Fibonacci-Verschiebung Zeichnet
Überblick:
TrendPro ist ein hochmoderner Indikator, der auf der Kreuzung von drei anpassbaren Exponential Moving Averages (EMAs) basiert. Er wurde für alle Zeitrahmen entwickelt, identifiziert präzise bullische und bearische Momentum-Zonen und stellt klare Kauf-/Verkaufspfeile dar. Mit einem integrierten Side-Market-Filter und optionalen Pop-up-Warnungen hilft Ihnen TrendPro, jede Gelegenheit zu ergreifen, ohne Rauschen oder falsche Signale. Hauptmerkmale: Präzise Trend-Erkennung Nutzt drei EMA

KingTrend - Preisaktions-Trendanalyse-Tool KingTrend ist ein Trendfolge-Indikator, der auf den seit langem bewährten Price-Action-Prinzipien von Highs, Lows, Open und Close basiert. Die Logik hinter diesem Tool beruht auf Konzepten, die mir von meinem Mentor vermittelt wurden und die ich in Code umgesetzt habe, um eine konsistente Strukturerkennung zu gewährleisten. Merkmale: Identifiziert die Marktstruktur anhand der Preisaktionslogik Erkennt die Trendrichtung und wichtige Wendepunkte Markiert

Der SuperTrend Advance Trading ist ein weit verbreiteter technischer Indikator, der auf SuperTrend Strategy + Price Action + EMA basiert. Wie er funktioniert: - Kauf-/Verkaufssignale können generiert werden, wenn der Trend sich umkehrt und die Bedingungen der Preisaktion, der Trendlinie und des EMA erfüllt sind. - Nachdem das Signal erscheint, warten Sie geduldig, bis die Kerze schließt, und geben Sie dann die Order so schnell wie möglich auf. Sie haben dann Zeit, Ihren Einstieg zu überprüfen un

CloseAllOrders Protected EA
Ein-Klick-Trade-Manager mit Lizenzschutz & Konto-Währungs-P/L-Zielen Übersicht
Dieser Expert Advisor bietet drei Chart-Schaltflächen, mit denen Sie mit einem einzigen Klick alle Trades, Gewinntrades oder Verlusttrades sofort schließen können. Sie können auch ein gleitendes Gesamtgewinn- oder Verlustziel in der Basiswährung Ihres Kontos festlegen; der EA schließt automatisch alle Positionen, wenn das Ziel erreicht ist, und deaktiviert sich dann selbst, bis Sie ein ne

DRAGON SCALE Benutzerhandbuch Visualisierung von Indikatoren Der DRAGON SCALE-Indikator zeigt mehrere visuelle Elemente auf dem Diagramm an: Skalenzone - Wird als violette Bereiche (Akkumulationszonen) und rote Bereiche (Distributionszonen) angezeigt, die das Pivot-Level umgeben. Lifebeat Signal - Erscheint als Pfeil unterhalb der Kerze, wenn der Preis in eine kritische Zone eintritt. Die Farbe des Pfeils zeigt die Richtung an (grün für bullish, rot für bearish, gelb für neutral). Einstiegs-C

Wie man sie benutzt 1. Einstellung der Parameter Momentum-Periode : Passen Sie die Parameter je nach den Eigenschaften des Handelspaares an. Verwenden Sie niedrigere Werte (8-12) für volatile Paare und höhere Werte (14-20) für stabilere Paare. Kumulationsperiode : Passen Sie den Wert je nach Zeitrahmen an. Verwenden Sie niedrigere Werte (3-5) für niedrigere Zeitrahmen (M5-M30) und höhere Werte (5-10) für höhere Zeitrahmen (H1-D1). Schwellenwert für Energieausbrüche : Entsprechend der gewünschten

Einführung in den Storm Survivor Forex Scalping Robot Wir stellen Ihnen unseren fortschrittlichen Storm Survivor Forex Scalping Robot vor. Der Algorithmus des Roboters basiert auf den beiden Indikatoren RSI und MA, um Einstiegs- und Ausstiegspunkte mit hoher Wahrscheinlichkeit zu erkennen. Er wird mit der DCA-Methode kombiniert, um sicherzustellen, dass jeder Handel die höchsten Erfolgschancen hat. Das beste Währungspaar für den Einsatz von Storm Survivor ist XAU/USD. Dieser Roboter ist perfekt

PULSAR ZONE MT5 Indikator Beschreibung PULSAR ZONE ist ein benutzerdefinierter MT5-Indikator, der für die Zonierung von Signalen auf der Grundlage von Volumendruck und Trendrichtung entwickelt wurde. Er ist ideal für das Scalping volatiler Paare und bietet klare visuelle Hinweise für Ein- und Ausstiegspunkte. Hauptmerkmale Lifebeat Signal Ein visuelles Signal, das ausgelöst wird, wenn eine Trendumkehr mit erheblichem Volumendruck eintritt. Es wird als grüner (bullish) oder roter (bearish)

Der Heracles ist dafür gemacht, den Markt zu schlagen, in Backtests tut er das auch. Die Heracles verwendet High und Low, um die Ebenen der potenziellen Umkehr zu identifizieren. Die besten Parameter der Heracles ist standardmäßig eingestellt, und bevor Sie sie ändern, ist es wichtig, Backtest sie. Dies ist unsere Empfehlungen: 1) Bester Handelswert - EURUSD (oder jedes andere wichtige Forex-Paar) 2) Bester Zeitrahmen - 1 Stunde 3) Beste Hebelwirkung - von 1:5 bis 1:30 4) Empfohlenes Guthaben -

Breakout Retest Optimiert für GBPUSD
️ Wichtiger Nutzungshinweis (zuerst lesen!)
- Dieser EA wurde speziell für GBPUSD auf dem M15-Chart optimiert.
- Dieser EA wurde unter Berücksichtigung eines hohen Risiko-Ertrags-Verhältnisses entwickelt.
- Die Einstellungen, die im Backtest für GBPUSD (im Screenshot) verwendet werden, sind (für aggressiven Handel gedacht):
o RiskPercent = 3.0% pro Trade
o Target Reward:Risk Ratio = 4:1
o Partial Take-Profit bei 3R
- Andere Symbole werden derzeit unterstütz

Der Pranavtrxx (Autor) Levels Indicator ist ein präzisionsbasiertes Handelsinstrument, das entwickelt wurde, um wichtige Preisniveaus auf dem Markt zu identifizieren und Händlern zu helfen, fundierte Ein- und Ausstiegsentscheidungen zu treffen. Dieser Indikator stellt automatisch dynamische Unterstützungs- und Widerstandszonen dar, die sich aus der historischen Kursentwicklung, psychologischen Kursniveaus und der aktuellen Marktstruktur ergeben. Unabhängig davon, ob Sie Daytrader oder Swingtrade

Unsere Handelsstrategie ist stark vom Konzept des Smart Money beeinflusst, bei dem wir zunächst die Markttrends auf dem 1-Stunden-Zeitrahmen analysieren. Wir ermitteln die nächstgelegenen Angebots- oder Nachfragezonen und unterteilen sie entsprechend nach Größe und Handelszeit - ob Asien, London oder New York. Jede Zone hat bestimmte Verfallszeiten; kehrt der Preis innerhalb dieser Zeitspannen in die Zone zurück, betrachten wir dies als Handelsmöglichkeit. Wenn Sie Fragen haben oder weitere Unte

Applied Silver BLT ist eine einfache Umsetzung der ICT Silver Bullet Strategie. Die Strategie ist für Händler mit einem fairen Verständnis der zeitbasierten algorithmischen Modell, das den Handel Einträge innerhalb bestimmter einstündigen Intervallen während des Handelstages mit S mart Money Konzepte wie Liquidität und fairen Wert Gaps fangen beinhaltet beabsichtigen . Fühlen Sie sich frei zu versuchen und passen Sie meinen Bot. Die AM-Sitzung Silver Bullet (10:00 AM - 11:00 AM) Die PM-Sitzung S

LIVE-SIGNAL MIT ECHTEM HANDELSKONTO: Standard MT4 (Mehr als 7 Monate Live-Handel): https://www.mql5.com/en/signals/2329380
IC Markets MT5 (Mehr als 5 Monate Live-Handel): https://www.mql5.com/en/signals/2340132
Forex EA Trading Channel auf MQL5: Treten Sie meinem MQL5-Kanal bei, um die neuesten Nachrichten von mir zu erhalten. Meine Community mit über 14.000 Mitgliedern auf MQL5 .
NUR NOCH 3 VON 10 EXEMPLARE ZUM PREIS VON 399 $ VERFÜGBAR! Danach steigt der Preis auf 499 $.
Der Expert Advisor

EA Forex Scalping ist ein Expert Advisor, der speziell für drei Hauptwährungspaare entwickelt wurde: EURUSD, USDJPY und GBPUSD. Signale Nur noch 1 Exemplar von 10 zu diesem Preis verfügbar. Nächster Preis: $699.99 Verfügbar für MT4 und MT5
Kein Grid, kein Martingale, keine KI, kein neuronales Netzwerk, kein Arbitrage. Jeder Trade hat einen festen Stop Loss (SL), der je nach Währungspaar variiert. Gewinne werden durch einen Trailing Stop gesichert. Dieser EA läuft seit über 6 Monaten auf Live-K

Crystal Volume Profile Auto POC — Volumenanalyse für präzise Handelsentscheidungen Überblick
Crystal Volume Profile Auto POC ist ein Indikator für MetaTrader 5, der die Volumenverteilung berechnet und automatisch den Point of Control (POC) anzeigt. Damit können Trader wichtige Unterstützungs- und Widerstandszonen auf Basis von Handelsvolumen identifizieren. Hauptfunktionen Dynamisches Volumenprofil (sichtbarer Bereich oder benutzerdefinierter Bereich) Automatische POC-Erkennung Anpassbare Histo
FREE

Ich stelle vor: Quant Fleet MT5 2.0! Quant Fleet arbeitet mit fünf verschiedenen, unabhängigen Strategien im USDJPY. Dies führt zu einer bereits breiten Diversifizierung im EA selbst. Der Unterschied zum Quant Fleet EA 1.0 ist, dass er sechs zusätzliche untergeordnete Strategien enthält. Dies unterstützt die Performance und bietet eine höhere Handelsfrequenz. Start-Promo:
Der Preis wird erhöht, sobald die ersten 20 Lizenzen verkauft wurden. Öffentliche Gruppe: Join
Dokumentation und Vorein
Crystal Volume Indicator – Intelligentes Volumen-Analyse-Tool für MT5 Crystal Volume ist ein fortschrittlicher und dennoch benutzerfreundlicher Volumen-Indikator, der Tradern hilft, die verborgene Stärke hinter Preisbewegungen visuell zu interpretieren. Durch die Kombination von Preisaktionen mit Volumendynamik hebt dieses Tool wichtige Volumenereignisse wie Buying Climax , Selling Climax und Schwache Kerzen hervor. Hauptfunktionen: Echte Volumenanalyse – Unterstützt Tick- und Echtzeitvo
FREE

Zusammenfassung
EagleFX ist ein vollautomatischer Expert Advisor (EA) für MetaTrader 5, der rund um die Uhr hochpräzise algorithmische Handelsstrategien über verschiedene Instrumente hinweg ausführt. Er eliminiert emotionale Einflüsse, testet jedes Signal umfassend rückwirkend, passt Risikoparameter dynamisch an und nutzt fortschrittliche, maschinelles Lernen inspirierte Memorienmodule zur kontinuierlichen Leistungsoptimierung. Kontinuierliche, emotionslose Ausführung
Permanente Marktüberwach

LogicFlow AI – Multistrategie-Tradingroboter für XAUUSD (Gold) Logikbasiertes Trading · Starke Risikokontrolle · Kein Martingale Was ist LogicFlow AI? LogicFlow AI ist ein hochentwickelter Multistrategie-Expert Advisor (EA) , der speziell für den Handel mit XAUUSD (Gold) entwickelt wurde.
Er arbeitet vollständig ohne Indikatoren , ohne Martingale , ohne Grid-Strategien und ohne Hedging – nur reine Preisaktionslogik ( Price Action ). ️ Der Fokus liegt auf qualitativ hochwertigen Setups ,

EASY Insight – Smarter Trading beginnt hier Überblick
Was wäre, wenn Sie den gesamten Markt – Forex, Gold, Krypto, Indizes und sogar Aktien – in wenigen Sekunden scannen könnten, ganz ohne manuelles Chart-Screening? EASY Insight ist Ihr KI-bereites Export-Tool, das Indikator-Daten in umsetzbare Handelsintelligenz verwandelt. Entwickelt für Trader, die keine Zeit mehr mit Rätselraten und visueller Überforderung verschwenden wollen, liefert es einen kompletten Marktüberblick in einer einzigen üb

Einführung in den Super Gold Trend Expert Advisor (EA)
Erschließen Sie das Potenzial des trendbasierten Ausbruchshandels mit Super Gold Trend , einem leistungsstarken und intelligenten Expert Advisor für den Handel mit XAUUSD (GOLD) . Dieser EA basiert auf einer Trendfolgestrategie und nutzt schwebende Aufträge , um präzise Einstiege zu ermöglichen, indem er sich an der Marktliquidität orientiert und so eine höhere Genauigkeit und Rentabilität gewährleistet. Signal | Setfile Start-Promo! Exklus

Der SMC Sessions Indicator ist ein Präzisionstool für Smart Money-Trader , die auf ICT-Konzepte, Liquiditätssuche und sitzungsbasierte Strategien vertrauen. Er bildet kritische sitzungsbasierte Handelszonen nahtlos ab und verwendet dabei die bewährtesten und beliebtesten Konzepte, die von Tradern auf institutioneller Ebene verwendet werden. Dieser All-in-One-Sitzungsindikator überlagert Ihr Diagramm mit den effektivsten und wahrscheinlichsten Bereichsstrategien, einschließlich:

Der New York Range Indicator ist ein sitzungsbasiertes Analysetool für Händler , die ICT-Konzepte (Inner Circle Trader) , Smart Money-Trading und institutionelle Preisaktionsmethoden anwenden. Dieser Indikator wurde speziell für die New Yorker Sitzung entwickelt und erfasst die Preisspanne zwischen 12:00 und 14:00 Uhr GMT , einem kritischen Zeitraum, der sich mit dem London Close und der New York Open überschneidet. Er identifiziert Sitzungshochs und -tiefs , er

Der Weis Wave Scouter Basic ist die essenzielle Version unseres renommierten Indikators für MetaTrader 5, entwickelt für Trader, die die Konzepte der Wyckoff-Methode und der VSA-Analyse (Volume Spread Analysis) auf zugängliche und effiziente Weise erkunden möchten. Basierend auf der Analyse von Volumenwellen ermöglicht dieser vereinfachte Indikator eine klare Erkennung von Marktbewegungen, wobei der Schwerpunkt auf den Prinzipien Aufwand vs Ergebnis sowie Angebot und Nachfrage liegt, wie von Ric
FREE

American Dream MT5 Hebelroboter: Extrem riskant, mit dem Risiko, 100 % des investierten Kapitals zu verlieren. Der Roboter zielt darauf ab, aus 10 USD in kürzester Zeit 100.000 USD zu machen. Daher sind Hebelwirkung und Risiko maximal, aber kontrollierbar. Achtung: Das Risiko ist maximal. Sie können Ihr Konto pleitegehen. Seien Sie vorsichtig bei der Nutzung dieses Roboters. Sie können Ihr gesamtes Geld verlieren. Bei bewusster Nutzung könnte er jedoch der beste Roboter Ihres Lebens sein, und S

Guten Tag, lieber Händler!
Wir präsentieren Ihnen den SSTrading-Multiwährungsexperten für das MT5-Terminal. Seine Arbeit basiert auf positiven Korrelationen zwischen Währungspaaren. Der geplante Arbeitszeitraum ist H4, die Anzahlung beträgt 1.000 $. Die wichtigsten Arbeitspaare sind EURUSD, GBPUSD, AUDUSD, NZDUSD, USDCHF, USDCAD.
Der Experte sucht und bearbeitet die Preisspanne von Währungspaaren. Bei bestimmten Werten eröffnet es einen Deal zum Kauf des darunter liegenden Währungspaares. Und

Entdecke die Kraft des Volumens mit Volume Thermal Vision Bist du bereit, dein Trading auf das nächste Level zu heben? Wir präsentieren Volume Thermal Vision, den ultimativen Volumen-Indikator für MetaTrader 5, der die Volumenanalyse in einen strategischen Vorteil verwandelt. Entwickelt für Trader, die Gelegenheiten mit hoher Wahrscheinlichkeit identifizieren möchten, eignet sich dieser Indikator perfekt für Methoden wie VSA (Volume Spread Analysis), ICT (Inner Circle Trader), SMC (Smart Money C
FxS Moving Average EA Ein Expert Advisor für gleitende Durchschnittswerte mit mehreren Strategien für MetaTrader 5
Überblick Der FxS Moving Average EA ist ein leistungsstarker, benutzerfreundlicher Expert Advisor, der sechs bewährte Moving-Average-Strategien in einem flexiblen Handelssystem integriert. Entwickelt für Trader, die Wert auf Einfachheit, Leistung und individuelle Anpassung legen, bietet dieser EA Ihnen die volle Kontrolle über Ihren bevorzugten Handelsansatz, Ihr
FREE

Entdecken Sie die Kraft der fortschrittlichen Volumenanalyse mit dem Weis Wave Scouter, einem revolutionären Indikator für MetaTrader 5, der die bewährten Prinzipien der Wyckoff-Methode und der Volume Spread Analysis (VSA) vereint. Entwickelt für Trader, die Präzision und Tiefe in ihren Operationen suchen, bietet dieser Indikator eine taktische Marktlesung durch die Analyse von kumulierten Volumenwellen und hilft dabei, Schlüsselpunkte für Trendwenden und -fortsetzungen zu identifizieren.
Weis W
Volume Thermal Vision Basic ist die vereinfachte Version des renommierten Indicators Volume Thermal Vision, entwickelt für Trader, die die Volumenintensität praktisch und effizient analysieren möchten. Mit 6 Stufen lebendiger Farben können Sie zwischen den Modi StealthMode, NightVision und FrostVision wählen, um Volumendaten klar und strategisch darzustellen. Perfekt für Einsteiger oder als Ergänzung Ihrer Analyse – dieser Indikator ist leicht, intuitiv und ideal, um Ihre Handelsentscheidungen z
FREE

ICT Order Flow Matrix Automatisierte Erkennung institutioneller Order-Blöcke für MetaTrader 5
Überblick Verbessern Sie Ihre Charts mit echten Einblicken in institutionelle Orderflüsse. ICT Order Flow Matrix durchsucht die Kursbewegung in Echtzeit, um zu ermitteln, wo Banken, Hedgefonds und Proprietary Trading Desks ihre größten Aufträge platzieren. Anschließend werden diese „Order Blocks“ als dynamische Unterstützungs- und Widerstandszonen im Chart angezeigt – manuelles Zeichnen entfällt.

Der London Session Breakout Strategy Indicator richtet sich an Trader, die ICT (Inner Circle Trader) und Smart Money Concepts (SMC) verfolgen. Er konzentriert sich auf sitzungsbasierte Liquiditätssuche, Killzones und das Verhalten von Market Makern während der Londoner Sitzung. Dieses Tool erfasst die höchsten und niedrigsten Kursniveaus zwischen 00:00 und 07:00 Uhr GMT , die allgemein als London Killzone oder Market Maker Range bezeichnet werden. Es hilft Tr
GoldHunter EA - Präziser Goldhandel mit festem TP/SL GoldHunter EA ist ein vollautomatischer Expert Advisor, der speziell für den Handel mit XAUUSD (Gold) entwickelt wurde. Er verwendet eine Strategie, die ausschließlich auf Preisaktionen basiert - keine Indikatoren, kein Raster, kein Martingal. Jeder Handel folgt einem strengen Risikomanagementmodell mit festen Take Profit (TP) und Stop Loss (SL) für maximale Konsistenz. GoldHunter wurde von einem jungen 17-jährigen Entwickler ohne Anfangskapit

No Brain Gold EA
***************************************************************************************************************
Der einfachste Expert Advisor der Welt!
Sie müssen lediglich die MT5-Plattform einbinden.
Kein Lernen, keine Parameter, keine Einrichtung, kein Monitoring!
Sie müssen lediglich das GOLD-Symbol Ihrem Broker zuordnen und in einen 5-Minuten-Chart einfügen. DAS IST ALLES!
Seine Intelligenz ist jedoch nicht einfach: Er nutzt verschiedene Indikatoren und Steigungen,

Handeln Sie eine sehr beliebte Londoner Breakout-Strategie auf das prestigeträchtige GBP/USD-Paar unter Verwendung von Kursbewegungen, Tick-Volumina und ausgeklügeltem Handelsmanagement. Holen Sie sich diese Strategie (mql5 Top Ten für 6+ Monate) mit einem massiven Rabatt – 149 $ zum Start und bald 299 $ (UVP 1.099)
Live-Signal
Kontaktieren Sie mich, bevor Sie live handeln, um Anweisungen, Handbuch und Bonus zu erhalten!*
Quantum King (Alpha) ist ein leistungsstarker, hochentwicke

Send me a message so I can send you the setfile Dieser Bot verwendet eine Crossover-Strategie mit gleitendem Durchschnitt (MA) und integriertem Risikomanagement sowie optionaler Martingale-Funktion.
Kernparameter:
MagicNumber – Eindeutige ID für die Trades des Bots zur Vermeidung von Konflikten. FixedLotSize – Basis-Tradegröße (z. B. 0,01). FastValue/SlowValue – Perioden für schnelle und langsame MAs (z. B. 3 und 6). ReverseLogic – true: Verkauf, wenn der schnelle MA den langsamen MA überschr

Golden Days MT5 Hebelroboter, extrem riskant, mit dem Risiko, 100 % des investierten Kapitals zu verlieren. Achtung: Das Risiko ist maximal. Sie können Ihr Konto tatsächlich pleitegehen. Seien Sie vorsichtig bei der Nutzung dieses Roboters. Sie können Ihr gesamtes Geld verlieren. Wenn Sie ihn jedoch bewusst nutzen, könnte er der beste Roboter sein, den Sie je benutzt haben, und Sie werden nie wieder einen so guten Roboter finden. Über den Golden Days V1 Roboter: Er ist mein umfassendstes und kom
DAX WaveTimer: PREISAKTION! Diese fast – GESCHENKT – Preisaktion ist nur für BEGRENZTE ZEIT verfügbar. Jetzt kaufen! Neu: WaveTiming präsentiert stolz einen vollautomatischen DAX-Trading-Bot.
Interessantes Zusatzfeature: benutzerdefinierbarer, einstellbarer prozentualer Kapitaleinsatz (Equity-Risiko). Wir versuchen nicht, den Markt vorherzusagen. Stattdessen wurde DAX WaveTimer entwickelt, um sowohl auf Aufwärts- als auch auf Abwärtstrends effektiv zu reagieren.
Das Grundkonzept ist klar und ef

Legacy Anchor für MT5 Extrem riskanter Roboter mit konservativen Zielen, die ungefähr dem von Ihnen in der Executive-Konfiguration gewählten Wert entsprechen. Weniger mutige und konservativere Ziele, dennoch bleibt er aggressiv. Achtung: Das Risiko ist maximal. Sie können Ihr Konto tatsächlich ruinieren. Seien Sie vorsichtig bei der Nutzung dieses Roboters. Sie können Ihr gesamtes Geld verlieren. Wenn Sie ihn jedoch bewusst nutzen, könnte er der beste Roboter sein, den Sie je genutzt haben, und

Kit-Trader Golden Days für MT5 Ein umfassender und äußerst effektiver Kurszettel, der Sie beim Trading unterstützt. Trading selbst ist sehr schwierig. Kein Wunder, dass 97 % der Trader Verlierer sind und die Trades der 3 % Gewinner finanzieren. Dieser Kurszettel soll Ihr Trading-Niveau verbessern und Ihnen mehr Kontrolle über Ihre Orders geben. Ein Kurszettel mit Stop-Loss, Take-Profit, Trailing-Stop und dynamischen Orderanpassungen unterstützt Trader bei: Risiken kontrollieren – Stop-Loss begre

Der ICT London Open Killzone Indicator ist ein Smart Money -basiertes Handelstool für Devisenhändler, die institutionelle Konzepte wie ICT, SMC (Smart Money Concepts) und liquiditätsbasierte Marktstrukturstrategien verfolgen. Dieser Indikator hebt die London Open Killzone hervor, insbesondere von 06:00 bis 08:00 GMT , eine Sitzung, die für ihre Volatilität und Preisverschiebung aufgrund überlappender Liquiditätsflüsse zwischen der asiatischen Sitzung und der Eröffnung

IGold AI ist ein neuer EA mit fortschrittlicher Technologie. Diese neue Technologie nutzt KI und maschinelles Lernen, um den Preisvergleich von XAUUSD mit den Kursspannen in der Datenbank zu diversifizieren, die Struktur zu destrukturieren und potenzielle Orders für ein einzigartiges Scalping zu finden.
Künstliche Intelligenz arbeitet hauptsächlich mit unserem Server. Wir haben eine einzigartige Technologie integriert, die beim Preisvergleich den Preis in Echtzeit auf unserem Server vergleicht
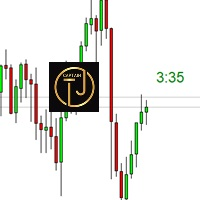
Der CTJM Candle Timer Indicator ist ein robustes Tool, das für Trader entwickelt wurde, die MetaTrader 5 verwenden. Es wurde mit Präzision entwickelt und zeigt die verbleibende Zeit für die aktuelle Kerze auf einem Handelsdiagramm an, so dass Händler den Markt effektiver überwachen und zeitnahe Entscheidungen treffen können. Mit einer anpassbaren visuellen Schnittstelle können die Benutzer Farben, Schriftgröße und Positionierung nach ihren Wünschen einstellen. Zu den wichtigsten Funktionen dies
FREE

Dieser Expert Advisor (EA) sucht nach kleinen Preisunterschieden zwischen drei Währungspaaren – GBPUSD, NZDUSD und GBPNZD – und handelt, wenn er eine Kurslücke findet, die größer als der übliche Spread ist.
Timing und Spread prüfen Er prüft außerdem, wie aktuell jeder Preis ist, um sicherzustellen, dass nicht auf alten Daten gehandelt wird. Der EA berücksichtigt nur dann Trades, wenn die Differenz größer als ein benutzerdefinierter Spread-Schwellenwert (in Punkten) ist. Dadurch wird der Handel

PolePole EA – Intelligente und Zuverlässige Handelsautomatisierung PolePole EA ist ein intelligenter und benutzerfreundlicher Expert Advisor (EA), der für den Handel mit XAUUSD/XAUEUR entwickelt wurde und eine Strategie auf Basis mehrerer technischer Indikatoren nutzt. Mit dem Ziel, Einfachheit und Leistung zu verbinden, hilft er Tradern aller Erfahrungsstufen, ihre Handelsaktivitäten präzise und konstant zu automatisieren. Live-Signal hier
Nach dem Kauf von PolePole kontaktieren Sie mich, um e

XAUAI Trading Robot - Beschreibungsübersicht XAUAI ist ein fortschrittlicher algorithmischer Trading-Roboter, der von künstlicher Intelligenz angetrieben wird und speziell für den Goldhandel entwickelt wurde. Das System nutzt eine ausgeklügelte mehrschichtige KI-Architektur, um Marktbedingungen zu analysieren und Trades mit Präzision auszuführen. Hauptmerkmale KI-gestützte Analyse : Verwendet 10 verschiedene KI-Neuronenkerne, die gleichzeitig arbeiten, um Marktdaten in Echtzeit zu verarbeiten Ad
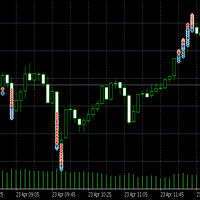
MAScalperEA ist ein leistungsstarker und agiler Handelsroboter, der für schnelles Scalping auf dem M1-Chart entwickelt wurde. Durch die Kombination eines dynamischen Moving Average Crossover-Systems mit einer intelligenten Chartmuster-Erkennung sorgt er für eine hohe Einstiegswahrscheinlichkeit in Trendmärkte. Mit robustem Risikomanagement, anpassbarer Losgröße, Trailing Stops und Trendfilterung über mehrere Zeitrahmen hinweg ist MAScalperEA Ihr zuverlässiges Werkzeug, um sich in der schnellen W

Giant Grid AI Intelligenter Handelsroboter - Funktionsübersicht 1. Produktübersicht Der Giant Grid AI Intelligent Trading Robot ist eine fortschrittliche automatisierte Handelslösung, die speziell für den Devisenmarkt (Forex) entwickelt wurde. Er kombiniert die klassische Grid-Trading-Strategie mit dem Fuxi-Hexagramm-Indikator und KI-Algorithmen , um automatisch hochfrequente "buy low, sell high"-Handelsgeschäfte durchzuführen. Dieser EA (Expert Advisor) ist ideal für Trader, die konstante Gewi
Der MetaTrader Market ist die beste Plattform für den Verkauf von Handelsroboter und technischen Indikatoren.
Sie brauchen nur ein gefragtes Programm für die MetaTrader Plattform schreiben und schön gestalten sowie eine Beschreibung hinzufügen. Wir helfen Ihnen, das Produkt im Market Service zu veröffentlichen, wo Millionen von MetaTrader Benutzern es kaufen können. Konzentrieren Sie sich auf dem Wesentlichen - schreiben Sie Programme für Autotrading.
Sie verpassen Handelsmöglichkeiten:
- Freie Handelsapplikationen
- Über 8.000 Signale zum Kopieren
- Wirtschaftsnachrichten für die Lage an den Finanzmärkte
Registrierung
Einloggen
Wenn Sie kein Benutzerkonto haben, registrieren Sie sich
Erlauben Sie die Verwendung von Cookies, um sich auf der Website MQL5.com anzumelden.
Bitte aktivieren Sie die notwendige Einstellung in Ihrem Browser, da Sie sich sonst nicht einloggen können.