Neue technische Indikatoren für den MetaTrader 5 - 48

Dies ist ein echter Trendlinien-Indikator für MT4/MT5.
Dieser Indikator zeichnet echte Trendlinien.
Normalerweise wird die Trendlinie als durchgezogene Linie gezeichnet.
Die nächste Trendlinie, die wahrscheinlich gültig sein wird, wird als gepunktete Linie gezeichnet.
Die letzte ungültig gewordene Trendlinie wird als gestrichelte Linie gezeichnet.
Dreistufige Linien werden in hellen Farben gezeichnet.
Wenn der Startpunkt der Trendlinie neu ist, wird die blaue Linie angezeigt (call shortline),

Elite Market Precision Indicator: Überlisten Sie institutionelle Manipulationen mit Fibonacci- und Pivot-Synergie Die institutionelle Falle: Warum die meisten Trader scheitern Die Finanzmärkte sind ein Schlachtfeld, auf dem institutionelle Händler Kursbewegungen manipulieren, um falsche Ausbrüche, Liquiditätsjagden und konstruierte Umkehrungen zu erzeugen. Die meisten Privatanleger fallen diesen trügerischen Bewegungen zum Opfer, was zu emotionalem Handel, gefälschten Signalen und Kapitalverlust

Gold Rush Scalper Der Gold Rush Scalper ist ein einfacher, aber leistungsstarker Handelsindikator für das Scalping von Gold (XAU/USD) auf dem 5-Minuten-Chart. Er bietet klare Kauf- und Verkaufspfeile, die Händlern helfen, potenzielle Handelsmöglichkeiten leicht zu erkennen.
Hauptmerkmale:
Nur Kauf- und Verkaufspfeile: Keine zusätzlichen Indikatoren, nur präzise Einstiegssignale. 5-Minuten-Zeitrahmen : Speziell für den rasanten Goldhandel entwickelt.
Nur Gold (XAU/USD ): Nicht für andere Vermö

Trend Magie Indikator verwendet cci und atr zu kaufen und zu verkaufen, in den Markt zu schaffen. Dies ist eine Linie, die ihre Farbe ändert, wenn eine der Bedingungen auftreten, dh kaufen und verkaufen. Ich finde den Indikator, die Sie ein bisschen einen besseren Eintrag, wenn Sie die Parameter zu CCI=20, ATR=100, ATR MULTIPLIER= 2 ändern.
Richten Sie den Einstieg knapp oberhalb des Indikators nach einem Retracement ein. Setzen Sie Ihren Stop-Loss 20 Cent bis einen Dollar (je nach Aktiengröße)
FREE

# Power Assisted Trend Following Indicator
## Überblick
Der PowerIndicator ist eine Implementierung der von Dr. Andreas A. Aigner und Walter Schrabmair entwickelten "Power Assisted Trend Following"-Methodik. Dieser Indikator baut auf den Trendfolgekonzepten von J. Welles Wilder auf und verbessert diese, indem er Prinzipien der Signalanalyse auf die Finanzmärkte anwendet.
Die Kernerkenntnis dieses Indikators ist, dass eine erfolgreiche Trendverfolgung voraussetzt, dass die Kursbewegungen eine
FREE

Kaufsignal-Indikator Dieser Indikator erzeugt ein Bu y-Signal , wenn eine potenzielle Aufwärtsbewegung erkannt wird. A grüner Pfeil erscheint unter dem Preisdiagramm und zeigt einen möglichen Einstiegspunkt für eine Long-Position an. Das Signal hilft Händlern, Momente der Stärke auf dem Markt zu erkennen.
TIPP: - VERWENDEN SIE 1-STUNDEN- ODER GRÖSSERE ZEITRAHMEN FÜR BESSERE ERGEBNISSE. ZIEHEN SIE DEN STOP-LOSS NACH, INDEM SIE DIE NÄCHSTGELEGENEN HÖCHST- UND TIEFSTSTÄNDE DER SCHWANKUNGEN VERWEND

Verkaufssignal-Indikator Dieser Indikator erzeugt ein Verkaufssignal , wenn eine potenzielle Abwärtsbewegung erkannt wird. Ein roter Pfeil erscheint über dem Preisdiagramm und weist auf einen möglichen Einstiegspunkt für eine Short-Position hin. Das Signal hilft Händlern, Momente der Stärke auf dem Markt zu erkennen.
TIPP: VERWENDEN SIE 1-STUNDEN- ODER GRÖSSERE ZEITRAHMEN FÜR BESSERE ERGEBNISSE. ZIEHEN SIE DEN STOP-LOSS NACH, INDEM SIE DIE NÄCHSTGELEGENEN HÖCHST- UND TIEFSTSTÄNDE DER SCHWANKUNG

Parabolic SAR + Deviation [BigBeluga] ist ein erweiterter Parabolic SAR-Indikator, der entwickelt wurde, um Trends zu erkennen und gleichzeitig Abweichungsniveaus und Trendwechselmarkierungen für zusätzliche Tiefe bei der Analyse von Kursbewegungen einzubeziehen . Schlüsselmerkmale: > Parabolic SAR mit optimierten Einstellungen : Diese Version basiert auf dem klassischen Parabolic SAR und verwendet vordefinierte Standardeinstellungen, um seine Fähigkeit, Trends zu erkennen und zu bestätigen, z

TickATR Indikator für MT5 Beschreibung Der TickATR-Indikator ist ein leistungsstarkes Volatilitätsmessinstrument für MetaTrader 5, das die Average True Range (ATR) in Form von tatsächlichen Preis-Ticks anzeigt. Dieser innovative Ansatz bietet Händlern eine präzisere und instrumentenunabhängige Möglichkeit, die Marktvolatilität im Vergleich zu traditionellen ATR-Indikatoren zu messen. Da die Volatilität in Ticks und nicht in Preiseinheiten gemessen wird, bietet TickATR konsistente Messwerte für v
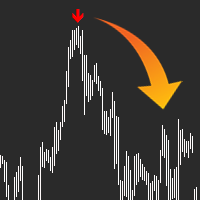
KURZER ÜBERBLICK : Nutzen Sie KI zur Vorhersage der Märkte mit AI Arrow, dem ultimativen Handelswerkzeug. Lassen Sie es die Wahrscheinlichkeiten verwalten und senden Sie ein einfaches Signal in Form eines Pfeils, bereit zum Handeln, keine komplexen Konfigurationen. Der Indikator analysiert den Markt und teilt Ihnen mit, wann eine potenzielle Bewegung stattfinden wird. Manchmal dauert es einige zusätzliche Balken, bis die Bewegung stattfindet, da er nicht jedes Mal den genauen Höchst-/Tiefststan

Sorgen um Ihren nächsten Trade? Müde davon, nicht zu wissen, ob Ihre Strategie wirklich funktioniert? Mit CRT Liquidity Pro handeln Sie mit echten Statistiken, nicht mit Emotionen. Kennen Sie Ihre Wahrscheinlichkeiten, verfolgen Sie Ihre Leistung und handeln Sie mit Vertrauen – basierend auf der Kraft von 3, intelligenter Liquiditätserkennung und CRT-Bestätigungen. Möchten Sie die Realität der CRT Liquidity-Strategie sehen? Nach Ihrem Kauf kontaktieren Sie uns , und wir stellen Ihnen eines unse

Simple QM Pattern ist ein leistungsstarker und intuitiver Handelsindikator, der die Identifizierung des Quasimodo (QM) Handelsmusters vereinfacht. Das QM-Muster ist unter Händlern weithin dafür bekannt, dass es potenzielle Umschwünge effektiv signalisiert , indem es wichtige Marktstrukturen und Preisaktionsformationen hervorhebt. Dieser Indikator hilft Händlern, das QM-Muster direkt auf ihren Charts zu visualisieren, so dass es selbst für diejenigen, die noch nicht mit dem Musterhandel vertraut
FREE
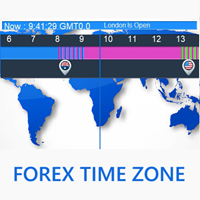
Kurze Einführung in Forex Time Zone Willkommen bei einem neuen kostenlosen professionellen Tool – Forex Time Zone ! Professionelle Trader wissen, wie wichtig die Zeit im Forex-Markt ist. Jede Sekunde öffnen einige Märkte weltweit, während andere schließen, was die Marktvolatilität beeinflusst und die Bewegungen einzelner Währungen beeinflusst. Dieses Tool hilft Tradern, leicht zu erkennen, welcher Markt gerade geöffnet ist und welche Zeitzone aktuell ist. Wie funktioniert es? Wählen Sie einfach
FREE
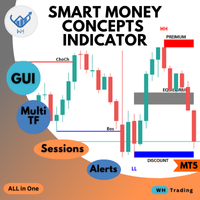
Willkommen zum ultimativen Smart Money Concepts Indikator, dieser Indikator ist ein All-in-One-Paket, das einzige, was Sie brauchen, um
alle Smart Money Concepts an einem Ort mit interaktivem fortgeschrittenem Gui-Panel mit allen Funktionen und Anpassungen, die Sie benötigen, zu befähigen. MT4 Version : WH SMC Indikator MT4 *Dieser Preis gilt für eine begrenzte Anzahl von Exemplaren .
Eigenschaften: Hauptabschnitt: Benutzerfreundliches Panel (GUI): Der Indikator wurde für Händler aller Erfahru
Haven Trend Tracker PRO – Ihr Navigator in der Welt der Trends Wir stellen vor: Haven Trend Tracker PRO – ein leistungsstarker Multi-Timeframe-Indikator für Trader, die im Einklang mit dem Markt handeln möchten. Seine Hauptaufgabe besteht darin, Ihnen Zweifel zu nehmen, indem er die Trendrichtung gleichzeitig auf Ihrem Arbeits- (LTF) und höheren (HTF) Zeitrahmen anzeigt. Meine anderen Produkte -> HIER . Der Handel mit dem Trend ist die zuverlässigste Strategie. Der Indikator hilft Ihnen, d

VeMAs ist ein innovatives Handelsinstrument, das Ihre Handelsstrategie durch die Analyse der Volumendynamik und der Marktstruktur verbessert. Ob Sie Anfänger oder erfahrener Trader sind, VeMAs verschafft Ihnen einen Vorteil. Der VeMAs -Indikator ist für nur $50 erhältlich. Der ursprüngliche Preis des Indikators beträgt $299
ZEITLICH BEGRENZTES ANGEBOT. Kontaktieren Sie mich nach dem Kauf, um einen personalisierten Bonus zu erhalten! Sie können absolut kostenlos ein cooles Dienstprogramm (VeMAs U

Einführung in den manuellen Backtesting-Indikator auf MQL5 Die MetaTrader-Plattform bietet ein hervorragendes Backtesting-Tool zur Bewertung von Expert Advisors (EAs). Wenn es jedoch um das manuelle Backtesting einer Strategie geht, um ihre Effektivität zu bewerten, hat dieses Tool einige Einschränkungen: Sie können im Backtesting-Modus keine Zonen oder Trendlinien manuell zeichnen. Sie können die Zeitrahmen nicht wechseln, um die zeitliche Ausrichtung zu überprüfen. Wenn meine Strategie zum Bei

Der SMC Venom Model BPR Indikator ist ein professionelles Tool für Trader, die mit dem Smart Money (SMC)-Konzept arbeiten. Er identifiziert automatisch zwei wichtige Muster im Kurschart:
FVG (Fair Value Gap) ist eine Kombination aus drei Kerzen, wobei zwischen der ersten und dritten Kerze eine Lücke besteht. Diese bildet eine Zone zwischen den Niveaus, in der es keine Volumenunterstützung gibt, was häufig zu einer Kurskorrektur führt. BPR (Balanced Price Range) ist eine Kombination aus zwe

Dies ist Ihre Chance, mit dem Raten aufzuhören und Ihre Strategie zu verstehen. 281 Trades verfolgt | 64% Gewinnrate | 70% Risiko-zu-Rendite-Verhältnis in historischen Daten Dies sind nicht nur Zahlen – es sind echte Statistiken, die Ihnen zeigen, wie diese Strategie funktioniert. Wenn Sie nach einer Möglichkeit suchen, intelligenter zu handeln, ist dies das Werkzeug, das Sie dorthin bringt. Haben Sie gerne die Realität der Engulfing-Strategie gesehen? Nach Ihrem Kauf kontaktieren Sie uns , und

TimeView Pro – Anpassbarer Indikator für lokale Zeit in MetaTrader 5 Beschreibung
TimeView Pro ist ein vollständig anpassbarer Zeitindikator, der sich automatisch an die PC-Zeit oder die Zeitzone des Nutzers anpasst. Im Gegensatz zu ähnlichen Indikatoren bietet TimeView Pro erweiterte Anpassungsoptionen, ohne das Chartbild zu überladen. Hauptfunktionen Kerzen-Snap (Standard: Aktiviert) – Zeitstempel wird automatisch an die nächste Kerze angepasst. Schnelles Ein-/Ausblenden – Verwenden Sie Click
Dieser Indikator ist primär für den manuellen Handel konzipiert. Er analysiert aktuelle Kursbewegungen und verarbeitet diese mithilfe eines eigenen Algorithmus. Basierend auf dieser Analyse berechnet der Indikator die wichtigsten Kursniveaus. Diese Niveaus unterteilen die Kurswerte in drei Zonen: Kauf, Verkauf und Neutral. Neue Positionen sollten nur eröffnet werden, wenn sich der Kurs in der entsprechenden Zone befindet. Liegt der Kurs in der neutralen Zone, sollten Sie erwägen, Positionen zu

VANGARD Trade Info MT5 – Erweiterte Handelsinformationen & Volle Kontrolle! VANGARD Trade Info MT5 ist ein unverzichtbares Tool für Trader, die ihre Positionen in Echtzeit überwachen möchten – mit anpassbaren Privatsphäre-Einstellungen, einer flexiblen Benutzeroberfläche und intelligenten Margin-Warnungen . Dieses Tool liefert detaillierte Informationen zu Trades, Margin-Level, Swaps und Kosten , alles in einer optimierten Benutzeroberfläche für schnellere und effizientere Entscheidungen.
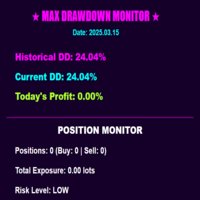
Monitor MaxDD Pro
MaxDD Monitor Pro ist ein umfassendes Drawdown-Überwachungstool für professionelle Trader. Es verfolgt sowohl kontostand- als auch einzahlungsbasierte Drawdown-Metriken in Echtzeit und hilft Ihnen, Risiken effektiv zu managen. Zu den Funktionen gehören die Verfolgung des historischen maximalen Drawdowns, symbolspezifische Drawdown-Analyse, Positionsüberwachung und Expositionsberechnung. Hauptmerkmale: Echtzeit-Drawdown-Überwachung mit farbcodierten Warnungen Separate Verfolgun
FREE

Reversal Algo – Technischer Indikator zur Marktumkehranalyse Reversal Algo ist ein fortschrittlicher technischer Indikator, der speziell entwickelt wurde, um potenzielle Wendepunkte in Markttrends zu identifizieren. Durch die detaillierte Analyse historischer Preisdaten erkennt er bedeutende Hochs und Tiefs, die auf eine bevorstehende Trendänderung hinweisen können. Dieser Indikator bietet klare visuelle Signale auf dem Chart, sodass Händler Schlüsselbereiche für mögliche Umkehrungen präzise bes

TickFlow ist ein Werkzeug zur Analyse von Tick-Daten und zur visuellen Hervorhebung signifikanter Zonen im Chart. Die Anwendung aggregiert aktuelle und historische Ticks, zeigt das Verhältnis von Käufern zu Verkäufern und hilft, Unterstützungs-/Widerstandsbereiche und Cluster-Zonen zu erkennen. Dies ist die Version für MetaTrader 4. Funktionsweise (kurz) TickFlow sammelt Tick-Daten und aggregiert diese nach Preisschritten und Kerzen.
Auf Basis der gesammelten Daten erstellt das Tool Visualisi
TrendMaster Dashboard: Ihr umfassendes Trendanalyse-Tool Das TrendMaster Dashboard ist ein fortschrittlicher Expert Advisor (EA) für MetaTrader 5 (MT5), der Ihre Handelserfahrung vereinfachen und verbessern soll. Dieses leistungsstarke Tool konsolidiert mehrere technische Indikatoren und Preisaktionsanalysen in einem einzigen, benutzerfreundlichen Dashboard und bietet klare Kauf-, Verkaufs- und Umkehrsignale durch ein gewichtetes Scoring-System. Ganz gleich, ob Sie neu im Handel sind oder ein e
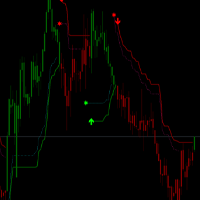
OV-VCS_ATR Handelsregeln Der OV-VCS_ATR-Indikator ist ein beliebtes trendfolgendes technisches Analyseinstrument, das Händlern hilft, den aktuellen Markttrend und potenzielle Einstiegs- und Ausstiegspunkte zu erkennen. Nachfolgend finden Sie die allgemeinen Handelsregeln für die Verwendung des OV-VCS_ATR Indikator: 1. Überblick über den Indikator Der OV-VCS_ATR-Indikator besteht aus einer Linie, die auf dem Kurschart eingezeichnet ist und deren Farbe die Trendrichtung anzeigt: Grüne Linie: Zeigt
FREE

Kostenloser Indikator für Metatrader 5, der für jede der Marktsitzungen "London, New York und Tokio" ein rechteckiges Feld anzeigt. Die Zeitzone kann automatisch oder über einen Offset-Wert eingestellt werden. Konfigurationsparameter für jede der Sessions. Sichtbar / Nicht sichtbar Startzeit Endzeit Voller oder transparenter Rahmen. Stil des Kastenrandes. Dicke des Kastenrandes. Farbe.
FREE
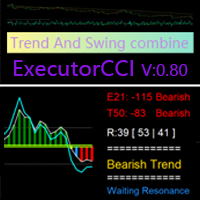
Basierend auf dem CCI-Trendfolgeprinzip, verbessert zur Erkennung von Trendumkehrungen
Dieser Indikator wurde entwickelt, um Trends zu bestätigen, nachdem sie mit dem Indikator ( Executor Trend Indicator ) identifiziert wurden, was ihn zu einem Werkzeug sowohl für die Trendbestätigung als auch für die Erkennung von Umkehrungen macht. Merkmale Grünes und rotes Histogramm: Zeigt die Entwicklung von Aufwärtstrends (grün) oder Abwärtstrends (rot) im aktuellen Zeitrahmen an. Blaue Linie und grünes H
FREE
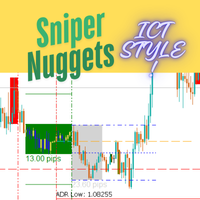
!!!!!!!! Sniper Nuggets !!!!!!!!
Sniper Nuggets ist ein All-in-One-Indikator für viele Dinge im ICT-Stil. Er umfasst die folgenden Funktionalitäten: Benutzerdefinierte Zeiträume : Erlaubt es Ihnen, die Start- und Endzeiten der täglichen Perioden nach Ihrem Geschmack festzulegen. ADR-Marker: zeigt die durchschnittliche tägliche Spanne an. Worktime: Zeichnet die verschiedenen Boxen auf dem Diagramm für die Asien-Range (einschließlich der Höchst-, Tiefst- und Mittelwerte, Standardabweichungsprogn
FREE
Hallo, Trader! Willkommen zur Einführung des Multi Timeframe Analyzer v1.0 (MT5 )!
Dies ist die Meta Trader 5 Version des "Market Meeter". Klicken Sie hier , um die MT4-Version zu erhalten <<---
Was ist dieser Indikator? Einfach ausgedrückt, analysiert dieser Indikator den Markt über acht verschiedene Zeitrahmen , von niedrig bis hoch, und sagt die nächste Preisrichtung zusammen mit einer geschätzten Fortsetzungszeit voraus. Dazu werden Volumen, Volatilität und Kursmuster in die Berechnungen e
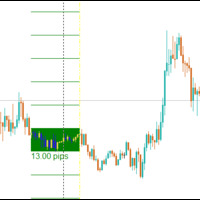
Die Central Bank Dealers Range (CBDR) ist ein wichtiges IKT-Konzept, mit dem auf der Grundlage der Marktbedingungen während eines bestimmten Zeitfensters potenzielle Höchst- und Tiefststände für den Tag prognostiziert werden. Die CBDR wird zur Vorhersage von Kursbewegungen sowohl bei steigenden als auch bei fallenden Marktbedingungen verwendet. Durch die Identifizierung dieses Bereichs können Händler die Kursniveaus, die sich im Laufe des Tages bilden könnten, besser vorhersehen.
CBDR und Stan
FREE
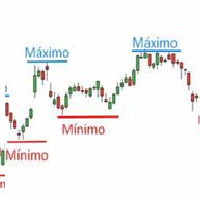
Allgemeine Beschreibung des Indikators Dieser Indikator ist ein visuelles Hilfsmittel, das die Höchst- , Tiefst- und Mittelwerte jedes Tages auf dem Chart anzeigt. Diese Niveaus werden auf der Grundlage des täglichen Zeitrahmens (D1) berechnet, können aber auch auf jedem anderen Zeitrahmen (M1, M5, H1, usw.) angezeigt werden. Zusätzlich erlaubt der Indikator: Horizontale Verschiebung der Höchst- und Tiefststände auf der Grundlage einer vom Benutzer festgelegten Anzahl von Tagen ( Parameter Shift
FREE

Der Indikator Time_Price_SQ9_Degree basiert auf dem 9er Gann-Quadrat. Mit diesem Indikator können Sie starke Zeit- und Preiszonen identifizieren. Der Indikator zeigt die Niveaus als Gradwert an. Die Gradzahlen können in den Einstellungen festgelegt werden. Nach dem Start erscheint die Schaltfläche MENÜ. Wenn sie hervorgehoben ist, kann sie an eine beliebige Stelle des Diagramms verschoben werden, und nach einem Doppelklick darauf hört sie auf hervorgehoben zu sein und es erscheinen Menüschaltfl
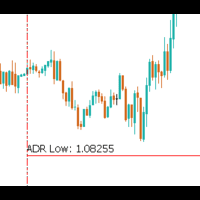
Die Average Daily Range (ADR) ist ein leistungsstarkes Instrument für Händler, insbesondere für diejenigen, die sich auf Intraday- und Scalping-Strategien konzentrieren. Er bietet wertvolle Einblicke in die erwartete Kursbewegung für den Tag und in das Verhalten der Kurse im Vergleich zu historischen Trends. Der ADR-Indikator zeigt die folgenden Schlüsselinformationen an: Heutiges ADR : Die typische Spanne der Kursbewegung für den aktuellen Handelstag, basierend auf historischen Daten. 3x ADR h
FREE
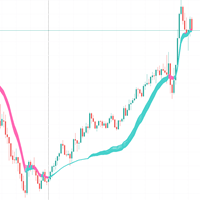
Den RSI Adaptive EMA-Indikator verstehen Dieser Code implementiert einen eigenen Handelsindikator namens "RSI Adaptive EMA" für MetaTrader-Plattformen. Es ist ein faszinierender Ansatz, der den RSI (Relative Strength Index) mit einem Exponential Moving Average (EMA) so kombiniert, dass sich der EMA an die Marktbedingungen anpasst.
Kernkonzept Herkömmliche EMAs verwenden einen festen Glättungsfaktor (Alpha), aber dieser Indikator erzeugt einen dynamischen Glättungsfaktor, der sich auf der Grundl
FREE

PipHistogram ist ein unverzichtbares Werkzeug für Händler, die einen Einblick in die Preisverteilung und -konzentration gewinnen möchten. Das anpassbare, visuell ansprechende Histogramm ermöglicht es Ihnen, wichtige Niveaus zu erkennen und fundiertere Handelsentscheidungen zu treffen. Erweitern Sie Ihre Marktanalyse und verbessern Sie Ihre Handelsstrategie mit PipHistogram - Ihre Abkürzung zum Verständnis der Preisdynamik in MetaTrader 5. Überblick : PipHistogram ist ein leistungsstarker Indika
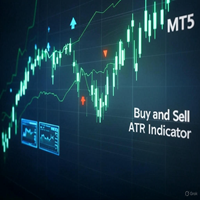
ATR-Indikator kaufen und verkaufen Der ATR-Indikator für Kauf und Verkauf ist ein leistungsstarkes Trendfolge-Tool für MT5, das die ATR-basierte Trenderkennung mit der RSI-Bestätigung kombiniert. Er zeichnet eine dynamische Trendlinie und generiert klare Kauf- (blaue Pfeile) und Verkaufssignale (rote Pfeile), wenn der Kursverlauf einen Trend über eine benutzerdefinierte Anzahl von Kerzen bestätigt. Ein einzigartiger Flat-Market-Filter, der auf der durchschnittlichen ATR basiert, verhindert Sign
FREE

Volume Difference - Dieser Indikator wurde entwickelt, um das Lesen von Preis- und Volumencharts zu erleichtern. Er ist so konzipiert, dass die Differenz zwischen dem vergangenen und dem aktuellen Volumen nicht mehr berechnet werden muss. Dieser Indikator wurde entwickelt, um diesen Prozess zu vereinfachen. Überraschenderweise konnte ich nirgends einen so einfachen Indikator finden, also stelle ich ihn Ihnen vor.
Dieser Indikator ist unverzichtbar für den Einsatz in komplexen Handelsmodellen,
FREE

MATRIX-Markt-Scanner
Umfassende Analysen ohne Komplexität Unser innovatives, zellenbasiertes Dashboard bietet Ihnen einen Panoramablick auf den Markt und ermöglicht Ihnen die nahtlose Überwachung mehrerer Instrumente und Zeitrahmen. Das hohe Maß an Anpassungsmöglichkeiten sorgt für eine intuitive, dynamische Anzeige, die sich an Ihren Handelsstil anpasst und es Ihnen ermöglicht, das Gesamtbild zu überblicken und intelligentere, schnellere Entscheidungen zu treffen. Neues Update Das jüngste Upda

Die beste und einzige Weltzeitanzeige für MT5
Features :
- JAPAN, LONDON & NEW YORK Zeitanzeige
- Sie können mit verschiedenen Schriftarten, Farben und Textgrößen anpassen
- Sie können die Position der Box und die Farbe der Box zu Ihrer Zufriedenheit anpassen
- Nur für Metatrader 5
- Passen Sie GMT entsprechend Ihrer Zeitzone an
- Einfach zu bedienen. Einfach an Ihren MT5 anhängen
- Kein versteckter Code oder keine Fehler
FREE
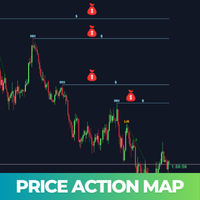
Price Action Map ist ein fortschrittlicher Handelsindikator, der sorgfältig entwickelt wurde, um klare visuelle Einblicke in die Marktstruktur zu geben, indem er höhere Hochs (HH) , höhere Tiefs (HL) , niedrigere Hochs (LH) und niedrigere Tiefs (LL) genau kennzeichnet. Für Händler, denen es schwer fällt, höhere Hochs und niedrigere Tiefs genau zu identifizieren oder verschiedene Marktphasen zu verstehen, ist dieses Tool außerordentlich wertvoll. Die Price Action Map vereinfacht den Analyseprozes
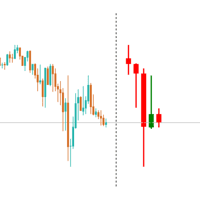
Der Higher Timeframe Multiple Candle Tracker wurde entwickelt, um eine Momentaufnahme des Aussehens der ausgewählten Kerzen des höheren Zeitrahmens zu erstellen. Er zeigt die N jüngsten Kerzen nach dem aktuellen Kurs an. Dieses Tool ist besonders nützlich für Händler, die verstehen möchten, wie sich die aktuelle Kerze mit höherem Zeitrahmen entwickeln könnte. Sie können den höheren oder niedrigeren Zeitrahmen aus den verfügbaren Optionen auswählen. Standardmäßig werden bärische Kerzen in rot und

Wichtigste Erkenntnisse Dieser Timer verzögert nicht wie andere Timer-Indikatoren Zeigt das Zeitende von Candlesticks und Spread an Ausblenden oder Anzeigen des Spreads je nach Benutzerbedarf Funktioniert auf allen Zeitrahmen Textgröße anpassen Textfarbe anpassen Textschriftart anpassen
If you love this indicator, please leave a positive rating and comment, it will be a source of motivation to help me create more products <3
FREE

TS Time Remaining - Candlestick-Countdown-Indikator in MetaTrader 5 TS Time Remaining ist ein kostenloser Indikator für die MetaTrader 5 Plattform, der es Händlern ermöglicht, die verbleibende Zeit der aktuellen Kerze in Echtzeit zu sehen. Dieses Tool ist besonders nützlich für Händler, die mit Strategien arbeiten, die auf Preisaktionen und Candlestick-Mustern basieren, da es ihnen erlaubt, den Candlestick-Schluss vorherzusehen und genauere Entscheidungen zu treffen. Hauptmerkmale. Klare und gen
FREE

Volumen-über-Durchschnitt-Indikator - MQL5 Einführung Der Volume Above Average Indicator ist ein benutzerdefinierter Indikator für die MetaTrader 5 (MQL5) Plattform, der Händlern hilft, das aktuelle Handelsvolumen im Vergleich zum historischen Durchschnitt zu identifizieren. Der Indikator verwendet drei verschiedene Empfindlichkeitsstufen, um das Volumen in schwach, mittel und stark zu klassifizieren und bietet eine klare Visualisierung des Marktmomentums. Wichtigste Merkmale Zeigt das Handelsvo
FREE
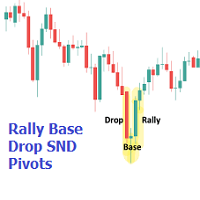
Der Rally Base Drop SND Pivots-Indikator verwendet "Rally"-, "Base"- und "Drop"-Kerzen, um Pivot-Punkte zu bestimmen, an denen Angebot und Nachfrage (SND) eingezeichnet werden. (Abbildung 1) ANWENDUNG Abbildung 2 Rally-, Base- und Drop-Kerzen (RBD-Kerzen) bilden eine Formel, um die Marktstruktur anhand einer festen Methodik zu erkennen. Wir können dieses Konzept nutzen, um Pivot-Bereiche aufzuzeigen, in denen Rallyes und Drops direkt aufeinandertreffen.
Die RBD-SND-Pivots ähneln den traditi

Supertrend ist ein Trendfolgeindikator, der auf der Average True Range (ATR) basiert. Die Berechnung seiner einzelnen Linie kombiniert Trenderkennung und Volatilität. Er kann verwendet werden, um Änderungen der Trendrichtung zu erkennen und Stopps zu positionieren. Geschichte Der Supertrend-Indikator wurde von Olivier Seban entwickelt. Berechnungen Um die Bänder des Supertrend zu berechnen, verwenden Sie die folgenden Formeln: hl2 = (Hoch + Tief) / 2 basicUpperBand = hl2 + (Multiplikator × ATR)

PMax ist ein brandneuer Indikator, der von KivancOzbilgic Anfang 2020 entwickelt wurde. Er ist eine Kombination aus zwei Trailing-Stop-Loss-Indikatoren. Der eine ist der MOST (Moving Stop Loss) Indikator von Anıl Özekşi und der andere ist der bekannte ATR-basierte SuperTrend. Sowohl der MOST- als auch der SuperTrend-Indikator eignen sich sehr gut für Trendfolgesysteme, aber umgekehrt ist ihre Leistung in seitwärts gerichteten Marktbedingungen nicht so gut wie die der meisten anderen Indikatoren.

Zweifache Bestätigung des PMAX-Supertrend-Indikators: Der ultimative Handelsvorteil Der Dual Confirmation PMAX-Supertrend-Indikator stellt einen bedeutenden Fortschritt bei den technischen Analysewerkzeugen für ernsthafte Trader dar. Dieser Premium-Indikator kombiniert zwei leistungsstarke Trendfolgesysteme in einer einzigen, optimierten Lösung, die nur dann Signale generiert, wenn beide Systeme übereinstimmen, wodurch Fehlsignale drastisch reduziert und die Handelspräzision verbessert werden. H

"Erschließen Sie tiefere Markteinblicke mit unserem fortschrittlichen MQL5 Volumenindikator! Dieses Tool kombiniert Echtzeit-Volumendaten mit einem EMA25-Overlay, das Schlüsselbereiche hervorhebt, in denen das Volumen mindestens 1,5 Mal über dem EMA25 liegt - perfekt, um hochwirksame Trends zu erkennen. Passen Sie Farben und Deckkraft mühelos an Ihren Stil an. Außerdem können Sie Ihre Charts optimieren, indem Sie die Standard-Volumenanzeige des MT5 deaktivieren: Gehen Sie einfach zu den Chartei

Ein leistungsstarkes Trendfolge-Tool , das die ATR-basierte Volatilität nutzt, um Markttrends über mehrere Zeitrahmen hinweg zu erkennen. Mit dieser verbesserten Version können Sie den SuperTrend eines höheren Zeitrahmens direkt in Ihr aktuelles Chart einblenden und so Ihre Trades auf den vorherrschenden Trend abstimmen. Wie es funktioniert Der Indikator berechnet die dynamischen Unterstützungs- und Widerstandsniveaus anhand der Average True Range (ATR) : Oberes Band = Ausgangskurs + (Multiplika

JAJ Binary Pro ist eine präzisionsgesteuerte Strategie für binäre Optionen, die von Jamaine Walkin , einem Vollzeit-Händler und Investor, entwickelt wurde. Sie wurde für die Anpassung an Forex- und OTC-Märkte entwickelt und konzentriert sich auf hochwahrscheinliche Handels-Setups und diszipliniertes Risikomanagement. Optimiert für Pocket Option & MT5 , spiegelt sie Jamaines strukturierten Ansatz für den Optionshandel wider und gewährleistet Konsistenz und Vertrauen in die Ausführung.
Verwend
Produktname :SII - Synthetic Indices Indicator
Übersicht :
Der SII (Synthetic Indices Indicator) ist ein spezialisiertes Handelsinstrument, das anhand von Ungleichgewichten hochwahrscheinliche Niveaus in synthetischen Indizes identifiziert. Durch die Nutzung des Konzepts der Ungleichgewichte bietet der SII Händlern präzise Einblicke in potenzielle Marktumkehrungen und -fortsetzungen und verbessert so die Handelsgenauigkeit und Entscheidungsfindung.
Hauptmerkmale
1. Erkennung von Ungleichgewi

Candle Reversal wurde entwickelt, um wichtige Candlestick-Muster zu identifizieren und hervorzuheben, die potenzielle Trendumkehrungen oder -fortsetzungen auf dem Markt signalisieren. Es konzentriert sich auf zwei primäre Arten von Mustern: 3-Linien-Strike-Patterns ( Bullish und Bearish) Engulfing-Muster ( Hausse und Baisse) Der Indikator bietet visuelle Anhaltspunkte (Pfeile und Textbeschriftungen) auf dem Chart, um Händlern zu helfen, diese Muster schnell zu identifizieren, was es einfacher m

### Die Price Action Ultimate Suite - das ultimative Trading-Tool für professionelle Trader!
Sind Sie auf der Suche nach einem leistungsstarken Tool, um Ihre Price Action Handelsstrategie zu verbessern? Die **Price Action Ultimate Suite** ist ein umfassender und intelligenter Indikator für den MetaTrader 5 (MT5) - entwickelt, um Ihr zuverlässiger Partner bei der Eroberung der Finanzmärkte zu sein! Dieser Indikator ist vollgepackt mit fortschrittlichen Features und benutzerfreundlicher Funktion

Name des Indikators: DualClockWithSignalTime.mq5 Beschreibung: DualClockWithSignalTime ist ein benutzerdefinierter MetaTrader 5 (MT5) Indikator, der drei Echtzeit-Informationen direkt auf dem Chart anzeigt: Broker-Server-Zeit Lokale Computer-Zeit Letzte Signalzeit (BUY/SELL) Dieser Indikator ist hilfreich für Händler, die sowohl die Zeit des Brokers als auch ihre eigene Ortszeit überwachen müssen, um eine bessere Synchronisierung der Handelsaktionen zu gewährleisten. Darüber hinaus erkennt er au
FREE

Die meisten Trader sehen Engulfing-Kerzen. Wenige wissen, wie man sie profitabel handelt. Engulfing Pro Trader gibt Ihnen einfache Signale und echte Statistiken — Trades, Gewinne, Profite — um Umkehrungen mit Vertrauen zu handeln. Keine Hoffnungen, nur die echten Zahlen, die Sie brauchen. Bei Real Trades zeigen wir Ihnen, was wahr ist, nicht was träumerisch ist. Haben Sie die Realität der Engulfing-Strategie gesehen und mögen sie? Hinterlassen Sie uns eine 5-Sterne-Bewertung und schreiben Sie m
FREE

PUMPING STATION – Ihre persönliche „All-inclusive“-Strategie
Wir präsentieren Ihnen PUMPING STATION – einen revolutionären Forex-Indikator, der Ihr Trading in eine spannende und effektive Erfahrung verwandeln wird. Es handelt sich nicht nur um ein Hilfsmittel, sondern um ein vollwertiges Handelssystem mit leistungsstarken Algorithmen, die Ihnen helfen, stabiler zu traden. Beim Kauf dieses Produkts erhalten Sie KOSTENLOS: Exklusive Set-Dateien: Für automatische Einrichtung und maximale Leistung.

Der Pips Chaser Indikator wurde entwickelt, um Ihren manuellen Handel zu ergänzen. Dieser Indikator kann sowohl für kurzes Scalping als auch für langes Swing-Trading verwendet werden // MT4 Version
Merkmale Indikator wird nicht neu gezeichnet Dieser Indikator ändert seine Werte nicht, wenn neue Daten eintreffen Handelspaare Jedes Währungspaar Zeitrahmen H1 ist vorzuziehen, aber Sie können ihn an jeden Zeitrahmen anpassen Trading time
Rund um die Uhr Buffers Buy Buffer: 0 / Sell Buffer: 1
FREE
WICHTIGER HINWEIS – LIZENZ UND AKTIVIERUNG ERFORDERLICH
Aktivierungsanweisungen:
Nach Abschluss Ihres Kaufs kontaktieren Sie uns bitte umgehend, um Ihren Lizenzschlüssel, Ihr Passwort oder Ihre Aktivierungsdetails zu erhalten. Ohne diese funktioniert die Software nicht. Wir sind hier, um einen reibungslosen Aktivierungsprozess zu gewährleisten und Ihnen bei Fragen zu helfen.
Mehrsprachige Anpassung
Um Ihr Handelserlebnis zu verbessern, bieten wir eine vollständige Anpassung der Softwa
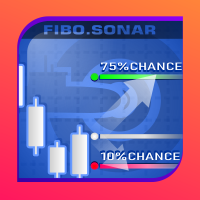
Fibonacci-Sonar
Das Fibonacci-Sonar verfügt über eine interne Bibliothek mit Preisaktionsmustern, die aus 28 Symbolen und 7 Zeitrahmen gesammelt wurden.
Jedes Muster ist in zwei Seiten unterteilt: die Vorher- und die Nachherseite. Das Fibonacci-Sonar verwendet die Vorherseite, um ähnliche Muster zu erkennen. Die jüngste Preisaktion (zu jedem Zeitpunkt) bis zum Eröffnungspreis des neuesten Balkens wird als Vorherseite zum Durchsuchen der Bibliothek verwendet. Die Nachherseite enthält eine Zusamme

WICHTIGER HINWEIS – LIZENZ & AKTIVIERUNG ERFORDERLICH Aktivierungsanweisungen: Nach Abschluss Ihres Kaufs kontaktieren Sie uns bitte umgehend, um Ihren Lizenzschlüssel, Ihr Passwort oder Ihre Aktivierungsdetails zu erhalten. Ohne diese wird die Software nicht funktionieren. Wir sind hier, um einen reibungslosen Aktivierungsprozess zu gewährleisten und Ihnen bei Fragen zu helfen. Mehrsprachige Anpassung
Um Ihr Trading-Erlebnis zu verbessern, bieten wir eine vollständige Anpassung der Soft
Der Indikator „UzFx-Total TP'SL & Timer-MT5” wurde entwickelt, um die Gesamtwerte für Take Profit (TP) und Stop Loss (SL) aller offenen und ausstehenden Trades in Echtzeit zu verfolgen. Zusätzlich enthält er einen Candlestick-Countdown-Timer, der die verbleibende Zeit bis zum Schließen der aktuellen Candlestick anzeigt.
Wichtigste Funktionen:
Berechnet automatisch den erwarteten Gesamtgewinn und -verlust aus allen aktiven Trades und ausstehenden Orders. Zeigt die verbleibende Zeit bis zum Sch
FREE

Der Startpreis beträgt $75. Er erhöht sich nach 30 Verkäufen auf $120.
Nach dem Kauf kontaktieren Sie mich bitte, um Ihre Handelstipps + weitere Informationen für einen großartigen Bonus zu erhalten !
Lux Trend ist eine professionelle Strategie, die auf der Verwendung von höheren Hochs und niedrigeren Hochs basiert, um Trendlinienausbrüche zu identifizieren und zu zeichnen! Lux Trend verwendet zwei gleitende Durchschnitte, um die allgemeine Trendrichtung zu bestätigen, bevor der Markt nach ho

MURKA Levels PRO.
MURKA Levels PRO - ist ein Indikator für MetaTrader 5, der High/Low, Open/Close, ATR Levels (manuell eingestellt) des Tages, der Woche, des Monats auf dem Chart anzeigt. Markiert runde Niveaus, kennzeichnet die Tage der Woche, Zahlen jede Woche (Sie können zwei Arten von runden Niveaus gleichzeitig einstellen). ATH (All-time high) и ATL (All-time low). Die Niveaus werden durch Preisschilder mit einem Preissymbol gekennzeichnet. Außerdem berechnet der Indikator automatisch die

In der Welt des Handels, wo jeder Tick der Beginn einer neuen Geschichte sein kann, ist es entscheidend, einen verlässlichen Verbündeten zu haben. TrendVarianceSpectrum ist nicht nur ein Trading-Roboter; es ist Ihr Leitfaden in den volatilen Märkten. Mit jahrelanger Erfahrung entwickelt und auf über 25 Jahre Daten trainiert, vereint es die Eleganz der Mathematik mit der Kraft moderner Technologie. Hauptvorteile von TrendVarianceSpectrum: Minimale Drawdowns: TrendVarianceSpectrum arbeitet mit d

Der UzFx-Local Currency Converter-MT5 ist ein leistungsstarker und benutzerfreundlicher Indikator für Trader, die ihre schwankenden und täglichen Gewinne und Verluste (P&L) sowohl in USD als auch in ihrer lokalen Währung verfolgen möchten. Dieses Tool bietet eine Echtzeitumrechnung unter Verwendung eines benutzerdefinierten Wechselkurses und hilft Tradern dabei, ihre Handelsperformance effektiver zu visualisieren.
Wichtigste Funktionen
Zeigt laufende Gewinne und Verluste in USD und Ihrer loka
FREE

Price Range MT5 ist ein System, das Preisspannen und -niveaus identifiziert und erkennt, wann eine Spanne endet und ein Trend beginnt. Es zeigt die Richtung des neuen Trends mit hoher Wahrscheinlichkeit an und sendet Ihnen Push-Benachrichtigungen, damit Sie rechtzeitig eine Entscheidung treffen können. Funktionen des Price Range-Indikators Der Indikator informiert Sie in Echtzeit über alle identifizierten Preisspannen, Niveaus und Trends. Er funktioniert für jedes Symbol und jeden Zeitrahmen. D
In der dynamischen Welt des Handels, in der Chaos und Muster miteinander verwoben sind, steht Prime Breakout Convergence als zuverlässiger Kompass an Ihrer Seite und führt Sie zu mehr Sicherheit bei jeder Handelsentscheidung und Stabilität auf dem Markt. Dies ist nicht nur ein manuelles System; es ist ein intelligenter analytischer Assistent, der tiefgreifende Markttrends entschlüsseln und komplexe Indikatorwerte in klare und umsetzbare Handelsentscheidungen umwandeln kann. Warum Prime Breakout
Erfahren Sie, wie man einen Handelsroboter im MetaTrader AppStore, dem Shop für Applikationen für die MetaTrader Handelsplattform, kaufen kann.
Das Zahlungssystem der MQL5.community ermöglicht Zahlungen mit PayPal, Kreditkarten und den gängigen Zahlungssystemen. Wir empfehlen Ihnen eindringlich, Handelsroboter vor dem Kauf zu testen, um eine bessere Vorstellung von dem Produkt zu bekommen.
Sie verpassen Handelsmöglichkeiten:
- Freie Handelsapplikationen
- Über 8.000 Signale zum Kopieren
- Wirtschaftsnachrichten für die Lage an den Finanzmärkte
Registrierung
Einloggen
Wenn Sie kein Benutzerkonto haben, registrieren Sie sich
Erlauben Sie die Verwendung von Cookies, um sich auf der Website MQL5.com anzumelden.
Bitte aktivieren Sie die notwendige Einstellung in Ihrem Browser, da Sie sich sonst nicht einloggen können.