Breakeven Line V2

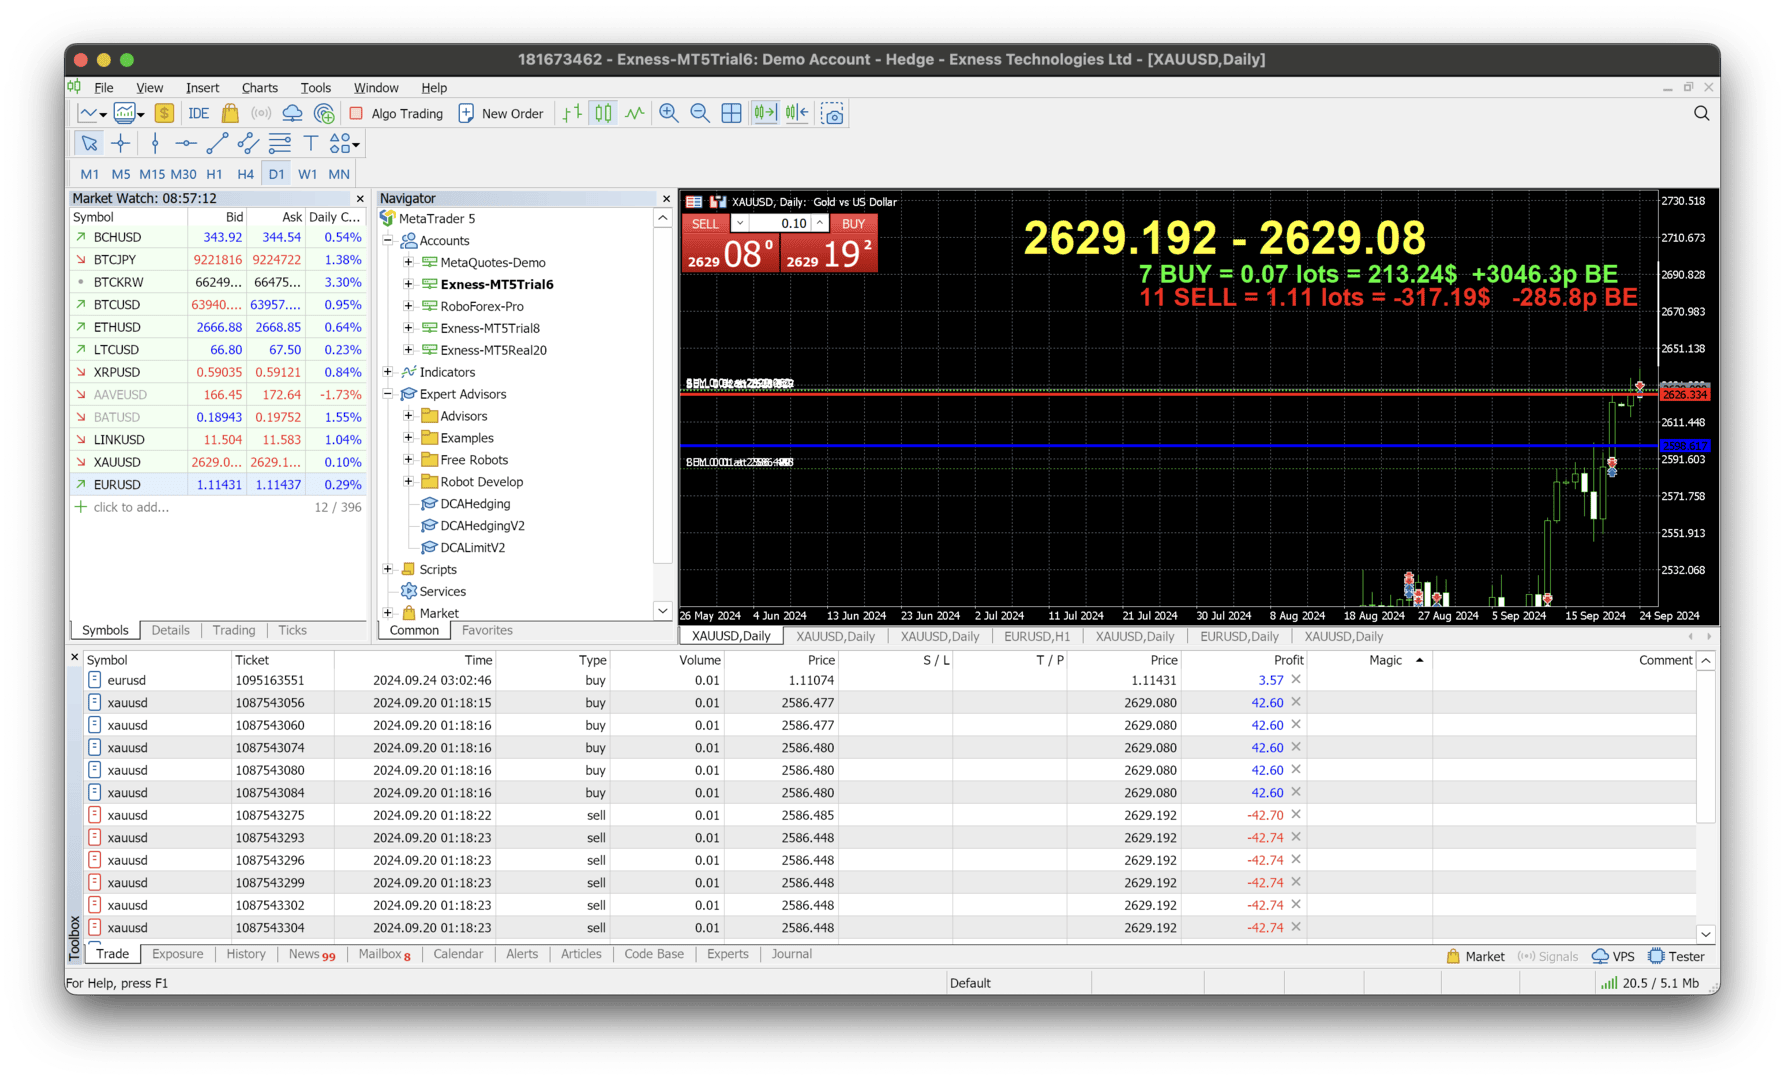
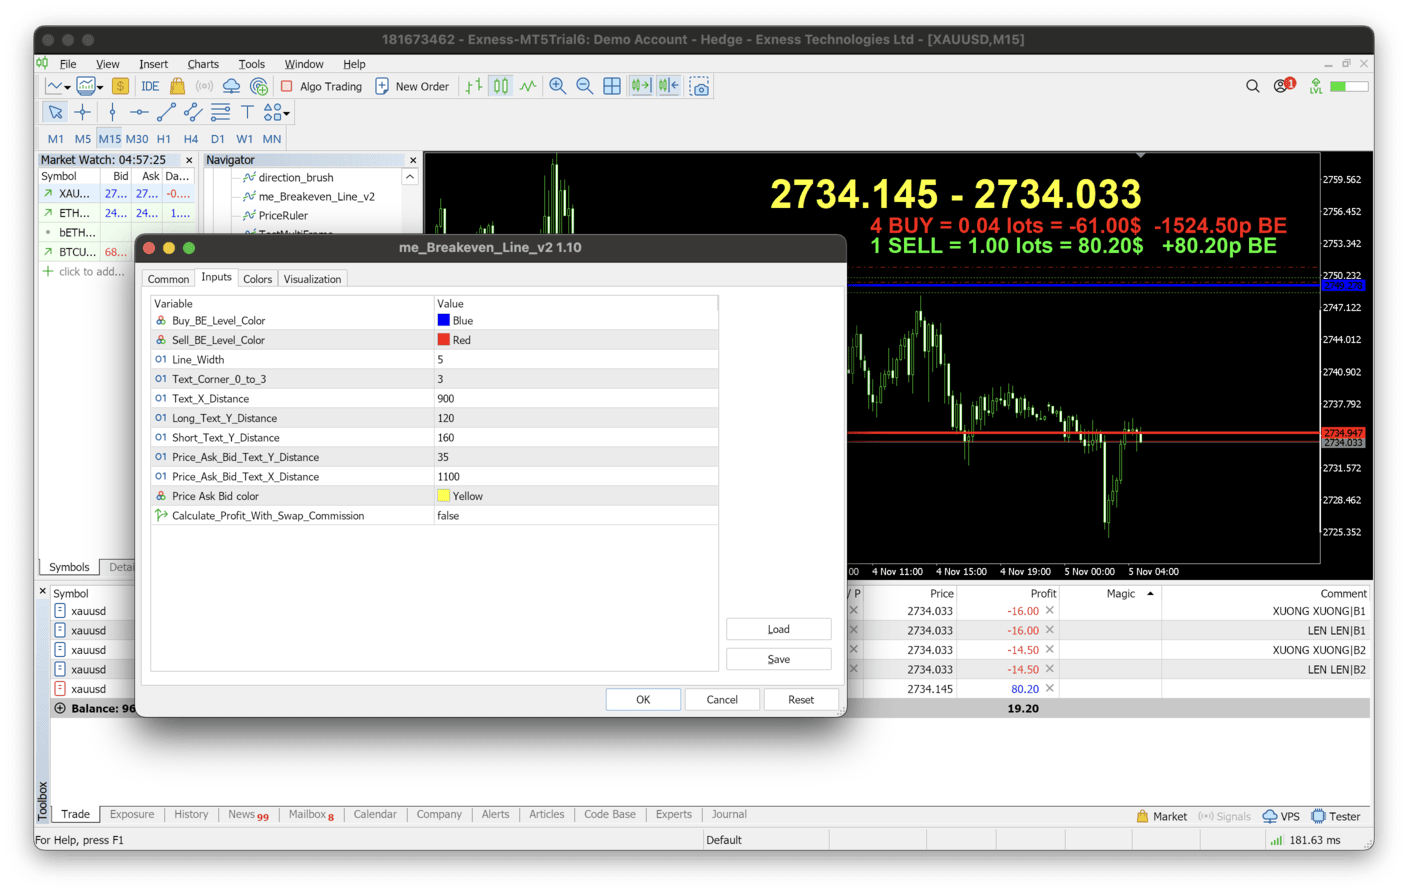
Breakeven Line v2 Indicator is a MetaTrader indicator that calculates breakeven level based on all open positions and displays it on your chart as a horizontal line. Additionally, it will calculate the total number trades, the total number of lots, and the distance to the breakeven line in points and profit/loss. The indicator is available for MetaTrader 5.

Why use Breakeven Line Indicator?

When you have multiple trades opened on a single symbol, it can be difficult to tell where your average entry price is and hence where your breakeven point lies. There are many reasons why you might end up with many positions on the same trading instruments: martingale, grid strategies, scaled entries, and so on. Even though we don't recommend any of such trading techniques, it is still a situation many traders often find themselves in. This is where the Breakeven Line Indicator comes handy.

This indicator will calculate the average price of all your positions, it will determine what your net position is, it will calculate how many points the price has to move to reach the breakeven for all your trades, and it will display all this information directly in the main chart window.


推荐产品
Trade Area
Jinsong Zhang
Most time the market is in a small oscillation amplitude. The Trade Area indicator helps users to recognize that time. There are 5 lines in this indicator: Area_high, Area_middle, Area_Low, SL_high and SL_low. Recommendations: When price is between Area_high and Area_Low, it's time to trade. Buy at Area_Low level and sell at Area_high level. The SL_high and SL_low lines are the levels for Stop Loss. Change the Deviations parameter to adjust SL_high and SL_low.
G FiboTrend
Lee Teik Hong
G-FiboTrend — Indicator Description G-FiboTrend is a trend-channel indicator for MetaTrader 5 that plots dynamic Fibonacci-based price zones over a rolling lookback period. How It Works The indicator scans a user-defined number of bars ( FiboPeriod ) to identify the highest high (HH) and lowest low (LL) within that window. From this range, it derives three key levels: Upper Band — Fibonacci level (default 61.8%) Mid Band — 50.0% midpoint Lower Band — Fibonacci level (default 38.2%) These levels
Mega Dashboard
Paul Anscombe
5 (4)
The Ultimate Dashboard New Year Sale - save $20   (normal price $79) Indicators are useful for traders, but when you put them into a dashboard that can scan 28 symbols at once they become even better, and when you can also combine different indicators and timeframes to give you synchronized alerts, then they become awesome. This easy to use dashboard provides you with 32 leading indicators, use them individually or together, to create powerful combination alerts. So when you want to know that RS
这是一个基于前一个交易日的最高价、最低价和收盘价来计算的枢轴点指标,具体公式如下: 计算前一日的 Pivot Point (枢轴点): Pivot = (High + Low + Close) / 3 计算 Resistance 1 (R1) 、 Support 1 (S1) ​ 等: R1 = (2 * Pivot) - Low S1 = (2 * Pivot) - High R2 = Pivot + (High - Low) S2 = Pivot - (High - Low) 与市面上其他的枢轴点指标相比,该指标主要有以下4个特点: 1、可以修改交易日的开始时间; 2、可以设定支撑压力线的颜色; 3、可以设定是否显示各个支撑压力线对应的价格; 4、可以设定天数用以显示枢轴点的历史记录; 开发这个指标的最初目的是为了解决设定交易日开始时间的问题,接下来会进一步说明。基于计算公式,我们需要获得上一个交易日的最高价、最低价和收盘价,在夏令时,北京时间6点是开市时间,大多数交易平台服务器的0点对应的是北京时间的6点,但是香港的服务器6点才是对应的是北京时间的6点。如果你有多个平台,且存在
ClearArrows MT5
Pavel Krysanov
For any trader, the result of market analysis is the correct determination of entry and exit points from the market. The ClearArrows indicator does not display any unnecessary information that may distract or mislead the trader, but only the most important thing. The indicator is very easy to use, when a down arrow appears, you need to open a SELL deal, when an up arrow appears you need to open a BUY deal. The ClearArrows indicator, despite its outward simplicity, has a large analytical algori
https://c.mql5.com/31/761/best-trend-indicator-logo-200x200-8493.png 该指标用一条红绿相见的实线来反映市场价格的万千变化。 绿线表明市场价格处于上 升期间 , 红线表明市场价格处于下跌期间。 实线颜色 的改变预示着市场已经发生变化行情极有可能会出现逆转!   建议您在日K线图上使用该指标。该指标不适合您做超短线交易! 众所周知,趋势线是技术分析家们用来绘制的某一证券 (股票) 或商品期货过去价格走势的线。目的是用来预测未来的价格变化。这条 趋势 线是通过联结某一特定时期内证券或商品期货上升或下跌的最高或最低价格点而形成的。它可以预测该证券或商品期货是处于上升的趋势还是处于下跌的趋势。但是,您一定要认识到每一个指标都有是有缺陷的,这个世界上没有任何一个指标可以精准的预测到市场未来的发展方向。因此,我建议您在使用这个指标的时候结合其他的技术分指标,以此获得更好 的 效果 。
成為突破者,隨著價格反轉,市場結構會改變利潤。 訂單突破者指示器可以識別趨勢或價格走勢何時接近枯竭並準備好逆轉。它會提醒您市場結構的變化,通常會在發生逆轉或重大回調時發生。 該指標使用專有計算來確定突破和價格動能。每當在可能的耗盡點附近形成新的高點時,指標就會繪製最後一個生成該高點的順序塊。然後,它將隨價格移動隨價格跟隨定單。然後,當價格轉向相反方向並突破該訂單塊時,它會提醒您,從而創建新的市場結構並開始趨勢或重大回調的可能逆轉。 訂單塊是在創建高/低之前的最後一個相反的彩色蠟燭,並且當價格跌破這些關鍵區域以下時,這表明趨勢可能會發生短期或長期反轉。 特徵 提醒您關鍵耗盡點的市場結構變化 價格接近耗盡水平時自動提取訂單塊 在一個方向繼續移動時,在價格後面跟踪定單,以提醒您最佳的反轉輸入 將顏色更改為純色塊,以顯示何時發生市場結構中斷。 適用於所有交易品種和時間範圍 內置集成的彈出窗口和電子郵件警報 策略和如何與定單破壞者指標進行交易 當斷路器塊發生時,您有兩個選擇。 看左邊!我們正在尋求供應/需求或支撐/阻力位嗎?市場結構轉變(逆轉)通常發生在價格重新測試舊水平或在該支撐或
- This is an indicator of directional movement that allows you to determine the trend at the time of its inception and set the levels of a protective stop. Trailing can be carried out both from below, when the stop level is below the current price and is pulled up behind the price if it increases, and above, when stop levels are above the current price. Unlike trailing with a constant distance, the stop level is set at the lower boundary of the quadratic regression channel (in the case of tra
Dorian
Ivan Simonika
The Dorian indicator is an intuitive tool for determining the current market trend. It is based on a simple visualization in the form of two-color lines, which makes it convenient for use by both beginners and experienced traders. This indicator not only helps determine the direction of the trend, but also serves as a valuable advisor for making decisions about entering the market or closing positions. Due to its simplicity and effectiveness, Dorian is recommended for traders of any experience
XFlow CHF
Maxim Kuznetsov
XFlow shows an expanding price channel that helps determine the trend and the moments of its reversal. It is also used when accompanying transactions to set take profit/stop loss and averages. It has practically no parameters and is very easy to use - just specify an important moment in the history for you and the indicator will calculate the price channel. This is a demo version limited to CHF currency pairs. Designed to familiarize you with the interactive use of XFlow DISPLAYED LINES ROTATE
FREE
This is the ADX Dashboard MT5. This dashboard will scan multiple timeframes in MT5 platform, from M1 chart to D1 chart. It will send the buy/sell signals by alert on the platform or sending notification to your phone or message you via a email. The buy signal is the cross over of DI+ and DI- The sell signal is the cross under of DI+ and DI-. The up trend color will be displayed when DI+ is greater than DI- The down trend color will be displayed when DI+ is less than DI- The value of ADX value wi
Structure Levels (Highs & Lows) Indicator for MetaTrader 5 Decode Market DNA — Trade with Institutional Precision Description: The Structure Levels (Highs & Lows) Indicator is your secret weapon to map the market’s hidden roadmap. Designed for traders who think in terms of price action and market structure, this tool automatically identifies critical swing highs and swing lows, transforming chaotic charts into a clear blueprint of support/resistance zones, breakout opportunities, and trend rev
The Linear Regression Channel is a powerful technical analysis tool that helps visually identify the prevailing trend and potential price zones. Essentially, the indicator performs two main functions: It draws a trendline through the center of price action over a specified period. This line is calculated using the linear regression method, which results in the best possible "line of best fit" for the price data. From this center line, the indicator plots two parallel lines above and below, creat
FREE
All Trend power
Israr Hussain Shah
TrendPower All-In-One Strict v1.00 Description TrendPower All-In-One Strict   is a comprehensive trend-following trading system designed for MetaTrader 5. It acts as a "confluence detector," meaning it filters market noise by requiring multiple technical indicators to agree before generating a signal. The indicator utilizes a "Strict" logic engine, meaning a signal is only generated when momentum, trend direction, and volatility filters all align perfectly. It displays data in a separate sub-win
Phoenix Orb Asia
Nigel Nii Darku Narnor Darko
This is a professional-grade institutional toolkit designed for breakout traders and trend followers worldwide. It specializes in the  Opening Range Breakout (ORB)  strategy—one of the most consistent ways to capture intraday volatility during the London and New York opens. This indicator does the heavy lifting for you by automatically mapping out the high and low of the first 15 minutes of any session. It combines this with  Smart Money Concepts (SMC) , identifying structural shifts like  BOS
FREE
The Perfect EA
Harshika Govind
The PerfectEA 是一款全自动交易系统 ,专为在波动市场环境中捕捉稳定利润并智能管理回撤而设计。它提供丰富的自定义选项,包括独特的风险管理功能,如可调节的止损和止盈、移动止损,以及在下单前验证可用保证金的机制。该 EA 支持买入和卖出订单,并能根据具体需求灵活选择交易策略。 本EA适用于所有主要和次要外汇货币对、XAUUSD(黄金)以及加密货币。 请使用针对加密货币、黄金和外汇货币对分配的不同设置文件进行回测。 您可以将本EA应用于任何时间周期的图表,包括1分钟、5分钟以及其他更高的时间周期图表。 要在您的交易环境中开始使用,请进行以下设置: 交易开始小时:0 交易停止小时:0 如有任何支持或疑问,欢迎随时私信联系我。我很乐意为您提供帮助,并为您遇到的任何挑战找到解决方案。 主要特点: 全自动交易,支持可自定义的风险管理设置 支持多种订单类型(买入、卖出及挂单) 集成高级指标(MA、RSI、MACD、随机指标等),提升决策质量 允许手动调整止损和止盈水平 通过屏幕通知提供实时订单信息和错误处理 可自定义的仪表盘,用于跟踪交易表现 兼容多种时间周期和交易品种 无论您是经验丰富的
CandelTimer MT5
Kambiz Shahriarynasab
300 downloads without review ? !!!! If continued. I will not share any product for free. :( Small and very simple timer next to the current price to show the end time of the current candle Very useful and important for scalpers and those who work on price action.   We assure you that we welcome any suggestions to improve this indicator and make the necessary changes to improve this indicator. You can contact us via Instagram, Telegram, WhatsApp, email or here. We are ready to answer you.
The Market Structures Pro indicator finds and displays 5 (five) patterns of the Smart Money Concepts (SMC) system on the chart, namely: Break Of Structures (BoS)       Change of character (CHoCH) Equal Highs & Lows Premium, Equilibrium and Discount zones with Fibo grid High-high, Low-low, High-low and Low-high extremes Patterns are displayed for two modes - Swing and Internal and are easily distinguished by color on the chart. Internal mode features higher contrast colors, finer lines, and smal
OrderFlux | MetaTrader 5 的足迹订单流 (Footprint Orderflow) 版本 2.0 – 活跃交易者的实时 Bid/Ask 可视化 OrderFlux 是 MT5 的足迹 (Footprint) 和订单流 (Orderflow) 指标。它不仅显示价格走到了哪里,还显示了运动过程中发生了什么:每个价格水平的 Bid/Ask 成交量、Delta、失衡 (Imbalance) 和成交量分布。 许多图表只向您显示 K 线的最终结果。OrderFlux 向您展示了到达那里的过程。当您想解读市场参与度而不仅仅是 K 线形态时,这正是您所需要的。 在实时图表中,OrderFlux 主要回答三个问题: 激进的买入或卖出压力目前正在哪里进入市场? 在哪些价格水平上成交量被吸收或拒绝? 当前的运动如何契合交易时段 (Session) 的背景? 您在界面中得到什么 主图表直接基于 Canvas 渲染足迹。此外还有底部徽章(时间、Delta、成交量)、可选的 Delta 摘要和 Session 背景。 流量 (Flow) 模块 DOM(市场深度)、Time & Sales、
News Clock
Victor Klenov
The professional browser of News and Trading Sessions is now available in MetaTrader 5. Now all the most important market information is collected on one dial! News located on the Time scale. Planning your working time has never been so easy and convenient ... The news scale can be switched a day, two, a week, a month forward or backward (see the details in the short video). All news updates in real time. Thanks to the built-in filters, you can configure the display of news by importance, cou
Channel Scanner MT5
Reza Aghajanpour
5 (1)
**   All Symbols   x   All Timeframes   scan just by pressing scanner button ** *** Contact me  to send you instruction and add you in "Channel Scanner group" for sharing or seeing experiences with other users. Introduction: The Channel pattern is described as the area located between two trend lines. This area is used for a measure of a trading range. In this case, the upper trend line connects price highs while the lower trend line connects price lows. Also when it comes to breakout points, it
Having trouble marking where the various forex sessions start and end? Or perhaps your strategy requires you trade only in a specific session, then this is for you. The session indicator shades the session you require in a certain color so that you can identify it easily. The sessions shown include: London session, New York session, Asian Session, Asian - London overlap and London - New York Overlap. Difference source give varying time ranges for the various session, mostly differing by not m
FREE
TradePilot Dashboard
Augusto Martins Lopes
TradePilot Dashboard 摘要 适用于 MT5 的图形面板,包含订单管理按钮(买入/卖出/平仓/止损/止盈)、保证金检查和日志控制。易于使用,可在模拟账户中测试。不承诺盈利。 详细说明 TradePilot Dashboard 是一个具有图形界面的专家顾问(Controls),用于在 MetaTrader 5 中进行手动和半自动订单管理。该产品提供一个可视化面板,包含按钮、可编辑字段和安全检查(自由保证金),帮助交易者直接在图表上快速操作。 主要功能 • 响应式图形面板,包含 40 多个按钮和多个输入字段(交易量、点数、追踪止损、反向止损等) • 使用 Trade.mqh(CTrade)库开设市价和挂单订单(Buy、Sell、BuyStop、SellStop) • 在发送订单前检查自由保证金(使用 ACCOUNT_MARGIN_FREE) • 可配置的日志控制(enableLogging、maxLogsPerMinute),防止消息泛滥 • 面板上显示价格(Ask/Bid)、余额和基本指标 • 集成 Controls 库(Dialog/Label/Button/Edi
My products:   https://www.mql5.com/ru/users/astra077/seller In the product line: Candlestick Pattern Detector   — a free basic version. Candlestick Patterns Standard   — a paid single-chart version with extended patterns and filters:  https://www.mql5.com/ru/market/product/174530 Japanese Candlestick Patterns Pro MT5   — a professional single-chart version with a summary table:  https://www.mql5.com/ru/market/product/173411 Multi-Currency Candlestick Pattern Scanner   — the ultimate version: a
HtfCandleProjection
Salama Sarobidy Andrianthary
HTF Candle Projection C'est un outil vraiment utile. Il vous montre, directement sur votre graphique, des bougies d'unités de temps plus grandes ou même des périodes que vous avez définies. Avec lui, vous pouvez voir jusqu'à 3 projections différentes en même temps. Ça vous donne une bonne idée des grandes tendances, sans avoir à changer d'unité de temps. Voici ses principaux atouts : Voir plusieurs unités de temps à la fois : Vous pouvez afficher des bougies H4, D1, W1, ou même des périodes qu
Traditional Pivot Points Pro is a professional MQL5 indicator designed to display accurate pivot levels with an automatic session-based calculation logic. It plots the main pivot point (P) together with resistance and support levels R1, R2, S1, and S2 in a clean and readable format. The indicator is built for traders who want a simple and efficient way to identify key market levels, potential reversals, intraday support and resistance zones, and price reaction areas. It is especially useful for
Dual Trend Analyzer
Elidio Xavier Guimaraes
The Dual Trend Analyzer: An MQL5 Tool for Statistical Correlation Analysis The Dual Trend Analyzer is a powerful MQL5 tool developed to analyze and visualize the statistical correlation between two distinct financial symbols (assets). This tool allows you to choose from three of the most widely recognized correlation methods: Pearson, Spearman, or Kendall-Tau . Identify Correlation Patterns with the Dual Trend Analyzer This indicator is designed to unveil the statistical correlation between two
# SSL ST Strategy MT5 Indicator - Chinese (Simplified) Version SSL ST Strategy MT5指标是一个技术分析工具,旨在帮助交易者在交易图表上清晰地识别买卖信号。它提供视觉指标(如线条和箭头),以及声音、弹出和推送通知,在出现交易机会时及时提醒交易者。 ## 主要优势 - 在图表上直接提供清晰的视觉信号,使用彩色线条(SSL1和基线)和箭头表示买入(绿色三角形)和卖出(红色三角形)信号。 - 支持声音警报、弹出警报和移动推送通知,确保交易者即使不在屏幕前也不会错过重要信号。 - 允许反转信号逻辑,使其适应不同的交易策略或市场条件。 - 使用基于高点、低点和收盘价的指数移动平均线(EMA)以获得更响应和平滑的信号生成。 - 内置过滤功能可防止同一信号柱的重复警报,减少噪音和警报疲劳。 ## 输入参数 - **len**: 设置SSL1和基线EMA计算的周期长度(默认60)。 - **show_Baseline**: 选择在图表上显示或隐藏基线EMA线。 - **show_SSL1**: 选择在图表上显示或
FREE
All in One Multi Indicator
Teerathad Booranawisedkul
Overview Comprehensive technical analysis indicator combining 20+ essential trading tools in a single chart display. Moving Averages EMA (Exponential Moving Average): 9, 21, 50, 200 periods SMA (Simple Moving Average): configurable period Customizable colors and line widths Price position indicators (above/below) Oscillators & Momentum RSI (Relative Strength Index): adjustable overbought/oversold levels MACD (Moving Average Convergence Divergence): customizable fast/slow/signal periods Stochasti
Special offer : ALL TOOLS , just $35 each! New tools   will be   $30   for the   first week   or the   first 3 purchases !  Trading Tools Channel on MQL5 : Join my MQL5 channel to update the latest news from me Zero Lag MA Trend Levels MT5与扫描仪指标结合了零滞后移动平均线 (ZLMA) 和标准指数移动平均线 (EMA),为交易者提供了市场动量和关键价格水平的全面视图。此外,扫描仪和警报功能使交易者能够轻松跟踪多个货币对和时间框架的信号,从而增强发现交易机会的能力。 See more MT4 version at:     Zero Lag MA Trend Levels MT4 with Scanner See more products at:   https://www.mql5.com/en/users/ndhsfy/seller 主要特点
该产品的买家也购买
ARIPoint
Temirlan Kdyrkhan
ARIPoint is a powerful trading companion designed to generate high-probability entry signals with dynamic TP/SL/DP levels based on volatility. Built-in performance tracking shows win/loss stats, PP1/PP2 hits, and success rates all updated live. Key Features: Buy/Sell signals with adaptive volatility bands Real-time TP/SL/DP levels based on ATR Built-in MA Filter with optional ATR/StdDev volatility Performance stats panel (Success, Profit/Loss, PP1/PP2) Alerts via popup, sound, push, or email Cu
SuperScalp Pro
Van Minh Nguyen
4.63 (24)
SuperScalp Pro – 高级多重过滤剥头皮指标系统 SuperScalp Pro 是一款高级剥头皮交易指标,将经典 Supertrend 与多种智能确认过滤器结合,帮助识别交易机会。它可高效运行于 M1 至 H4 多个时间周期,并针对 XAUUSD、BTCUSD 及主要外汇货币对进行了优化。 该指标提供清晰的 Buy 和 Sell 信号,并基于 ATR 自动计算入场价、止损和止盈水平,帮助交易者更有效地管理风险。Fibonacci Take Profit 功能可在关键价格水平提前平仓,并在到达这些水平时发送通知,从而提升交易管理效率与稳定性。 默认配置已启用 Fibonacci Take Profit,专注于更稳定、更持续的交易体验。您只需将指标加载到图表即可立即开始使用,无需额外设置。对于高级用户,所有参数均可完全自定义,以适应不同交易策略和偏好。 SuperScalp Pro 集成了 EMA、RSI、ADX、Volume、VWAP、Bollinger Bands 和 MACD Divergence 等多种过滤器,有助于减少虚假信号并提高入场质量。指标还包含图表内交互控制面
Entry In The Zone and SMC Multi Timeframe is a real-time 2-in-1 market analysis tool that combines market structure analysis and a No Repaint BUY / SELL signal system into a single indicator, built on Smart Money Concepts (SMC) — a widely adopted framework used by professional traders to understand market structure. This indicator helps you see the market more clearly, make decisions based on structure rather than guesswork, and focus on high-probability zones where price is more likely to react
Divergence Bomber
Ihor Otkydach
4.9 (88)
购买该指标的每位用户将额外免费获得以下内容: 原创工具“Bomber Utility”,该工具会自动跟踪每一笔交易,设置止损和止盈点,并根据策略规则自动平仓; 适用于不同交易品种的指标设置文件(Set 文件); 三种不同风险模式下的 Bomber Utility 设置文件:“最低风险”、“平衡风险” 和 “观望策略”; 一套详细的 视频操作手册,帮助您快速完成安装、配置并开始使用本交易系统。 注意: 要获取以上所有赠品,请通过 MQL5 的私人消息系统联系卖家。 我为您介绍原创的自定义指标 “Divergence Bomber”(背离轰炸机),它是一套基于 MACD 背离交易策略 的“全功能”交易系统。 该技术指标的主要任务是识别 价格与 MACD 指标之间的背离,并发出交易信号(包括推送通知),指示未来价格可能的运动方向。平均而言,这些信号的准确率超过 98%。有关该指标如何工作的详细说明,请观看本页面上的视频演示。 该系统使用 止损订单 和 动态回撤平仓机制 来管理交易。 Divergence Bomber 指标的主要特点: 支持交易的品种: AUDCAD、AUDCHF、AUDSG
Power Candles MT5
Daniel Stein
5 (8)
Power Candles V3 - 自我优化的强度指标 Power Candles V3 把货币与品种的强度直接转化为图表上可执行的交易方案。指标不再仅根据强度给K线着色,而是在后台持续运行实时自动优化,为您正面对的品种给出最佳 Stop Loss、Take Profit 与信号阈值。一键采用,Entry、Stop Loss、Take Profit 线就以精确价格绘制在图表上,提醒消息中直接包含方向。 本工具是 Stein Investments 生态系统的一部分 - 18+ 款工具,加上 Max,您的一对一 AI 交易导师。  随时在线,深入了解每一款指标,在您需要梳理思路的那一刻就在那里。  立即认识他: https://stein.investments 每根收盘K线运行 3,000+ 次交易模拟。9 种强度状态。2 种策略并行测试。一键采用最优配置。 为什么需要这个 大多数强度指标只给您一个数值,然后留下三个问题:相信哪个阈值、用哪个 Stop Loss、走哪个交易方向。Power Candles V3 在每根收盘K线上自动回答这些问题。结果就是一个完整的交易方案 -
SignalTech MT5
Yue Wang
5 (21)
SignalTech MT5 is a fully rule based trading system for EURUSD, USDCHF, USDJPY, AUDUSD, NZDUSD, EURJPY, AUDJPY, NZDJPY, CADJPY.  All the winning trades with chart setups are published on the comments page. 2025-12 1174 Pips 2026-01 2624 Pips 2026-02 2937 Pips 2026-03 2165 Pips 2026-04 2243 Pips It can generate signals with Buy/Sell Arrows and Pop-Up/Sound Alerts. Each signal has clear Entry and Stop Loss levels, which should be automatically flagged on the chart, as well as potential Targets 1,
介绍     Quantum Breakout PRO   ,突破性的 MQL5 指标,正在改变您交易突破区域的方式!由拥有超过13年交易经验的资深交易员团队开发,     量子突破 PRO     旨在通过其创新和动态的突破区域策略将您的交易之旅推向新的高度。 量子突破指标将为您提供带有 5 个利润目标区域的突破区域的信号箭头,以及基于突破框的止损建议。 它既适合新手交易者,也适合专业交易者。 量子 EA 通道:       点击这里 重要的!购买后请私信我领取安装手册。 建议: 时间范围:M15 货币对:GBPJPY、EURJPY、USDJPY、NZDUSD、XAUUSD 账户类型:ECN、Raw 或 Razor,点差极低 经纪商时间:GMT +3 经纪商:IC Markets、Pepperstone with Raw 和 Razor 的点差最低 规格: 不重漆! 最多 5 个建议利润目标区域 建议止损水平 可定制的盒子。您可以设置自己的 Box Time Start 和 Box Time End。 接触 如果您有任何疑问或需要帮助,请通过私人消息与我联系。
Azimuth Pro
Ottaviano De Cicco
5 (7)
Azimuth Pro V2:MT5合成分形结构分析与确认入场 概述 Azimuth Pro 是 Merkava Labs 推出的多层级波段结构指标。四层嵌套波段层级、锚定波段的VWAP、ABC形态识别、三时间框架结构过滤以及收盘确认入场——一个图表,一个从微观波段到宏观周期的完整工作流程。 这不是盲目的信号产品。它是一个以结构为先的工作流程,专为重视位置、背景和时机的交易者打造。 V2上市优惠 — Azimuth Pro V2售价USD 399(接下来的100份)。最终价格:USD 499。 1. V2的变化 合成多时间框架引擎 高时间框架分析从零开始重建,采用与Meridian Pro相同的专有合成架构。更清晰的HTF背景、稳定的实时行为、无经典MTF同步问题。合成引擎还解锁了 固定比率时间框架级联 (x2、x3、x4、x6)——不再在经纪商的固定时间框架之间任意跳转,您可以按图表时间框架的固定倍数分析结构,在每个尺度上保持相同的分形关系。 确认入场箭头 作为稳定且可恢复的执行层而设计的收盘确认箭头。当ABC设置形成且自适应确认逻辑在收盘K线上验证方向时,箭头会写入下一根K线的
Gann Made Easy MT5
Oleg Rodin
5 (4)
Gann Made Easy   是一个专业且易于使用的外汇交易系统,它基于使用先生理论的最佳交易原则。 W.D.江恩。该指标提供准确的买入和卖出信号,包括止损和获利水平。您甚至可以使用推送通知在旅途中进行交易。 购买后请联系我,即可免费获得交易指导和超棒的额外指标! 您可能已经多次听说过江恩交易方法。通常 Gann 的理论不仅对于新手交易者而且对于那些已经有一定交易经验的人来说都是非常复杂的东西。这是因为江恩的交易方法在理论上并不那么容易应用。我花了几年时间来完善这些知识,并将最好的原则应用到我的外汇指标中。 该指标非常易于应用。您所需要的只是将其附加到您的图表并遵循简单的交易建议。该指标不断进行市场分析工作并寻找交易机会。当它检测到一个好的入口点时,它会为您提供一个箭头信号。该指标还显示止损和获利水平。 换句话说,当您像先生一样进行交易时,该指标会为您提供最佳江恩建议。江恩亲自告诉你此时此刻该做什么。但最好的部分是您不需要了解任何有关江恩交易原则的知识,因为该指标会为您完成整个市场分析工作。
RelicusRoad Pro MT5
Relicus LLC
4.96 (24)
RelicusRoad Pro: 量化市场操作系统 终身访问限时 70% 折扣 - 加入 2,000+ 交易员社区 为什么大多数交易者即使拥有“完美”指标也会失败? 因为他们在真空中交易 单一概念 。没有背景的信号是赌博。要持续获胜,您需要 共振 (CONFLUENCE) 。 RelicusRoad Pro 不是一个简单的箭头指标。它是一个完整的 量化市场生态系统 。它描绘价格运行的“公允价值之路”,区分市场噪音和真实的结构性突破。 停止猜测。开始用机构级“路”逻辑进行交易。 核心引擎:“Road” (路) 算法 系统的核心是 Road Algo ,一个实时适应市场条件的动态波动率通道。它投射出 安全线 (平衡) 和价格可能反转的 扩展水平 。 Simple Road: 典型市场的标准结构映射。 Smooth Road: 针对震荡盘整的降噪计算。 Breakout Road: 专为识别波动率扩张和爆发性走势而调整。 1. 算法动量与确认 我们的“剥头皮箭头”不只是简单的交叉。它们利用 高阶多项式逻辑 过滤噪音,确保信号与主周期一致。我们检测动量、价格行为和 Road 结构汇聚的精确入场
MetaTrader 5 智能多层突破与回调探测器 "智能 · 简单 · 快速!" 您是否厌倦了错过高概率的突破入场机会? 您是否花费数小时扫描多张图表,试图将突破与趋势方向和货币动能对齐——却仍然错过了行情? Break Pullback 用一个指标解决所有这些问题。 什么是 Break Pullback? Break Pullback 是一款专业级 MetaTrader 5 指标,专为交易市场结构、突破和趋势延续形态的交易者而设计。 它能实时自动检测多个货币对的突破与回调形态——并通过三层确认过滤每个信号: 结构突破检测——识别图表上的关键突破位 高时间框架日线偏向——将入场与主导日线趋势方向对齐 货币强弱指数——确认配对货币间的动能失衡 结果:更少的虚假信号,更强的信心,更快的执行——无需面对图表过载。 适合哪些交易者? Break Pullback 专为使用以下方法的交易者设计: 突破与回测策略 市场结构分析(BOS、 OB Order Block 、结构位) 聪明钱概念(SMC)或 ICT 风格入场 趋势跟踪与延续形态 跨外汇和黄金(XAUUSD)的多对扫描 日内和波段
购买此指标即可免费获得我的专业交易管理器。 首先,值得强调的是,这个交易系统是一个非重绘、非重画和非滞后的指标,这使得它非常适合手动和机器人交易。 在线课程,手册和下载预设。 “智能趋势交易系统 MT5”是专为新手和经验丰富的交易者量身定制的综合交易解决方案。它结合了超过 10 个优质指标,具有 7 多个强大的交易策略,使其成为适用于各种市场条件的多功能选择。 趋势跟随策略:提供精确的入场和止损管理,以有效地跟随趋势。 反转策略:识别潜在的趋势反转,使交易者能够利用区域市场的机会。 剃头策略:专为快速准确的日内交易和短期交易而设计。 稳定性:所有指标都不会重绘、不会重画和不会滞后,确保可靠的信号。 定制:支持自定义策略,以满足个人交易偏好。超过 7 种策略和组合可帮助您找到最佳策略。 信号清晰度:提供箭头信号,以指示清晰的入场和退出点。 实时警报:通过交易进出警报使交易者保持了解。 深入分析:提供更高时间框架的趋势分析和实时交易监控。 自适应颜色编码:利用蜡烛颜色编码来显示成交量、趋势和反转蜡烛信号。通过蜡烛颜色分析市场方向。 “智能趋势交易系统 MT5”赋予交易者必要的工具,以便在
Atomic Analyst MT5
Issam Kassas
3.94 (31)
首先值得强调的是,该交易指标是非重绘、非延迟的指标,这使其成为手动和机器人交易的理想选择。 用户手册:设置、输入和策略。 Atomic Analyst是一种PA价格行动指标,利用价格的力量和动量来寻找市场上更好的机会。配备了高级过滤器,可帮助去除噪音和假信号,并提高交易潜力。使用多层复杂的指标,Atomic Analyst扫描图表,并将复杂的数学计算转化为任何初学者都能理解并用来做出一致交易决策的简单信号和颜色。 “Atomic Analyst”是专为新手和经验丰富的交易者量身定制的综合交易解决方案。它将高级指标和一流功能融合为一体的交易策略,使其成为所有类型交易者的多功能选择。 日内交易和剥头皮策略:专为快速准确的日内交易和短期交易而设计。 日内和摆动交易策略:可用作追求价格大幅波动的日内和摆动交易者的可靠工具。 多货币和市场:凭借其可靠的精度,在不同的工具和市场上运作。 多个时间框架:可在多个时间框架上使用,性能良好。 稳定性:所有指标均不重绘、不重绘和不滞后,确保可靠的信号。 信号清晰度:提供箭头信号,用于清晰的入场和出场点。 实时警报:通过交易入场、SL和TP警报通知交易者
Quantum TrendPulse
Bogdan Ion Puscasu
5 (25)
介绍 Quantum TrendPulse   ,这是一款终极交易工具,它将 SuperTrend   、   RSI 和 Stochastic 的强大功能整合到一个综合指标中,以最大限度地发挥您的交易潜力。该指标专为追求精准和效率的交易者而设计,可帮助您自信地识别市场趋势、动量变化以及最佳进入和退出点。 主要特点: 超级趋势整合: 轻松跟随当前的市场趋势并乘上盈利浪潮。 RSI 精度: 检测超买和超卖水平,非常适合把握市场逆转时机,可用作 SuperTrend 的过滤器 随机精度: 利用随机振荡在波动的市场中寻找隐藏的机会, 用作超级趋势的过滤器 多时间范围分析: 从 M5 到 H1 或 H4,在不同时间范围内关注市场动态。 可定制的警报: 当您的自定义交易条件得到满足时收到通知,这样您就不会错过任何交易。 无论您是新手还是经验丰富的交易员,   Quantum TrendPulse 都能为您提供所需的优势,帮助您增强策略并自信地进行交易。借助这一强大的指标,将洞察力转化为利润 — 掌控您的交易! ***购买 Quantum TrendPulse,即可免费获得 Quantum Tr
FX Trend MT5 NG
Daniel Stein
5 (4)
FX Trend NG:新一代多市场趋势智能分析工具 概述 FX Trend NG 是一款专业的多时间周期趋势分析与市场监控工具,帮助您在几秒钟内全面了解市场结构。 无需在多个图表之间来回切换,您可以立即看到哪些品种处于趋势中、哪里动能正在减弱,以及哪些时间周期之间存在强烈共振。 限时发布优惠 – 仅需 $30(6个月) 或 $80 终身授权 即可拥有 FX Trend NG 。 已经是 Stein Investments 客户? -> 发送消息 以获取专属客户群访问权限。 需要帮助或安装指导? -> 请访问 Stein Investments 官方页面 。 1. FX Trend NG 的核心优势 三状态趋势逻辑 —— 不只是 Buy 或 Sell • 大多数指标仅显示两种状态:Buy 或 Sell。 • FX Trend NG 增加第三种状态: Fade 。 • Fade 表示趋势强度正在减弱,在完全反转之前提前发出信号。 这种结构化逻辑让您看到趋势变化过程,而不仅仅是简单方向信号。 多时间周期分析(M1 至 MN1) • 从短线交易到中长线交易全面覆盖。 • 快速识别趋势
Btmm state engine pro
Garry James Goodchild
5 (4)
BTMM State Engine Pro is a MetaTrader 5 indicator for traders who use the Beat The Market Maker approach: Asian session context, kill zone timing, level progression, peak formation detection, and a multi-pair scanner from a single chart. It combines cycle state logic with a built-in scanner dashboard so you do not need the same tool on many charts at once. What it does Draws the Asian session range; session times can follow broker server offset or be set in inputs. Tracks level progression (L
Market Structure Order Block Dashboard MT5 是一款专为希望直接在图表上解读市场结构和主要价格反应区域的交易者设计的MT5指标。它结合了BOS、ChoCH、订单块(Order Blocks)、公允价值缺口(FVG)、流动性、Kill Zones、成交量分布图以及一个紧凑的面板,便于快速分析。 本指标面向使用市场结构、ICT和Smart Money概念作为决策框架的交易者。它可以帮助以更结构化的方式识别趋势延续、可能的反转、价格失衡、流动性目标和关注区域。 面向买家的资源 购买后可通过MQL5私信申请获取完整的PDF使用指南和参数配置建议。通过MQL5私信提供直接技术支持。 1.20版本带来两项重要新增: Pending BOS / Pending ChoCH 检测 和 可拖动面板 (按住面板标题栏即可将其拖动到图表任意位置,不影响图表本身)。当K线收于前一摆动点之外时,Pending Breaks 立即显示待确认的结构突破,无需等待经典的摆动确认。 重要 本产品仅为指标。它不会自动开仓、平仓或管理仓位。它不是EA(智能交易系统)。 主要功能 市场
首先,值得强调的是,这个交易工具是非重绘、非重画和非滞后的指标,非常适合专业交易。 在线课程,用户手册和演示。 智能价格行动概念指标是一个非常强大的工具,既适用于新手,也适用于经验丰富的交易者。它将超过20个有用的指标合并到一个指标中,结合了高级交易思想,如内圈交易员分析和智能资金概念交易策略。该指标侧重于智能资金概念,提供有关大型机构交易方式的见解,帮助预测它们的动向。 它在流动性分析方面尤其擅长,有助于理解机构的交易方式。它擅长预测市场趋势,并仔细分析价格波动。通过将您的交易与机构策略对齐,您可以更准确地预测市场走向。该指标多才多艺,擅长分析市场结构,识别重要的订单区块,并识别各种模式。 它擅长识别BOS和CHoCH等模式,理解动量的转变,并突出显示供需强劲的关键区域。它还擅长发现强大的不平衡,并分析价格创造更高高点或更低低点的模式。如果您使用斐波那契回撤工具,该指标可以满足您的需求。它还可以识别相等的高点和低点,分析不同的时间框架,并通过仪表板显示数据。 对于使用更高级策略的交易者,该指标提供了工具,如公平价值差指标和优惠和折扣区域的识别。它特别关注高时间框架订单区块,并
Grabber System MT5
Ihor Otkydach
4.83 (23)
向您介绍一款优秀的技术指标——Grabber,它是一套即开即用的“全包式”交易策略。 在一个代码中集成了强大的市场技术分析工具、交易信号(箭头)、提醒功能和推送通知。 每位购买该指标的用户还可免费获得以下内容: Grabber辅助工具:用于自动管理已开仓位 视频操作指南:逐步教学如何安装、设置和使用该指标进行交易 原创Set文件:可快速自动配置,帮助实现最佳交易效果 忘掉其他策略吧!只有Grabber能够真正激励你在交易中攀登新高峰! Grabber策略的主要特点: 交易周期:从M5到H4 适用资产:任意,但我推荐我亲自测试过的品种(GBPUSD、GBPCAD、GBPCHF、AUDCAD、AUDUSD、AUDSGD、AUDCHF、NZDUSD、NZDCAD、EURCAD、EURUSD、EURAUD、EURGBP、EURCHF、USDCAD、USDSGD) 交易时间:全天候 24/7 交易效果:我分享自己的真实交易结果,并在此教学如何操作: https://www.mql5.com/ru/market/product/134563?source=Site+Market+MT5+Indic
Crystal Heikin Ashi Signals
Muhammad Jawad Shabir
5 (2)
Crystal Heikin Ashi Signals - Professional Trend & Signal Detection Indicator Advanced Heikin Ashi Visualization with Intelligent Signal System for Manual & Automated Trading Final Price: $149 ---------> Price goes up $10 after every 10 sales . Limited slots available — act fast . Overview Crystal Heikin Ashi Signals is a professional-grade MetaTrader 5 indicator that combines pure Heikin Ashi candle visualization with an advanced momentum-shift detection system. Designed for both manual traders
SMC Intraday Formula
Kareem Abbas
5 (8)
让我们先坦诚一点。 没有任何一个指标可以单独让你实现盈利。如果有人告诉你可以,那他是在向你兜售一个梦想。任何显示完美买卖箭头的指标都可以被做得看起来毫无瑕疵——只需要放大历史中的某一段并截取成功交易的截图。我们不会这样做。 SMC Intraday Formula 是一个工具。 它为你读取市场结构,标记出概率最高的价格区域,并用简单直白的语言准确告诉你当前智能资金的行为轨迹。你仍然需要做决定。你仍然需要执行交易。但现在,你是带着精确性执行,而不是靠希望。 我们已经在黄金(XAUUSD)以及主要外汇货币对的日内剥头皮交易中使用该指标将近三年。这是我们在 M1、M5、M15 和 M30 上的日常主力工具。它之所以有效,是因为它不试图预测未来——它展示的是当前正在形成的高概率交易机会,并解释 为什么 。 它与其他所有指标有什么不同? 大多数交易指标只做一件事。移动平均线交叉。振荡指标触及某个水平。出现一个箭头。你进场交易。你亏损。你责怪指标。重复。 SMC Intraday Formula 将多个机构级概念整合为一个统一的市场解读: - 斐波那契共振引擎 不只是普通的斐波那契水平——该指标
“ Dynamic Scalper System MT5 ”指标专为在趋势波内进行剥头皮交易而设计。 已在主要货币对和黄金上进行测试,并可与其他交易工具兼容。 提供顺势短线建仓信号,并提供额外的价格变动支持。 指标原理: 大箭头决定趋势方向。 在趋势波内,我们采用一种生成小箭头形式的剥头皮交易信号的算法。 红色箭头代表看涨方向,蓝色箭头代表看跌方向。 敏感的价格变动线会沿着趋势方向绘制,并与小箭头信号协同作用。 信号运作方式如下:当线在适当时刻出现时,将形成入场信号;在出现线时,持仓;线完成后,平仓。 建议的操作时间范围为M1 - H4。 箭头在当前K线上方形成,如果下一根K线已开仓,则不会重新绘制上一根K线上方的箭头。 输入参数 Trend Wave Period - 趋势方向(大箭头)的周期,改变趋势波的时间间隔。值 1 表示趋势方向的最长持续时间,参数值越大,持续时间越短。 Scalper Arrows Period - 信号箭头(小箭头)的计算周期,改变入场信号的生成频率。值 3 表示最频繁的生成频率,参数值越大,箭头频率越低,准确度越高。 这些参数可以根据不同
Basic Harmonic Patterns Dashboard MT5
Mehran Sepah Mansoor
4.36 (11)
该仪表盘显示所选符号的最新可用谐波形态,因此您可以节省时间并提高效率 /  MT4 版本 。 免费指标:  Basic Harmonic Pattern 指标列 Symbol:   显示所选符号 Trend:     看涨或看跌 Pattern:    形态类型(Gartley、蝴蝶、蝙蝠、螃蟹、鲨鱼、Cypher 或 ABCD) Entry:     入口价格 SL: 止损价 TP1: 第一止盈价 TP2: 第二次获利价格 TP3: 第三次获利价格 Current price:    当前价格 Age (in bars):   最后绘制的模式的年龄 主要输入 Symbols :   从 "28 种主要货币对 "或 "选定符号 "中选择。 Selected Symbols :   希望监控的符号,用逗号分隔("EURUSD,GBPUSD,XAUUSD")。如果您的经纪商为货币对设置了后缀或前缀,您必须在以下两个参数中添加(货币对前缀或货币对后缀)。 Max Iteration:   调整模式的最大迭代次数(如果该值越小,则模式越少,性能越快;如果该值越大,则模式越多,性能越慢)
Meridian Pro
Ottaviano De Cicco
5 (2)
Meridian Pro 2.00:MT5 专业多周期趋势矩阵 Meridian Pro 2.00 是面向 MetaTrader 5 的专业自适应趋势矩阵。它结合了原始 Meridian 趋势引擎、清晰的图表 ribbon、收盘柱确认箭头、8 周期 dashboard、Fuel 动量、加权共识、合成 HTF 处理,以及直接显示在当前图表上的高周期环境线。 目标很简单:在一个有纪律的 workflow 中读取当前趋势、多周期结构、强度、动量和 EA-ready 状态,而不是在多个图表上堆叠互不关联的指标。 Meridian Pro 的不同之处 一个自适应引擎 - 同一套波动率感知 Meridian 逻辑应用于 M1 到 W1。 合成 HTF 架构 - 高周期行由低周期数据推导,减少传统零售 MTF 中常见的 repaint、同步延迟和 broker-dependent HTF 质量问题。 完整矩阵输出 - Bias、Strength、Fuel 和加权 Consensus 一起显示,而不是拆成独立工具。 图表执行层 - ribbon 和箭头专注于当前周期,选配 HTF 线在同一图表上增加高
OmniSync Projection
Antonio-alin Teculescu
5 (1)
Chronos Fractal Engine is an innovative price projection indicator for MetaTrader 5, designed to transform your technical analysis by intelligently identifying and projecting historical price patterns. Built upon an advanced correlation algorithm and the fractal principles of the market, this powerful tool visualizes potential future price movements, giving you a unique edge in your trading decisions. What is Chronos Fractal Engine? At its core, the Chronos Fractal Engine employs a sophisticat
FX Power MT5 NG
Daniel Stein
5 (31)
FX Power:分析货币强度,助您做出更明智的交易决策 概述 FX Power 是一款专业工具,帮助您全面了解主要货币和黄金在任何市场条件下的真实强度。通过识别强势货币用于买入,弱势货币用于卖出, FX Power 简化了交易决策,并帮助您发现高概率的交易机会。不论您是想跟随趋势还是通过极端的 Delta 值预测反转,这款工具都能完美适应您的交易风格。别再盲目交易——用 FX Power 让您的交易更加智慧。 1. 为什么 FX Power 对交易者极具价值 实时货币和黄金强度分析 • FX Power 实时计算并显示主要货币和黄金的相对强度,助您全面了解市场动态。 • 监控领先或落后资产,轻松识别值得交易的货币对。 全面的多时间框架视图 • 跟踪短期、中期和长期时间框架的货币和黄金强度,以便将您的交易策略与市场趋势保持一致。 • 无论是快进快出的短线交易还是更长期的投资策略, FX Power 都能为您提供所需的信息。 Delta 动态分析用于趋势和反转 • 极端 Delta 值常常预示反转机会,而平缓的 Delta 变化则确认趋势延续。 • 使用 Delta 分析,轻
FX Levels MT5
Daniel Stein
5 (13)
FX Levels:适用于所有市场的高精度支撑与阻力 快速概览 想要精准确定适用于任何市场(外汇、指数、股票或大宗商品)的支撑与阻力吗? FX Levels 将传统的“Lighthouse”方法与前沿的动态分析相结合,实现近乎通用的准确性。依托真实经纪商经验和自动化的每日与实时更新, FX Levels 帮助您捕捉价格反转点、设置合理的盈利目标,并自信地管理交易。立即使用,体验更准确的支撑/阻力分析如何助力您的交易更上层楼! 1. 为什么 FX Levels 对交易者非常有利 极度精准的支撑 & 阻力区 • FX Levels 专为不同经纪商提供的行情源和时间设置而设计,可生成几乎相同的价位区,解决数据不一致的常见问题。 • 这意味着无论您在哪里交易,都能获得稳定一致的水平线,为策略打下更加牢固的基础。 结合传统与先进技术 • 通过将久经考验的“Lighthouse”方法与动态分析相融合, FX Levels 不仅限于每日刷新,还可针对新的价格波动进行即时更新。 • 您可以选择经典的静态方式,或实时捕捉新出现的水平,以贴近最新的市场行为。 识别清晰的反转点 • FX Lev
Market Structure Patterns
Samuel Manoel De Souza
4.47 (19)
Market Structure Patterns   is an indicator based on   smart money concepts   that displays   SMC/ICT   elements that can take your trading decisions to the next level. Take advantage of the   alerts ,   push notifications   and   email messages   to keep informed from when an element is formed on the chart, the price crosses a level and/or enters in a box/zone. Developers can access the values of the elements of the indicator using the   global variables  what allows the automation of trading
Trend Lines PRO MT5
Roman Podpora
5 (1)
趋势线专业版 -     有助于了解市场真正转变的方向。该指标显示了真正的趋势反转点以及主要参与者重新入场的点位。 你看     BOS线路   无需复杂设置或不必要的干扰,即可在高时间框架内显示趋势变化和关键水平。信号不会重绘,并在K线收盘后仍保留在图表上。 MT4 版本   - 与 RFI LEVELS PRO 指示器结合使用时,可发挥其最大潜力 该指标显示的内容: 真正的转变   趋势线(BOS线) 一旦信号出现,它就始终有效!这与会重绘的指标有着重要的区别,后者可能会发出信号后又改变信号,从而导致资金损失。现在,您可以更精准、更准确地进入市场。此外,还有一个功能:在箭头出现后,K线会着色,直到达到目标价位(止盈)或出现反转信号为止。 重复条目   以及主要玩家的充值 为了提高寻找入场点时的视觉清晰度,我们创建了一个模块,该模块首先显示买入/卖出区域,并在该区域内寻找最佳入场点。此外,我们还加入了智能逻辑来管理止损位,该逻辑会随着时间的推移逐步降低止损位的大小,从而降低入场时的初始风险( 移动止损位 )。 信号强度水平     (BOS) 该指标采用三个显著性等级来衡量趋势变化
The Zone Trading Indicator is a technical analysis tool for MetaTrader 5 that automatically identifies and displays tradable price zones across multiple timeframes to assist with structured market analysis. The indicator plots Monthly, Weekly, Daily, and H4 tradable zones , allowing traders to view higher- and lower-timeframe price areas simultaneously. These zones are designed to support one-candle–based entry approaches by highlighting predefined areas where price interaction may be monitored.
作者的更多信息
Buy Sell Multiple Panel - Execute Bulk Orders in a Single Click! Description: Save time and seize market opportunities instantly. This powerful panel allows you to place multiple buy or sell orders simultaneously, each with custom lot sizes, take-profit, and stop-loss levels. Perfect for sophisticated entry strategies and managing complex trades efficiently. Key Features: Bulk Order Execution: Open multiple market orders at once with just one click. Flexible Lot Sizing: Set individual lot size
Daily Price Ruler Pro - Visual Grid for Daily Open Levels An essential visual tool that creates a dynamic, customizable "Price Ruler" anchored to the Daily Open price. Perfect for day traders to track pip/point distances from the start of the day at a glance. Full Description:   Daily Price Ruler Pro   is a lightweight, highly customizable indicator designed for precise price action and distance tracking. It automatically plots a vertical "Ruler Body" ahead of the current price action, with hor
FREE
Buy Sell Multiple Panel - Execute Bulk Orders in a Single Click! Description: Save time and seize market opportunities instantly. This powerful panel allows you to place multiple buy or sell orders simultaneously, each with custom lot sizes, take-profit, and stop-loss levels. Perfect for sophisticated entry strategies and managing complex trades efficiently. Key Features: Bulk Order Execution:   Open multiple market orders at once with just one click. Flexible Lot Sizing:   Set individual lot
DCA Hedging
Hoai Phuong Tran
DCA Hedge EA - Advanced Money Management Algorithm Overview DCA Hedge EA is a sophisticated automated trading robot, designed to effectively implement Dollar-Cost Averaging (DCA) and risk management strategies. The EA operates completely independently, eliminating subjective emotions and optimizing position averaging in volatile markets. Key Features DCA Strategy:   Calculates optimal entry points and increases volume at pre-defined price levels to lower the average cost, while simultaneously
DCA Smart
Hoai Phuong Tran
DCA Smart EA - Advanced Multi-Function Algorithm Overview DCA Smart EA is a versatile automated and semi-automated trading robot. It is expertly designed to implement sophisticated Dollar-Cost Averaging (DCA), Hedging, and inter-account trade copying strategies. The EA operates independently to eliminate emotional trading and optimize position averaging in volatile markets. Through its intuitive dashboard, you can configure automatic hedging or execute manual hedging commands with a single cli
Hi Traders, Have you ever traded using the DCA (Dollar-Cost Averaging) method with limit orders and wanted to set up Take Profit automatically? This   DCA Limit Auto TP Panel   is the perfect tool to support your strategy. Key Features: Lot Size:   Configure the lot size for your pending orders. Martingale:   Automatically increase the lot size for subsequent pending orders. Take Profit:   Set your profit target in points and activate automatic Take Profit. Stop Loss:   Define your risk managem
Local Trade Copiier is a professional utility designed to copy and synchronize trades between trading accounts. With its easy 1-minute setup, this trade copier allows you to copy trades between multiple MetaTrader terminals on the same Windows computer with lightning-fast copying speeds of under 0.5 seconds. Whether you're a beginner or a professional trader, the Local Trade Copiier MT5 offers a wide range of options to customize it to your specific needs. It's the ultimate solution for anyone l
Multi Time frame
Hoai Phuong Tran
Multi TimeFrame Candle Indicator Description: Tired of switching between charts to analyze multiple timeframes? The Multi TimeFrame Candle Indicator solves this problem by displaying candlestick data from any higher time frame directly on your current chart. Gain a broader market context and make more informed trading decisions without the clutter. Key Features: View Any Timeframe: Easily display candles from any larger time period (e.g., see H1 candles on your M15 chart). Customizable Appeara
MQL5 SmartLevel Panel with Auto-Update Level Lines Description This SmartLevel Panel is a powerful and intuitive trading tool for MetaTrader 5, designed to help traders place orders with precision and efficiency. The panel features intelligent Level Lines that automatically update with price movements and are automatically removed if not confirmed within 1 minutes, preventing forgotten pending orders. Key Features Smart Level Line Management Auto-Update Functionality : The BuyLevelLine and Sell
Ichi Grid Lot EA
Hoai Phuong Tran
[ENGLISH] ICHIMOKU DCA PRO - Advanced Grid & Flash Crash Protection EA A premium Expert Advisor combining the power of the Ichimoku Kinko Hyo indicator with a modern DCA Grid system, fortified with the most advanced Safety Protections available on MQL5 today. This guide explains the parameters as they appear in the Inputs tab of MetaTrader 5. 1. ICHIMOKU SETUP (CORE LOGIC) •Timeframe for Trading: Timeframe used to check price position relative to Span B. •Tenkan-sen/Kijun-sen/Senkou Span B Pe
Ultimate Trade Assistant Pro: 3-in-1 Chart Tool Ultimate Trade Assistant Pro   is a powerful all-in-one chart utility designed for professional traders who want to maintain a clean chart while having access to essential trading data. By combining three highly sought-after tools into a single lightweight indicator, it helps you monitor your open positions, visualize price levels, and analyze multiple timeframes simultaneously—all without cluttering your MetaTrader 5 terminal. Whether you are a da
筛选:
无评论
回复评论