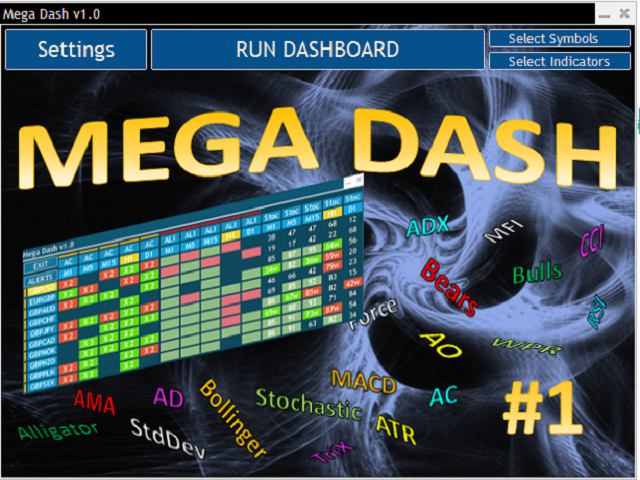
Mega Dashboard

5

The Ultimate Dashboard

New Year Sale - save $20   (normal price $79)

Indicators are useful for traders, but when you put them into a dashboard that can scan 28 symbols at once they become even better, and when you can also combine different indicators and timeframes to give you synchronized alerts, then they become awesome.

This easy to use dashboard provides you with 32 leading indicators, use them individually or together, to create powerful combination alerts. So when you want to know that RSI is above 25 and the price is above the moving average and the MACD says Buy all at the same time, then this is dashboard for you. 

No more entering endless input parameters to setup a dashboard, this dashboard has a full GUI interface, allowing you to create your own dashboard quickly and simply.

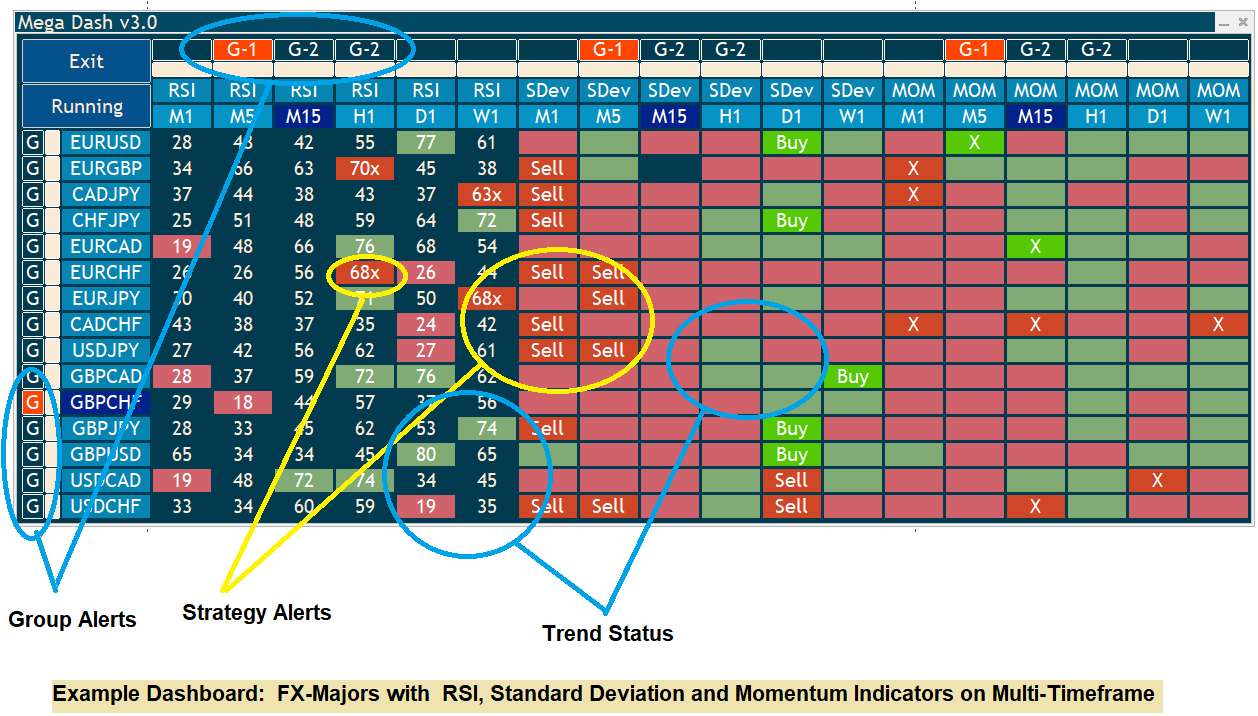
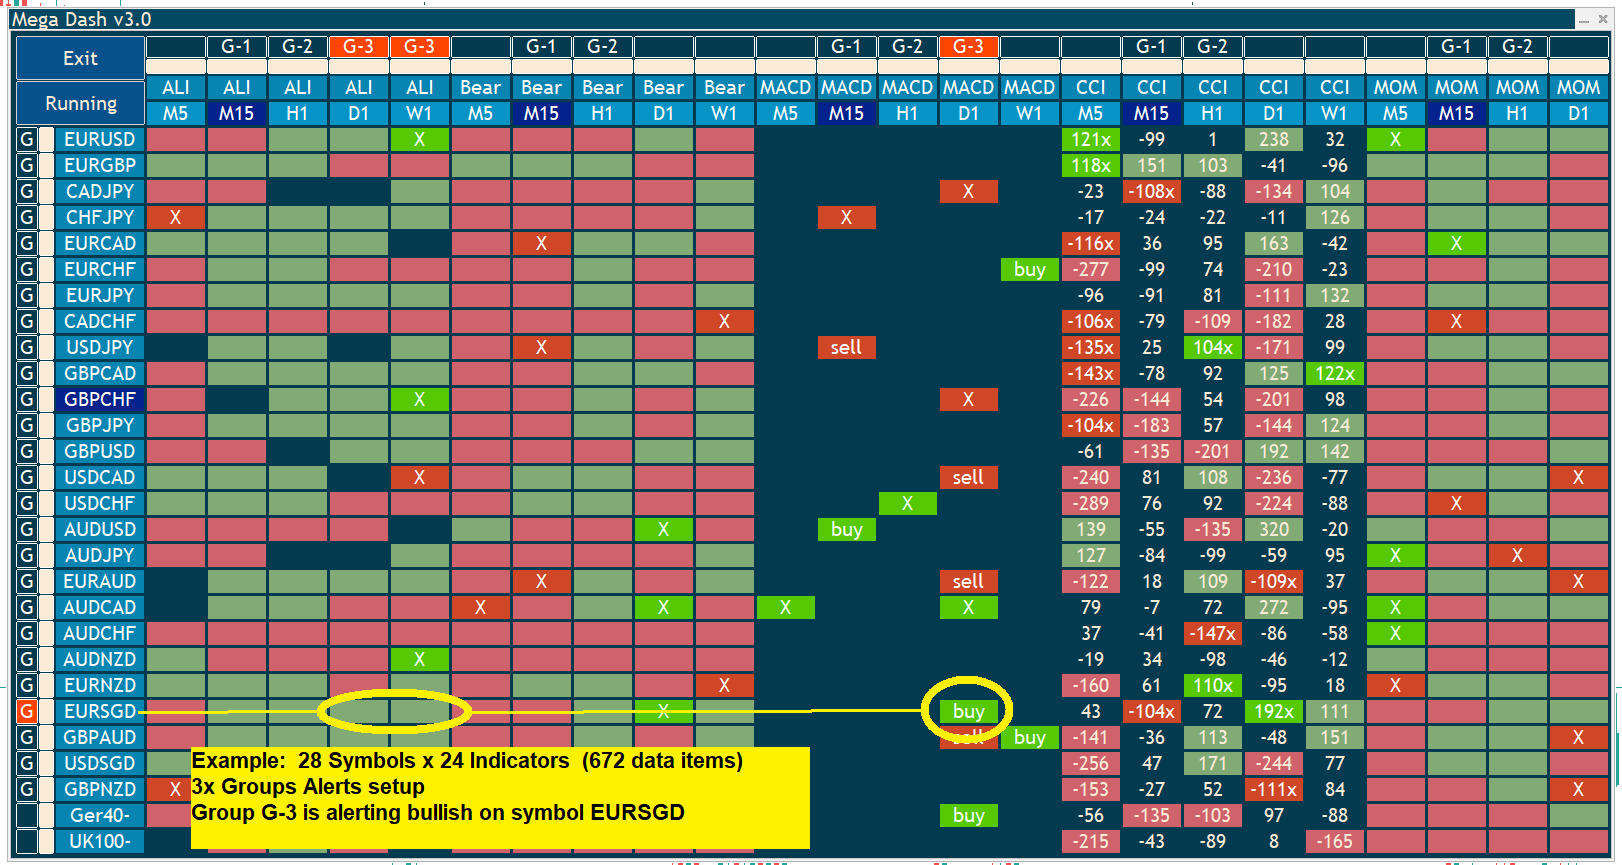
Each dashboard can be upto 28 Symbols x 24 indicators.

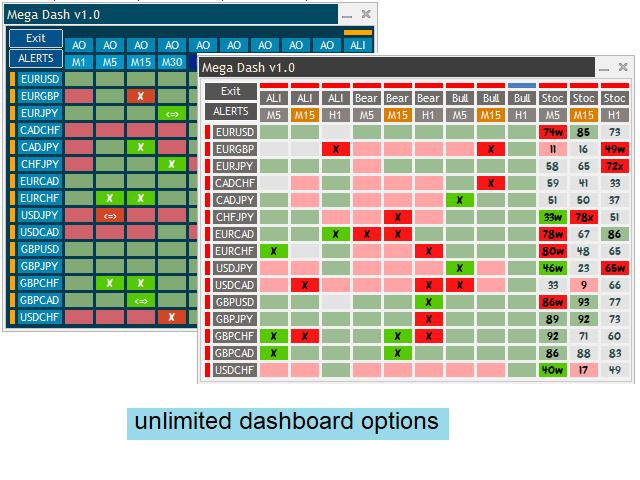
Mix and match from 32 indicators and all timeframes, to create unlimited unique dashboards.

Each indicator can have it's own settings, thresholds and timeframe.

Create Individual or Group Alerts to be informed when your chosen indicators are aligned for any symbol.

34 customizable trading strategy alerts (Trend, Breakout, Overbought, Oversold, Thresholds, Saucers etc).

Control the chart from the dashboard with just a single mouse click (Symbol, Timeframe, add/remove Indicators)

Scalper, Day or Long Term Trader?  Mega Dash has you covered, design your unique dashboard to suit your trading style.

Mega Dash is probably the most flexible and easy to use dashboard there is - see the video below. 

Unique graphical interface allows you to design your personal dashboards in just seconds, No typing in parameter settings or endless strings of symbol names, just a few clicks is all it takes. 

Why buy a dashboard for one indicator when Mega Dash has 31 including the new MA x-Trend indicator that allows you to define moving average crossovers.

Dashboard Features

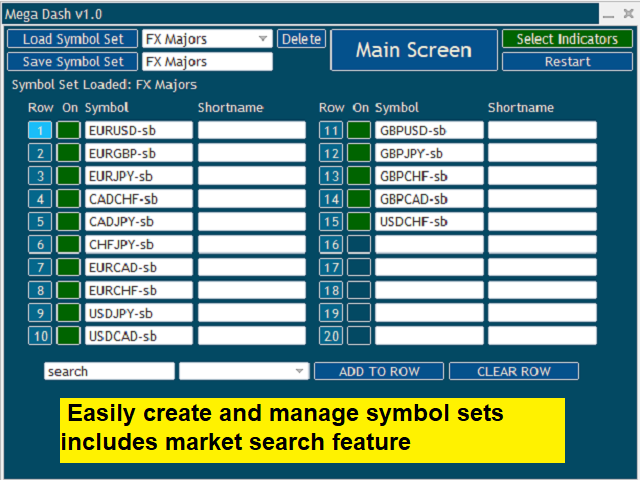
  • Unlimited symbol sets      - create with built in market search facility
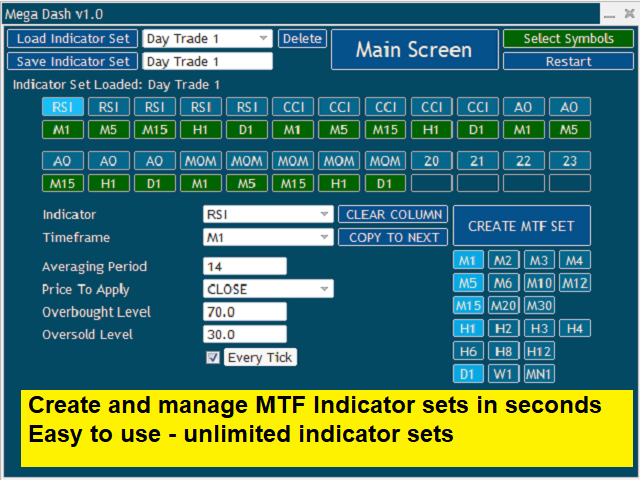
  • Unlimited indicator sets   - create from 31 leading indicators and 21 timeframes
  • Unlimited dashboards       - up to 28 symbols x 24 indicators each
  • 34 different trading strategy alerts
  • 32 leading indicators (see list below)
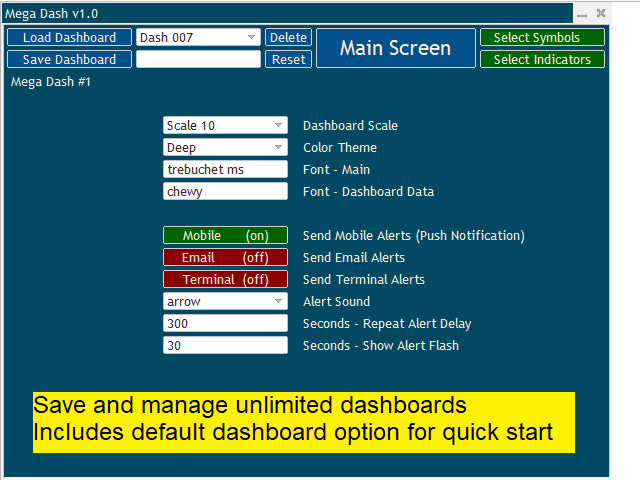
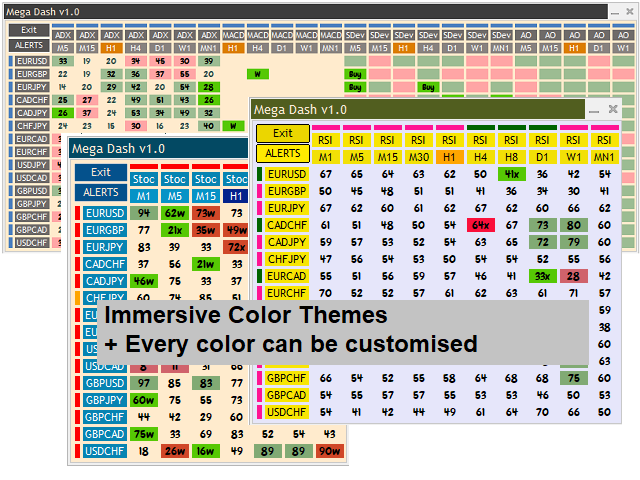
  • Multiple immersive color themes (customizable)
  • Alerts – Audible, Visual, Terminal, Email, Mobile
  • Group Alerts (upto 9 separate groups per dashboard)
  • 21 different alert sounds
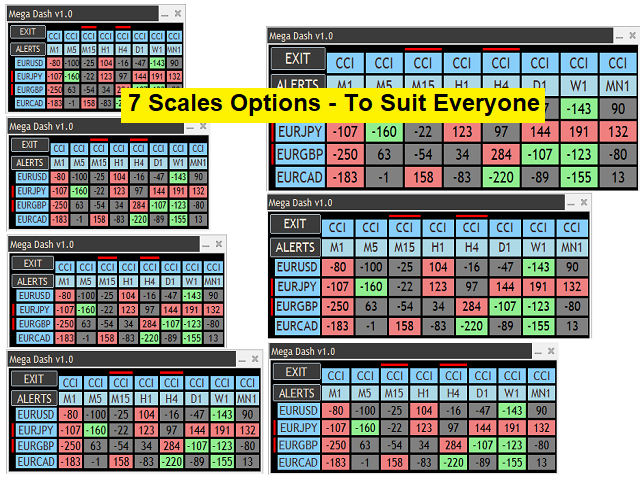
  • 7 different scales to suit every user and chart size
  • Control chart from dashboard (timeframe, symbol and indicator)
  • Easy to use graphical interface
  • Supports High Definition Monitors (UHD)
  • Unique mobile alert process to comply with MQL limits across all our products.
  • Full manual with detailed Trading Strategy Alerts guide
  • Great support

So don't waste your money on other dashboards when you can get all this in one package.

Links:      MANUAL   |   EXAMPLES   |   MT4 Version   

31 Indicators included

Accelerator Oscillator
Momentum
Average Directional Index (ADX) plus Wilder version
Money Flow Index
Alligator
Moving Average
Adaptive MA
Moving Average x-Trend
Awesome Oscillator
Moving Average Oscillator (MACD Histogram)
Average True Range (ATR)
Moving Averages Convergence-Divergence (MACD)
Bears Power
Parabolic Stop and Reverse System (SAR)
Bulls Power
Relative Strength Index (RSI)
Bollinger Bands
Relative Vigor Index (RVI)
Commodity Channel Index (CCI)
Standard Deviation
Chaikin Oscillator
Stochastic Oscillator
Double Exponential MA
Triple Exponential MA
DeMarker Triple Exponential MA Oscillator
Force Index
Triangular Moving Average Bands (TMA)
Fractal Adaptive MA
Williams Percent Range (WPR) 
   Variable Index Dynamic Average

.

#tags #scanner #dashboard #trading #board #panel #regression #trend #multi #timeframe #mtf #scalping #trading #indicator #accelerator #oscillator #average #adx #alligator #adaptive #AMA #true #range #ATR #bear #bulls #bollinger #commodity #channel #index #CCI #Chaikin #exponential #DEMA #demarker #force #index #fractal #adaptive #FAMA #momentum #money #flow #MFI #moving #MA #convergence #divergence #MACD #Parabolic #PSAR #relative #strength #RSI #vigor #RVI #standard #deviation #std #stochastic #stoch #triple #TEMA #williams #percent #WPR #TMA


评分 5
Sebastian Podeswa
332
Sebastian Podeswa 2025.03.31 17:31 
 

A big thank you to the developer. He implemented my request almost immediately. Everything works flawlessly; the modular concept is fantastic; it couldn't be better. I think this dashboard allows you to quickly get an overview of almost any strategy, which saves a tremendous amount of time. And the support is perfect. Thanks, Paul.

Max
1619
Max 2024.07.14 15:04 
 

This is a brilliant tool. Its clever design is easy to use, and set up custom to your needs. I like it and it’s really helpful to me. It was very important to be able to select my own timeframes and symbols so this was the magic answer, feature seems pretty unique on the market and wish i had bought it sooner! Many strategies can be implemented. The manual is very good and explains it, must be read. Same as others, i recommend.

jpp75purdue
59
jpp75purdue 2023.02.05 06:32 
 

very easy setup, very customizable, easy on the eyes interface; a great technical toolbox every trader should have

推荐产品
Breakeven Line V2
Hoai Phuong Tran
Breakeven Line v2 Indicator   is a MetaTrader indicator that calculates breakeven level based on all open positions and displays it on your chart as a horizontal line. Additionally, it will calculate the total number trades, the total number of lots, and the distance to the breakeven line in points and profit/loss. The indicator is available for MetaTrader 5 . Why use Breakeven Line Indicator? When you have multiple trades opened on a single symbol, it can be difficult to tell where your averag
The third indicator from the set for market analysis. The first one is here:  https://www.mql5.com/ru/market/product/65258 The second one is here: https://www.mql5.com/ru/market/product/65347 The indicator builds a channel of maximum price fluctuations for a specified period. Additionally, the middle of the channel is drawn. All color settings, line types are customizable. The indicator allows you to see the picture of price movement from a slightly different angle. You can use several indic
RSImaxmin
Carlos Andrés Moya Erazo
4.5 (10)
The indicator shows when there are overprice and divergences on the RSI. In addition, it has configurable alerts, dynamic overprice levels and a special “RSI cleaner” function. The indicator that automatically calculates the premium rates! RSImaxmin is an indicator based on the Relative Strength Index (RSI) oscillator that effectively identifies changes in price trends as it reflects the relative strength of bullish movements compared to bearish movements. It is widely used by traders to measur
MA7 Aster MT5
Andrey Minaev
Description of work The MA7 Aster indicator is based on the standard Moving Average indicator. Shows the price deviation from the moving average. Detailed information about the MA7 Aster indicator. Indicator settings General settings: Period ; Method ; Apply to ; Minimum distance – minimum distance from the moving average to the closing price of the candle. Message settings: Send message to the terminal (Alert) – permission to send messages to the terminal using the Alert function; Send messag
Trade Area
Jinsong Zhang
Most time the market is in a small oscillation amplitude. The Trade Area indicator helps users to recognize that time. There are 5 lines in this indicator: Area_high, Area_middle, Area_Low, SL_high and SL_low. Recommendations: When price is between Area_high and Area_Low, it's time to trade. Buy at Area_Low level and sell at Area_high level. The SL_high and SL_low lines are the levels for Stop Loss. Change the Deviations parameter to adjust SL_high and SL_low.
如果您想测试该保本(Breakeven)指标,请在 MQL5 上通过此处联系我,我将向您发送一个有效期为 1 周 的演示版本。 保本线是一个对您交易非常有用的工具。 保本线的目的是以图形方式显示价格水平,在该水平上您的持仓开始盈利。 该保本指标包含 两个简单的功能: 可以仅计算您所附加指标的当前交易品种的保本价格。 可以计算所有已开仓位的保本价格。 该指标包含 4 个输入参数: True:仅计算当前交易品种的保本价; False:计算所有已开仓交易品种的保本价(True / False 选择)。 BreakEvenColor:可选择您喜欢的保本线颜色。 BreakEvenWidth:可选择您喜欢的线条宽度。 BreakEvenStyle:可选择您喜欢的线条样式。
PillowIndicator
Sergey Shevchenko
If you need an indicator that shows market entry points, then this is your indicator.  The indicator is not redrawn. Shows buy and sell points for any TF (time frame) and any currency pair. Settings are adjustable for all instruments. You can configure each parameter for any broker, for any account. This is a PILLOW that is comfortable :)) Just check it out.....
Non Repaint System
Black Panther AI
Non Repaint System V3.0 The Non Repaint System V3.0 is a technical indicator developed for MetaTrader 5. Its primary function is to provide visual signals on the trading chart. A key characteristic of this indicator is that its signals, once generated and a candle closes, do not repaint or recalculate. This design ensures that the historical representation of signals remains consistent with their initial appearance, offering a stable reference for market analysis. Operational Modes This indicat
这种多时间框架和多品种背离仪表板指示器会在在多个时间框架上而不是在单个背离上识别出一个或两个不同的背离时发送警报。它可以用于从 M1 到 MN 的所有时间范围。仪表板中最多可以同时显示 9 个时间范围。可以启用移动平均线、RSI 或布林带趋势过滤器以仅过滤掉最强的设置。结合您自己的规则和技术,该指标将允许您创建(或增强)您自己的强大系统。 特征 可以检测以下振荡器/指标的背离:MACD、随机指标、OsMA、RSI、CCI、Awesome、OBV、ADX、ATR、MFI、动量和加速器。 最多可以选择 9 个要使用的时间范围。 在仪表板内持续执行发散等级排序。 通过在矩形内单击,将打开一个带有相关交易品种和时间范围的新图表。 指标可以将信号写入全局变量,智能交易系统可以使用这些变量进行自动交易。比如 这个产品 。 将指标放在一张图表上就足够了,您将收到来自您选择的任何交易品种的警报。 常规/经典(趋势逆转)和隐藏(趋势延续)背离都将被考虑在内。因此,可能会出现常规背离,同时在另一个时间范围内出现隐藏背离。请参阅下面的屏幕截图 #3。该示例显示了与 2 个指标的背离,但也可能来自同一个指标。
MA7 Galega MT5
Andrey Minaev
Description of work The MA7 Galega indicator is based on the standard Moving Average indicator. Shows a puncture of the moving average. Detailed information about the MA7 Galega indicator. Indicator settings General settings: Period ; Method ; Apply to ; Consider the direction of the candle . Message settings: Send message to the terminal (Alert) – permission to send messages to the terminal using the Alert function; Send message to the mobile terminal (Push) – permission to send messages to t
Day Trade System
Nardus Van Staden
5 (1)
Introducing The Day Trader System: Your Shortcut to Day Trading Success! Are you a day trader seeking simplicity without compromising profitability? Look no further! We present The Day Trader System – your go-to solution for identifying lucrative opportunities in the fast-paced world of Forex. Simple Yet Powerful: The Day Trader System is a straightforward yet highly effective indicator designed exclusively for day traders. Say goodbye to complexity and hello to a system that simplifies
FREE
Multi TimeFrame Moving Average MT5
Ahmed Alaaeldin Abdulrahman Ahmed Elherzawi
Unlock the power of the market with the Investment Castle Multi Time Frame Moving Average Indicator. Simplify your trading journey by easily identifying trends and pullbacks across multiple time frames on one convenient chart. This indicator is a must-have tool for any serious trader. Available for MT4 and MT5, and exclusively on the MQL5 market, customize your experience by adding as many indicators as you need on the chart, each with their own unique time frame or period.   Enhance your strat
Channel Scanner MT5
Reza Aghajanpour
5 (1)
**   All Symbols   x   All Timeframes   scan just by pressing scanner button ** *** Contact me  to send you instruction and add you in "Channel Scanner group" for sharing or seeing experiences with other users. Introduction: The Channel pattern is described as the area located between two trend lines. This area is used for a measure of a trading range. In this case, the upper trend line connects price highs while the lower trend line connects price lows. Also when it comes to breakout points, it
The Linear Regression Channel is a powerful technical analysis tool that helps visually identify the prevailing trend and potential price zones. Essentially, the indicator performs two main functions: It draws a trendline through the center of price action over a specified period. This line is calculated using the linear regression method, which results in the best possible "line of best fit" for the price data. From this center line, the indicator plots two parallel lines above and below, creat
FREE
!! FLASH SALE !!   Over 80% off !!     For ONE week only. Now only $47 - normally $297! >>>      Ends on 30 June 2023 - Don't miss it! Buy and Sell Arrows On The Chart According To Price Action Sends Alerts On MT5 To Your Phone To You Email Does NOT repaint. Works on any pair, any timeframe.     10 Activations allowed so you are free from limitations. MT4 Version here . For spreads from a tiny 0.1 pips RAW/ECN Accounts,  click here . Check out my Waka Esque EA signal here: >>   High Risk Se
停止猜测。停止繁琐计算。开始专业交易。 Risk Reward Tool 将 TradingView 直观的视觉体验带入您的 MetaTrader 图表。专业交易需要精确的风险管理,但使用 Excel 表格手动计算手数既缓慢又危险。 解决方案: 只需将视觉线拖动到您的入场、止损和止盈水平。该工具会 即时 计算您需要交易多少手数,以确切地控制您的特定风险金额(例如 50 美元)。 [   Get the MT4 Version Here   ]  核心功能 TradingView 视觉风格: 忘记枯燥的数字;用眼睛进行交易。直接在图表上拖动交互式的绿色(盈利)和红色(亏损)区域,在开仓前清晰地查看您的交易计划。 即时手数计算器 (Lot Size Calculator) : 所有数学运算都在后台完成。您输入风险(例如 100 美元),工具会告诉您:“在此设置上开 0.55 手以正好承担 100 美元的风险。” 智能品种检测 : 适用于所有品种,无需复杂设置: Forex (外汇): 自动将 5 位数报价计算为点 (Pips)。 Indices/Gold (指数/黄金): 自
Footprint MT5
Mahmoud Ahmed Abdou Ali
Footprint charts in MetaTrader 5 (MT5) provide traders with a detailed view of market activity, allowing for better analysis of price movements and trading decisions. What is a Footprint Chart? A footprint chart is a specialized visualization tool that displays market data beyond traditional candlestick or bar charts. It reveals how volume was distributed at each price level within a specific time frame, often segmented by bid and ask activity. This level of detail helps traders understand the
ADAM for FTMO 5
Vyacheslav Izvarin
5 (1)
ADAM EA Special Version for FTMO Please find new Version here  https://www.mql5.com/en/market/product/113326 Our 1st EA created using ChatGPT technology Trade only GOOD and checked PROP FIRMS  Default parameters for Challenge $100,000 Tested on EURUSD and GBPUSD only  Use 15MIN Time Frame Close all deals and Auto-trading  before Weekend at 12:00 GMT+3  Friday For Prop Firms MUST use special Protector  https://www.mql5.com/en/market/product/94362 -------------------------------------------------
SourcePoint是一个很好的中长线交易指示器,他能独立使用,也可以去其他趋势型指标独立使用,可以很好的指出最佳的buy和sell位置,指标不含有未来函数,不会重新绘制,不仅能够应用到自己的手动交易过程中,还能完全可以写入到自己的EA中。建议配合BS TrendLine( https://www.mql5.com/zh/market/product/96476?source=Site+Market+My+Products+Page ) 一起使用。 (如果你感觉到这个指标能够帮助你进行更准确的交易,请帮忙给个好评,希望我的作品能够帮助更多有需要的人) ===================参数列表===================== fastP: 12 slowP:26 avgP:9 =================参考使用方法=================== 此指标可以适用于任何交易品种,能够用在任何周期。 每次形成一个交点,就是一个交易机会,同时也是一个持仓平仓点位。建议配合大小周期一起使用,这样更容易让你找到更精准的入场位置和出场位置
HedgingMonitor: Visual Control for Hedging Operations HedgingMonitor: Professional Order Visualization for MT5 HedgingMonitor is a professional indicator for MetaTrader 5 that displays detailed information about all your open and pending orders in an organized and customizable visual panel. Ideal for traders who use hedging strategies or manage multiple orders simultaneously. Key Features: Intuitive Visual Interface: View all your orders in a single panel, with color coding to quickly identify b
Utilities
Douglas Lucio De Araujo
Indicator with 3 features - Clock : Clock independent of the chart, counting continues even when the market is closed. - Template : After setting up a configuration in any graphic, be it color patterns, indicators, zoom ... The configuration will be copied to all active graphics. - TimeFrame : Set the TimeFrame on a chart, and with just one click all the active charts will be changed to the same TimeFrame.
MSG Method Indicator
Stephanus Potgieter
Discover the MSG Method: Master the Major Session Gap for Consistent Forex Profits Unlock the power of the MSG Method – our proprietary Major Session Gap strategy designed to capture high-probability trades during key market session transitions. Developed by the T1 FX Team, this innovative approach leverages algorithmic precision to identify and exploit price gaps between major trading sessions (London, New York, and Tokyo). Why Choose the MSG Method? High-Probability Setups : Focuses on session
Sync In Many Ways MT5
Sa No Tsuyoshi Kokorozashi
Description This is a Utility tool for MT5 which will make our chart analysis task quite more efficient and save large amount of time. As for chart analysis, some are watching out several symbol simultaneously with single timeframe and others are trading only one single pair with   multi timeframe analysis. For both, a common troublesome issue is “scroll chart to look back” or “draw chart objects” in multi charts at the same time.  Especially for those who are trading with multi timeframe soluti
ClearArrows MT5
Pavel Krysanov
For any trader, the result of market analysis is the correct determination of entry and exit points from the market. The ClearArrows indicator does not display any unnecessary information that may distract or mislead the trader, but only the most important thing. The indicator is very easy to use, when a down arrow appears, you need to open a SELL deal, when an up arrow appears you need to open a BUY deal. The ClearArrows indicator, despite its outward simplicity, has a large analytical algori
Overview The Williams VIX Fix Indicator is a MetaTrader 5 tool designed to help traders identify potential market tops and bottoms. By analyzing price extremes relative to recent highs and lows, it highlights overbought and oversold conditions using two histograms displayed in a separate window. The indicator combines the Williams VIX Fix calculation with Bollinger Bands and percentile-based thresholds to provide clear signals for potential reversals.  Key Features Market Tops and Bottoms Market
News Clock
Victor Klenov
The professional browser of News and Trading Sessions is now available in MetaTrader 5. Now all the most important market information is collected on one dial! News located on the Time scale. Planning your working time has never been so easy and convenient ... The news scale can be switched a day, two, a week, a month forward or backward (see the details in the short video). All news updates in real time. Thanks to the built-in filters, you can configure the display of news by importance, cou
Correlation Master
Agus Santoso
5 (2)
博客: https://www.mql5.com/en/blogs/post/761835 MT4 版本: https://www.mql5.com/en/market/product/122732 MT5 版本: https://www.mql5.com/en/market/product/122733 CORRELATION MASTER:双倍货币对,一半风险 智能负相关性和自动对冲EA Correlation Master是一款自动化EA,利用货币对之间的负相关性策略。通过对相反货币对开立反向仓位(例如,买入欧元/美元,卖出美元/瑞郎),该EA旨在最大化利润,同时最小化风险。 凭借灵活的风险管理和多货币对设置,该EA非常适合需要智能自动对冲策略的交易者。 主要功能 自动负相关策略 针对反向波动的货币对建立买入和卖出仓位。 示例:欧元/美元(买入)↔ 美元/瑞士法郎(卖出) 多货币对支持 最多可同时支持 13 个货币对,包括: 欧元/美元/瑞士法郎、英镑/美元/日元、澳元/美元/加元等。 动态风险管理 盈利目标可设置: 全局 每套 每层 可固定交易手数
该系统擅长识别市场的短期逆转。 它基于对市场结构的机器学习研究,可以成为扫描市场或直接交易的绝佳工具。 一切都没有100%的胜率,但这个指标有时总是准确的。 当它认为反转会发生时,它会给蜡烛涂上特定的颜色,画一个箭头,然后提醒你是否购买或出售即将到来的蜡烛。 1. 简单的设置 A.在任何时间段拖放到任何图表上。 B.启用警报(可选) c.你就完了! 2. 视觉和音频警报 A.警报直接发送到您的手机 b.弹出发送到您的终端的警报 3. 多用途 A.股票、外汇、期权、期货 4. 灵活 A.适用于任何时间范围 重要提示:指标会在超过50%确定会发生某些事情时绘制箭头,但只有当它已经确定时,它才会通过改变蜡烛颜色,绘制箭头并提醒您来向您发出信号。 只有在这三件事都发生的时候才会发出信号。
!! FLASH SALE !!   Over 80% off !!     For ONE week only. Now only $47 - normally $297! >>>      Ends on 30 June 2023 - Don't miss it! Buy And Sell Signal Arrows On The Chart When The Price Is About To Reverse. Also Sends Alerts –On MT5 To Your Phone To Your Email. Does not repaint. Works on any pair, any timeframe.   (Just ajust the settings for your pair and timeframe.) 10 Activations allowed so you are free from limitations MT4 version here .   Spreads from 0.1pip RAW/ECN Accounts,   c
这个多时间框架和多品种指标扫描 Pin bar、晨星/晚星、吞没、镊子、三线罢工、内线和三角旗。 该指标也可用于单一图表模式。请在产品的     博客 。     结合您自己的规则和技术,该指标将允许您创建(或增强)您自己的强大系统。 特征 可以同时监控您的市场报价窗口中可见的所有交易品种。将该指标仅应用于一张图表,并立即监控整个市场。 监控从 M1 到 MN 的每个时间范围,并在识别出模式时向您发送实时警报(弹出、推送或邮件)。 可以使用 RSI 和布林带作为 pin bar、晨星/晚星 、吞没和镊子形态的 过滤器,以便正确识别潜在的逆转。 可以使用移动平均线作为主要趋势过滤器,使用 ADX 作为波动率过滤器。 该指示器包括一个交互式面板。当单击一个项目时,将打开一个带有相关代码和时间范围的新图表。 该指标可以将信号写入一个文件,EA 可以使用该文件进行自动交易。比如 这个产品 。 Pennant 和三角形扫描可识别高概率的突破模式。它通过识别强大的、对称的三角旗和三角形来做到这一点。这种模式在更高的时间范围内不会经常出现。但是当它发生时,这是一个非常高概率的设置。请参见     截
该产品的买家也购买
购买此指标即可免费获得我的专业交易管理器。 首先,值得强调的是,这个交易系统是一个非重绘、非重画和非滞后的指标,这使得它非常适合手动和机器人交易。 在线课程,手册和下载预设。 “智能趋势交易系统 MT5”是专为新手和经验丰富的交易者量身定制的综合交易解决方案。它结合了超过 10 个优质指标,具有 7 多个强大的交易策略,使其成为适用于各种市场条件的多功能选择。 趋势跟随策略:提供精确的入场和止损管理,以有效地跟随趋势。 反转策略:识别潜在的趋势反转,使交易者能够利用区域市场的机会。 剃头策略:专为快速准确的日内交易和短期交易而设计。 稳定性:所有指标都不会重绘、不会重画和不会滞后,确保可靠的信号。 定制:支持自定义策略,以满足个人交易偏好。超过 7 种策略和组合可帮助您找到最佳策略。 信号清晰度:提供箭头信号,以指示清晰的入场和退出点。 实时警报:通过交易进出警报使交易者保持了解。 深入分析:提供更高时间框架的趋势分析和实时交易监控。 自适应颜色编码:利用蜡烛颜色编码来显示成交量、趋势和反转蜡烛信号。通过蜡烛颜色分析市场方向。 “智能趋势交易系统 MT5”赋予交易者必要的工具,以便在
Divergence Bomber
Ihor Otkydach
4.89 (82)
购买该指标的每位用户将额外免费获得以下内容: 原创工具“Bomber Utility”,该工具会自动跟踪每一笔交易,设置止损和止盈点,并根据策略规则自动平仓; 适用于不同交易品种的指标设置文件(Set 文件); 三种不同风险模式下的 Bomber Utility 设置文件:“最低风险”、“平衡风险” 和 “观望策略”; 一套详细的 视频操作手册,帮助您快速完成安装、配置并开始使用本交易系统。 注意: 要获取以上所有赠品,请通过 MQL5 的私人消息系统联系卖家。 我为您介绍原创的自定义指标 “Divergence Bomber”(背离轰炸机),它是一套基于 MACD 背离交易策略 的“全功能”交易系统。 该技术指标的主要任务是识别 价格与 MACD 指标之间的背离,并发出交易信号(包括推送通知),指示未来价格可能的运动方向。平均而言,这些信号的准确率超过 98%。有关该指标如何工作的详细说明,请观看本页面上的视频演示。 该系统使用 止损订单 和 动态回撤平仓机制 来管理交易。 Divergence Bomber 指标的主要特点: 支持交易的品种: AUDCAD、AUDCHF、AUDSG
Entry In The Zone and SMC Multi Timeframe is a real-time market analysis tool developed based on Smart Money Concepts (SMC). It is designed to analyze market structure, price direction, reversal points, and key zones across multiple timeframes in a systematic way. The system displays Points of Interest (POI) and real-time No Repaint signals, with instant alerts when price reaches key zones or when signals occur within those zones. It functions as both an Indicator and a Signal System (2-in-1), c
FX Trend MT5 NG
Daniel Stein
5 (4)
FX Trend NG:新一代多市场趋势智能分析工具 概述 FX Trend NG 是一款专业的多时间周期趋势分析与市场监控工具,帮助您在几秒钟内全面了解市场结构。 无需在多个图表之间来回切换,您可以立即看到哪些品种处于趋势中、哪里动能正在减弱,以及哪些时间周期之间存在强烈共振。 限时发布优惠 – 仅需 $30(6个月) 或 $80 终身授权 即可拥有 FX Trend NG 。 已经是 Stein Investments 客户? -> 发送消息 以获取专属客户群访问权限。 需要帮助或安装指导? -> 请访问 Stein Investments 官方页面 。 1. FX Trend NG 的核心优势 三状态趋势逻辑 —— 不只是 Buy 或 Sell • 大多数指标仅显示两种状态:Buy 或 Sell。 • FX Trend NG 增加第三种状态: Fade 。 • Fade 表示趋势强度正在减弱,在完全反转之前提前发出信号。 这种结构化逻辑让您看到趋势变化过程,而不仅仅是简单方向信号。 多时间周期分析(M1 至 MN1) • 从短线交易到中长线交易全面覆盖。 • 快速识别趋势
Trend Screener Pro MT5
STE S.S.COMPANY
4.84 (101)
使用趋势筛选指标释放趋势交易的力量:由模糊逻辑和多货币系统提供支持的终极趋势交易解决方案! 使用趋势筛选器(由模糊逻辑提供支持的革命性趋势指标)提升您的趋势交易。 它是一个强大的趋势跟踪指标,结合了超过 13 种高级工具和功能以及 3 种交易策略,使其成为使您的 Metatrader 成为趋势分析器的多功能选择。 限时优惠:趋势筛选指标终身仅需 50 美元。 ( 原价 250$ ) (优惠延长) 体验趋势筛选器 100% 无需重新绘制的准确性,确保您的交易决策不受过去价格变化的影响。 释放多时间框架和多货币功能的多功能性,使您能够以无与伦比的信心在外汇、商品、加密货币和指数领域进行交易。 利用 Trend Screener 的综合策略套件增强您的交易: - 趋势跟踪策略和趋势延续策略 :趋势筛选器的趋势跟踪策略提供清晰的趋势延续信号,让您有效捕捉趋势走势并管理风险。 - 反转策略和早期入场点策略 :趋势筛选器的反转策略可检测市场方向的潜在变化,使您能够预测趋势反转并利用疲弱的市场趋势。通过早期入场点,您可以在潜在的趋势变化之前定位自己 获取可观的利润。 - 倒卖策略: 趋势筛选器的倒卖
ARIPoint
Temirlan Kdyrkhan
ARIPoint is a powerful trading companion designed to generate high-probability entry signals with dynamic TP/SL/DP levels based on volatility. Built-in performance tracking shows win/loss stats, PP1/PP2 hits, and success rates all updated live. Key Features: Buy/Sell signals with adaptive volatility bands Real-time TP/SL/DP levels based on ATR Built-in MA Filter with optional ATR/StdDev volatility Performance stats panel (Success, Profit/Loss, PP1/PP2) Alerts via popup, sound, push, or email Cu
FX Power MT5 NG
Daniel Stein
5 (31)
FX Power:分析货币强度,助您做出更明智的交易决策 概述 FX Power 是一款专业工具,帮助您全面了解主要货币和黄金在任何市场条件下的真实强度。通过识别强势货币用于买入,弱势货币用于卖出, FX Power 简化了交易决策,并帮助您发现高概率的交易机会。不论您是想跟随趋势还是通过极端的 Delta 值预测反转,这款工具都能完美适应您的交易风格。别再盲目交易——用 FX Power 让您的交易更加智慧。 1. 为什么 FX Power 对交易者极具价值 实时货币和黄金强度分析 • FX Power 实时计算并显示主要货币和黄金的相对强度,助您全面了解市场动态。 • 监控领先或落后资产,轻松识别值得交易的货币对。 全面的多时间框架视图 • 跟踪短期、中期和长期时间框架的货币和黄金强度,以便将您的交易策略与市场趋势保持一致。 • 无论是快进快出的短线交易还是更长期的投资策略, FX Power 都能为您提供所需的信息。 Delta 动态分析用于趋势和反转 • 极端 Delta 值常常预示反转机会,而平缓的 Delta 变化则确认趋势延续。 • 使用 Delta 分析,轻
Azimuth Pro
Ottaviano De Cicco
5 (4)
上市促销 Azimuth Pro 前100位买家特惠价 299 美元。最终价格为 499 美元。 散户与机构入场的区别不在于指标,而在于位置。 大多数交易者在任意价格水平入场,追逐动量或对滞后信号做出反应。机构投资者等待价格到达供需真正转换的结构性水平。 Azimuth Pro 自动映射这些水平:波段锚定VWAP、多时间框架结构线,以及仅在高概率位置出现的ABC形态。 Azimuth Pro 专为需要结构分析和智能自动化的专业交易者打造。 Azimuth 以外科手术般的精度映射市场结构,而Azimuth Pro增加了智能层:自动检测您的交易风格、智能配置的移动平均线,以及经过20年数据回测优化的参数。结果是专业级分析自动适应您的交易品种和时间框架。 这是我们Merkava Labs每天为自己和客户使用的指标。 PRO版本的独特之处 智能配置 Pro版本理解您的交易环境。将它放在EURUSD M15上,它知道您在做日内交易。放在BTCUSD H4上,它会调整为波段交易。无需手动调整。 自适应移动平均线 标准EMA有效。但ATR自适应StepMA(响应波动率)和动
RFI levels PRO MT5
Roman Podpora
5 (2)
该指标能够准确显示反转点和价格回落区域。     行业领军人物 。您能洞察新趋势的形成,并以最高的精准度做出决策,掌控每一笔交易。 VERSION MT4     -    与……结合时,展现其最大潜力     趋势线专业版   指标 该指标显示的内容: 新趋势开始时的反转结构和反转水平及其激活。 显示屏   获利了结   和   止损   风险回报比最低的水平     RR 1:2       。 具有智能减值逻辑的止损。 显示指定指标中两种趋势类型的反转形态。 指标: 根据     趋势线     (全球趋势变化) 潮流专业版     (趋势快速变化) 简单有效   扫描器   实时趋势(新增)。 多时间框架工具筛选。 展示   利润   在 LOGIC AI 信号之后。 以下列出今日走势积极的金融工具。(RB键) 能够为终端启用通知(警报)功能,并向移动设备推送通知。 逻辑人工智能     — 利用人工智能寻找最佳切入点。 只有在启用 MTF(多时间框架分析)模式时,该功能才可用。 兼容性。 当与趋势线指标结合使用时,该指标能发挥其最大潜力。 这     RFI LEVELS
Atomic Analyst MT5
Issam Kassas
4.07 (28)
首先值得强调的是,该交易指标是非重绘、非延迟的指标,这使其成为手动和机器人交易的理想选择。 用户手册:设置、输入和策略。 Atomic Analyst是一种PA价格行动指标,利用价格的力量和动量来寻找市场上更好的机会。配备了高级过滤器,可帮助去除噪音和假信号,并提高交易潜力。使用多层复杂的指标,Atomic Analyst扫描图表,并将复杂的数学计算转化为任何初学者都能理解并用来做出一致交易决策的简单信号和颜色。 “Atomic Analyst”是专为新手和经验丰富的交易者量身定制的综合交易解决方案。它将高级指标和一流功能融合为一体的交易策略,使其成为所有类型交易者的多功能选择。 日内交易和剥头皮策略:专为快速准确的日内交易和短期交易而设计。 日内和摆动交易策略:可用作追求价格大幅波动的日内和摆动交易者的可靠工具。 多货币和市场:凭借其可靠的精度,在不同的工具和市场上运作。 多个时间框架:可在多个时间框架上使用,性能良好。 稳定性:所有指标均不重绘、不重绘和不滞后,确保可靠的信号。 信号清晰度:提供箭头信号,用于清晰的入场和出场点。 实时警报:通过交易入场、SL和TP警报通知交易者
趋势线专业版 -     有助于了解市场真正转变的方向。该指标显示了真正的趋势反转点以及主要参与者重新入场的点位。 你看     BOS线路   无需复杂设置或不必要的干扰,即可在高时间框架内显示趋势变化和关键水平。信号不会重绘,并在K线收盘后仍保留在图表上。 MT4 版本   - 与 RFI LEVELS PRO 指示器结合使用时,可发挥其最大潜力 该指标显示的内容: 真正的转变   趋势线(BOS线) 一旦信号出现,它就始终有效!这与会重绘的指标有着重要的区别,后者可能会发出信号后又改变信号,从而导致资金损失。现在,您可以更精准、更准确地进入市场。此外,还有一个功能:在箭头出现后,K线会着色,直到达到目标价位(止盈)或出现反转信号为止。 重复条目   以及主要玩家的充值 为了提高寻找入场点时的视觉清晰度,我们创建了一个模块,该模块首先显示买入/卖出区域,并在该区域内寻找最佳入场点。此外,我们还加入了智能逻辑来管理止损位,该逻辑会随着时间的推移逐步降低止损位的大小,从而降低入场时的初始风险( 移动止损位 )。 信号强度水平     (BOS) 该指标采用三个显著性等级来衡量趋势变化
Grabber System MT5
Ihor Otkydach
4.82 (22)
向您介绍一款优秀的技术指标——Grabber,它是一套即开即用的“全包式”交易策略。 在一个代码中集成了强大的市场技术分析工具、交易信号(箭头)、提醒功能和推送通知。 每位购买该指标的用户还可免费获得以下内容: Grabber辅助工具:用于自动管理已开仓位 视频操作指南:逐步教学如何安装、设置和使用该指标进行交易 原创Set文件:可快速自动配置,帮助实现最佳交易效果 忘掉其他策略吧!只有Grabber能够真正激励你在交易中攀登新高峰! Grabber策略的主要特点: 交易周期:从M5到H4 适用资产:任意,但我推荐我亲自测试过的品种(GBPUSD、GBPCAD、GBPCHF、AUDCAD、AUDUSD、AUDSGD、AUDCHF、NZDUSD、NZDCAD、EURCAD、EURUSD、EURAUD、EURGBP、EURCHF、USDCAD、USDSGD) 交易时间:全天候 24/7 交易效果:我分享自己的真实交易结果,并在此教学如何操作: https://www.mql5.com/ru/market/product/134563?source=Site+Market+MT5+Indic
Quantum TrendPulse
Bogdan Ion Puscasu
5 (20)
介绍 Quantum TrendPulse   ,这是一款终极交易工具,它将 SuperTrend   、   RSI 和 Stochastic 的强大功能整合到一个综合指标中,以最大限度地发挥您的交易潜力。该指标专为追求精准和效率的交易者而设计,可帮助您自信地识别市场趋势、动量变化以及最佳进入和退出点。 主要特点: 超级趋势整合: 轻松跟随当前的市场趋势并乘上盈利浪潮。 RSI 精度: 检测超买和超卖水平,非常适合把握市场逆转时机,可用作 SuperTrend 的过滤器 随机精度: 利用随机振荡在波动的市场中寻找隐藏的机会, 用作超级趋势的过滤器 多时间范围分析: 从 M5 到 H1 或 H4,在不同时间范围内关注市场动态。 可定制的警报: 当您的自定义交易条件得到满足时收到通知,这样您就不会错过任何交易。 无论您是新手还是经验丰富的交易员,   Quantum TrendPulse 都能为您提供所需的优势,帮助您增强策略并自信地进行交易。借助这一强大的指标,将洞察力转化为利润 — 掌控您的交易! ***购买 Quantum TrendPulse,即可免费获得 Quantum Tr
首先,值得强调的是,这个交易工具是非重绘、非重画和非滞后的指标,非常适合专业交易。 在线课程,用户手册和演示。 智能价格行动概念指标是一个非常强大的工具,既适用于新手,也适用于经验丰富的交易者。它将超过20个有用的指标合并到一个指标中,结合了高级交易思想,如内圈交易员分析和智能资金概念交易策略。该指标侧重于智能资金概念,提供有关大型机构交易方式的见解,帮助预测它们的动向。 它在流动性分析方面尤其擅长,有助于理解机构的交易方式。它擅长预测市场趋势,并仔细分析价格波动。通过将您的交易与机构策略对齐,您可以更准确地预测市场走向。该指标多才多艺,擅长分析市场结构,识别重要的订单区块,并识别各种模式。 它擅长识别BOS和CHoCH等模式,理解动量的转变,并突出显示供需强劲的关键区域。它还擅长发现强大的不平衡,并分析价格创造更高高点或更低低点的模式。如果您使用斐波那契回撤工具,该指标可以满足您的需求。它还可以识别相等的高点和低点,分析不同的时间框架,并通过仪表板显示数据。 对于使用更高级策略的交易者,该指标提供了工具,如公平价值差指标和优惠和折扣区域的识别。它特别关注高时间框架订单区块,并
Entry Points Pro for MT5
Yury Orlov
4.48 (138)
这款指标用于 MT5,可提供准确的入场交易信号,且无重绘。 它可应用在任何金融资产:外汇、加密货币、贵金属、股票、指数。 它将提供极其精准的评估,并告诉您何时开仓和平仓的最佳时机。 观看 视频 (6:22),其中包含一个仅处理单一信号的示例,该信号即可值回指标购价! 大多数交易者在 Entry Points Pro 指标的帮助下,在第一个交易周内即改善了他们的交易结果。 订阅我们的 Telegram 群 ! Entry Points Pro 指标的益处。 入场信号无重绘 如果信号出现,并得到确认,则它不会再消失;不像是重绘指标,它会导致重大的财产损失,因为它们可以在显示信号后再将其删除。 无差错开仓 指标算法可令您找到入场交易(买入或卖出资产)的理想时机,从而提高每位交易者的成功率。 Entry Points Pro 可操作任何资产 它允许您在 MT5 平台上交易任何经纪商的加密货币、股票、贵金属、指数、大宗商品和货币。 提供任何方向的信号 Entry Points Pro 指标提供针对任意价格走势的入场交易信号 - 上涨、下跌或横盘(横向)。 最大盈利潜力 离场信号
Berma Bands
Muhammad Elbermawi
5 (8)
Berma 波段 (BBs) 指标对于寻求识别和利用市场趋势的交易者来说是一种有价值的工具。通过分析价格与 BBs 之间的关系,交易者可以辨别市场是处于趋势阶段还是区间波动阶段。 访问[ Berma Home Blog ] 了解更多信息。 Berma 带由三条不同的线组成:上 Berma 带、中 Berma 带和下 Berma 带。这些线围绕价格绘制,直观地表示价格相对于整体趋势的变动。这些带之间的距离可以洞察波动性和潜在的趋势逆转。 当 Berma Bands 线相互分离时,通常表明市场正在进入横盘或区间波动时期。这表明缺乏明确的方向性。交易者可能会发现在这些时期内很难识别趋势,因此可能需要等待更清晰的趋势出现。 当 Berma Bands 线汇聚成一条线时,通常表示趋势环境强劲。这种汇聚表明存在明显的方向性偏差,因为价格波动性足以随趋势而变化。交易者可能会发现在这些时期更容易识别潜在的入场点和出场点,因为趋势的势头可以提供有利的交易机会。然而,重要的是要注意整体趋势中的潜在回调或修正。 Berma 带根据价格蜡烛图与上带和下带的相互作用提供明确的买入和卖出信号。当价格蜡烛图首
每天,许多交易者都会遇到一个常见的挑战:价格似乎突破了关键水平,他们进场交易,然后市场反转,触发止损。这被称为假突破——价格短暂突破支撑或阻力水平后反转的走势。这些走势可能导致在实际价格方向明确之前就触发止损。 在技术分析中,这种现象通常被称为"流动性扫荡"(liquidity sweep)或"猎杀止损"(stop hunt)。 Mirage Trading System 是一款专为检测假突破形态而设计的指标。"Mirage"意为幻象——指的是市场中频繁出现的假突破形态。 虽然假突破可能让许多交易者措手不及,但 Mirage Trading System 旨在识别这些形态何时形成,并指示随后价格走势的潜在方向。 上市期间套餐 在上市期间,购买 Mirage Trading System 包含三款附加产品:Smart Trend Consensus MT5($39)、Price Volume Distribution MT5($69)和 EA Signal Template($100)。这些产品在此期间免费提供。购买后请联系我以获取它们。 附带指标和EA的安装指南   —   EA Si
Pointer Trend Switch — precision trend reversal indicator Pointer Trend Switch is a high-precision arrow indicator designed to detect key moments of trend reversal based on asymmetric price behavior within a selected range of bars. It identifies localized price impulses by analyzing how far price deviates from the opening level, helping traders find accurate entry points before a trend visibly shifts. This indicator is ideal for scalping, intraday strategies, and swing trading, and performs equa
Gold Sniper Scalper Pro
Ich Khiem Nguyen
3.63 (8)
Gold Sniper Scalper Pro 是一款专业的 MetaTrader 5 指标,旨在帮助交易者有效识别入场点并管理风险。 该指标提供全面的分析工具套件,包括信号检测系统、自动 Entry/SL/TP 管理、成交量分析和实时绩效统计。 系统使用指南   |   其他语言使用指南 主要功能 信号检测系统 指标基于 price action 分析和市场结构自动检测潜在入场点。当检测到交易机会时: - 图表上出现 BUY(绿色)或 SELL(红色)箭头 - K线被高亮显示以识别信号区域 - Entry/SL/TP 水平自动计算 信号仅在价格触及 Entry 水平时激活,有助于过滤未经市场确认的信号。 智能 Entry/SL/TP 管理 - Entry:价格触及入场水平时自动检测 - StopLoss:基于 ATR(Average True Range)动态计算 - Take Profit:基于 R-Multiple 的 4 个 TP 水平(TP1: 0.5R, TP2: 1R, TP3: 1.5R, TP4: 2R) - Trading Lines:在图表上显示带标签的 E
Transaction Speed MT5
Ivan Stefanov
5 (3)
当然,以下是翻译成中文(简体)的版本: 该指标标出市场中显现出 交易兴趣 的区域,并随后显示 订单积累区域 。它的工作方式类似于大规模的订单簿。 这是为 大资金 打造的指标,性能卓越。市场中有任何兴趣,你都能通过它清晰看到。 (这是一个 完全重写的自动化版本 —— 不再需要手动分析。) 交易速度 是一个全新的概念指标,它显示了市场上大订单 何时 、 何地 聚集,并揭示了其背后的意义。它可以在 非常早期 就检测到趋势的变化。 在外汇市场,所谓的“交易量”实际上是误导性的,因为那指的是价格在单位时间内的变化,因此真正的名称应是“交易速度”。 一切都取决于我们如何思考、如何行动、如何分析。 改变分析范式至关重要。 该指标完全重构了外汇市场上“交易量”的概念,用逻辑方式重新定义并应用,从而成为一个 独特而精准的工具 。 使用方法: 默认情况下,指标处于 自动模式 ,可独立用于任何时间周期。如果你希望切换到手动模式,只需点击 Auto / Manual Mode 按钮即可。 在 手动模式 下,所有计算从 2025年1月1日 开始。你可以根据需要更改该日期,以查看不同的分析结果。 最优数据周期
Advanced Supply Demand MT5
Bernhard Schweigert
4.5 (14)
任何新手或专业交易者的最佳解决方案! 该指标是一款独特、高质量、且价格合理的交易工具,因为我们已经整合了许多专有功能和新公式。 依据此更新,您将能够显示双重时间帧区域。 您不仅可以显示一个较高的时间帧,还可以同时显示图表时间帧,加上更高的时间帧:显示嵌套时区。 供需双方所有交易者都会喜欢它。 :) 重要信息披露 高级供需的最大潜力,请访问 https://www.mql5.com/zh/blogs/post/720245   想象您的交易如何得以改善,是因为您能够精准定位入场或目标位吗? 构建于新的底层算法,它可以更轻松地识别出买卖双方之间的潜在失衡。 这是因为它以图形方式展示供需最强劲区域,及其过去的表现(显示旧区域)。 这些功能旨在帮助您更轻松地发现最佳入场区域和价位。 现在您可以针对您的交易品种和时间帧来优化和编辑区域强度! 高级供需指标适用于所有产品和时间帧。 它是一个新的公式,非常新的功能是两个区域强度函数可由用户输入进行调整! 这在交易中是一大优势。 当您学习如何使用专有功能,例如带有价格游离最小 X 因子的区域强度时,您能够判断该区域强劲与否。 供需区域用作警报触发器。
PZ Swing Trading MT5
PZ TRADING SLU
5 (5)
Swing Trading 是第一个旨在检测趋势方向的波动和可能的反转波动的指标。它使用在交易文献中广泛描述的基准摆动交易方法。该指标研究多个价格和时间向量,以追踪总体趋势方向,并检测市场超卖或超买并准备好进行修正的情况。 [ 安装指南 | 更新指南 | 故障排除 | 常见问题 | 所有产品 ] 市场波动的利润不会被窃取 指示器始终显示趋势方向 彩色价格带代表机会基准 彩色虚线表示可能的反转波动 该指标分析其自身的质量和性能 它实现了一个多时间仪表板 可定制的趋势和波动周期 它实现了电子邮件/声音/推送警报 指示器为非重涂或重涂 什么是摇摆交易 摇摆交易是一种尝试在一天到一周内从证券中获得收益的交易方式,尽管某些交易最终可以保持更长的寿命。摇摆交易者使用技术分析来买入弱点和卖出力量,并有耐心等待这些机会的发生,因为在发生一波抛售浪潮之后购买证券而不是陷入抛售更有意义。 机会基准 关于历史数据的大量研究证明,适合于波动交易的市场倾向于在基线价格带上下交易,基线价格带由图表显示,使用平均真实区间计算得出。波动交易者使用基线,该策略是购买常态和卖出躁狂,或做空常态并掩盖沮丧。在没有疲
Candle Smart Range
Gianny Alexander Lugo Sanchez
Candle Smart Range (CSR) MetaTrader 5 指标 Candle Smart Range 是一款用于自动识别多时段价格区间的技术指标。该工具基于蜡烛形态以及价格与先前高低点的交互来分析市场结构。 主要功能: 区间检测: 自动识别脉冲行情前的盘整区域。 虚假突破识别: 根据蜡烛收盘标准,标记价格突破先前水平但收于区间内的情况。 多时段分析: 在单个图表上显示多达 19 个不同时段的数据,包括自定义周期。 内部可视化(缩放): 无需切换图表即可查看高级别蜡烛或区间内部的价格走势。 时间过滤器: 可设置在特定时间段(如主要市场交易时段)运行。 历史回顾模式: 逐步浏览历史数据,分析指标在不同市场条件下的表现。 警报系统: 针对蜡烛收盘和新区间检测的可配置通知。 界面: 包含用于管理视觉负载的屏幕按钮和可调配色方案。 免责声明: 本工具仅用于视觉分析,不保证财务结果。历史表现不代表未来收益。
TrendMaestro5
Stefano Frisetti
note: this indicator is for METATRADER4, if you want the version for METATRADER5 this is the link:  https://www.mql5.com/it/market/product/108106 TRENDMAESTRO ver 2.5 TRENDMAESTRO recognizes a new TREND from the start, he never makes mistakes. The certainty of identifying a new TREND is priceless. DESCRIPTION TRENDMAESTRO identifies a new TREND in the bud, this indicator examines the volatility, volumes and momentum to identify the moment in which there is an explosion of one or more of these da
PZ Divergence Trading MT5
PZ TRADING SLU
3.71 (7)
棘手的发现和频率稀缺是最可靠的交易方案之一。该指标使用您喜欢的振荡器自动查找并扫描常规和隐藏的发散。 [ 安装指南 | 更新指南 | 故障排除 | 常见问题 | 所有产品 ] 容易交易 发现常规和隐藏的分歧 支持许多知名的振荡器 根据突破实现交易信号 显示适当的止损和获利水平 可配置的振荡器参数 可自定义的颜色和尺寸 按条形过滤大小差异 实现绩效统计 它实现了电子邮件/声音/视觉警报 为了提供广阔的市场前景,可以使用不同的振荡器在同一张图表中多次加载该指标,而不会产生干扰。该指标支持以下振荡器: RSI CCI MACD OSMA 随机 动量 很棒的振荡器 加速器振荡器 威廉姆斯百分比范围 相对活力指数 由于差异可能会扩大很多,尤其是在外汇市场中,因此该指标产生了转折:它在等待交易突破之前等待donchian突破确认差异。最终结果是带有非常可靠的交易信号的重新粉刷指示器。 输入参数 幅度:用于寻找差异的之字形周期 振荡器-选择要加载到图表的振荡器。 突破期-交易信号的突破期,以柱为单位。 发散类型-启用或禁用发散类型:隐藏,常规或两者。 最小散度单位为条形-最小散度单位为条形
Trend indicator AI mt5
Ramil Minniakhmetov
5 (15)
趋势人工智能指标是一个伟大的工具,将加强交易者的市场分析结合趋势识别与可操作的进入点和逆转警报。 该指标使用户能够自信和精确地驾驭外汇市场的复杂性 除了主要信号,趋势Ai指标识别在回调或回调期间出现的次要入口点,使交易者能够利用既定趋势内的价格修正。 重要优势: *MT4及MT5工程 *明确买入或卖出信号 ·不重绘 *适用于所有资产 小心我不卖EA或设置电报它骗局. 所有设置免费在这里的博客。  重要! 购买后立即与我联系,以获得指示和奖金! 真实的操作监控以及我的其他产品可以在这里找到: https://www.mql5.com/en/users/mechanic/seller&nbsp ; 设置和输入: 建议为所有资源设置默认设置。 第...
FX Volume MT5
Daniel Stein
4.79 (24)
FX Volume:从经纪商视角洞察真实市场情绪 简要概述 想要提升您的交易策略? FX Volume 可提供零售交易者和经纪商的持仓实时数据——远早于诸如 COT 之类的延迟报告。不论您希望获得持续稳定的收益,还是想在市场中多一分制胜的砝码, FX Volume 都能帮您识别重大失衡、确认突破以及完善风险管理。立即开启体验,让真实的成交量数据为您的交易决策带来革新! 1. 为什么 FX Volume 对交易者格外有用 极具准确度的早期预警 • 快速捕捉有多少交易者正在买入或卖出某个货币对——比大多数人提前一步。 • FX Volume 是 唯一 能够整合多家零售经纪商真实成交量数据并以简洁方式呈现的工具。 强力风险管理 • 及时识别多头或空头仓位的巨大不平衡,这往往预示着潜在的趋势反转,帮助您更自信地设置止损和目标位。 • 独家而真实的数据让每一次交易决策更具可靠性。 优化进场与出场点 • 发现“过度集中”的交易(大多数交易者都在同一方向),并通过真实成交量来确认突破。 • 避免依赖常见指标可能带来的误导信号,而是利用真实的实时成交量。 适配各种交易策略 • 将 FX
Native Channels
BeeXXI Corporation
5 (1)
This indicator recognizes all support and resistance levels. A number of unique high-performance techniques have been applied, which made the existence of this indicator possible. All formed channels are naturally visible: horizontal linear linear parabolic cubic (Polynomial 3 degrees - Wave) This is due to a bundle of approximating channels. The formed channels form "standing waves" in a hierarchical sequence. Thus, all support and resistance levels are visible. All parameter management is i
Trend Forecaster
Alexey Minkov
5 (7)
The Trend Forecaster indicator utilizes a unique proprietary algorithm to determine entry points for a breakout trading strategy. The indicator identifies price clusters, analyzes price movement near levels, and provides a signal when the price breaks through a level. The Trend Forecaster indicator is suitable for all financial assets, including currencies (Forex), metals, stocks, indices, and cryptocurrencies. You can also adjust the indicator to work on any time frames, although it is recommen
“ Dynamic Scalper System MT5 ”指标专为在趋势波内进行剥头皮交易而设计。 已在主要货币对和黄金上进行测试,并可与其他交易工具兼容。 提供顺势短线建仓信号,并提供额外的价格变动支持。 指标原理: 大箭头决定趋势方向。 在趋势波内,我们采用一种生成小箭头形式的剥头皮交易信号的算法。 红色箭头代表看涨方向,蓝色箭头代表看跌方向。 敏感的价格变动线会沿着趋势方向绘制,并与小箭头信号协同作用。 信号运作方式如下:当线在适当时刻出现时,将形成入场信号;在出现线时,持仓;线完成后,平仓。 建议的操作时间范围为M1 - H4。 箭头在当前K线上方形成,如果下一根K线已开仓,则不会重新绘制上一根K线上方的箭头。 输入参数 Trend Wave Period - 趋势方向(大箭头)的周期,改变趋势波的时间间隔。值 1 表示趋势方向的最长持续时间,参数值越大,持续时间越短。 Scalper Arrows Period - 信号箭头(小箭头)的计算周期,改变入场信号的生成频率。值 3 表示最频繁的生成频率,参数值越大,箭头频率越低,准确度越高。 这些参数可以根据不同
作者的更多信息
Pivot Prof MT4
Paul Anscombe
4.92 (85)
Pivot Prof
Paul Anscombe
4.91 (35)
Ulimate MTF Support & Resistance - 5 Star Best Seller  New Year Sale - save $20    (normal price $79) Beginner or Professional our best selling multi-timeframe Pivot Prof will enhance your trading and bring you great trade opportunities with the Support and Resistance levels that professionals use. Pivot trading is a simple effective method for entering and exiting the market at key levels and has been used by professionals for decades and works on all symbols: Forex, Crypto, Stocks, Indicies et
Mega Dashboard MT4
Paul Anscombe
4.71 (7)
The Ultimate Dashboard New Year Sale - save $20 (normal price $79) Indicators are useful for traders, but when you put them into a dashboard that can scan 28 symbols at once they become even better, and when you can also combine different indicators and timeframes to give you synchronized alerts, then they become awesome. This easy to use dashboard provides you with 23 leading indicators, use them individually or together, to create powerful combination alerts. So when you want to know that RS
筛选:
Sebastian Podeswa
332
Sebastian Podeswa 2025.03.31 17:31 
 

A big thank you to the developer. He implemented my request almost immediately. Everything works flawlessly; the modular concept is fantastic; it couldn't be better. I think this dashboard allows you to quickly get an overview of almost any strategy, which saves a tremendous amount of time. And the support is perfect. Thanks, Paul.

Adz trading
154
Adz trading 2024.11.12 18:20 
 

用户没有留下任何评级信息

Max
1619
Max 2024.07.14 15:04 
 

This is a brilliant tool. Its clever design is easy to use, and set up custom to your needs. I like it and it’s really helpful to me. It was very important to be able to select my own timeframes and symbols so this was the magic answer, feature seems pretty unique on the market and wish i had bought it sooner! Many strategies can be implemented. The manual is very good and explains it, must be read. Same as others, i recommend.

sabah2001
998
sabah2001 2023.10.18 02:21 
 

I purchased both mega dash for MT4 and MT5 platform. If you have good strategies , you can set up your template easly by mega dash .. If you know what your are looking for , Mega Dash will help you . I recommend it every trader..

jpp75purdue
59
jpp75purdue 2023.02.05 06:32 
 

very easy setup, very customizable, easy on the eyes interface; a great technical toolbox every trader should have

回复评论