Digitized Candle Length MT4
- 指标
- 版本: 1.23
- 更新: 8 十二月 2018
- 激活: 5

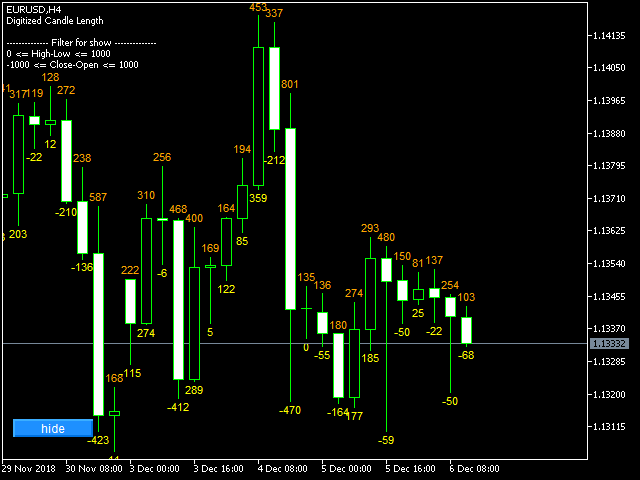
该指标用于指示K线的最高价与最低价之差,以及收盘价与开盘价之差的数值,这样交易者能直观地看到K线的长度。
上方的数字是High-Low的差值,下方数字是Close-Open的差值。
该指标提供过滤功能,用户可以只选出符合条件的K线,例如阳线或者阴线。
----------------------------------------------------------------
该指标用于指示K线的最高价与最低价之差,以及收盘价与开盘价之差的数值,这样交易者能直观地看到K线的长度。
上方的数字是High-Low的差值,下方数字是Close-Open的差值。
该指标提供过滤功能,用户可以只选出符合条件的K线,例如阳线或者阴线。
----------------------------------------------------------------
上方的数字是High-Low的差值,下方数字是Close-Open的差值。
该指标提供过滤功能,用户可以只选出符合条件的K线,例如阳线或者阴线。
----------------------------------------------------------------
该指标用于指示K线的最高价与最低价之差,以及收盘价与开盘价之差的数值,这样交易者能直观地看到K线的长度。
上方的数字是High-Low的差值,下方数字是Close-Open的差值。
该指标提供过滤功能,用户可以只选出符合条件的K线,例如阳线或者阴线。
----------------------------------------------------------------