Lows And Highs MT4

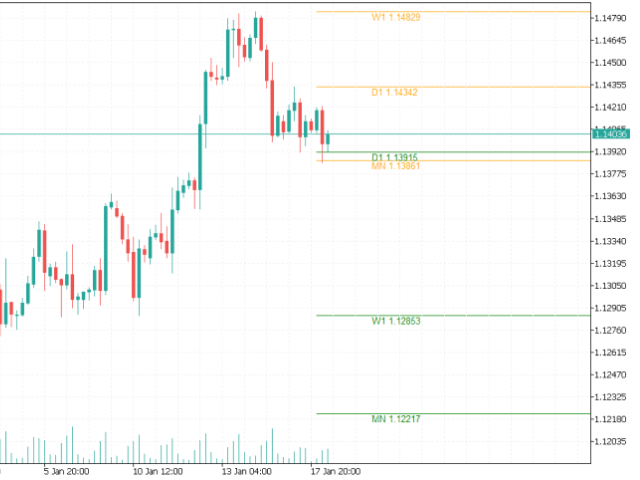
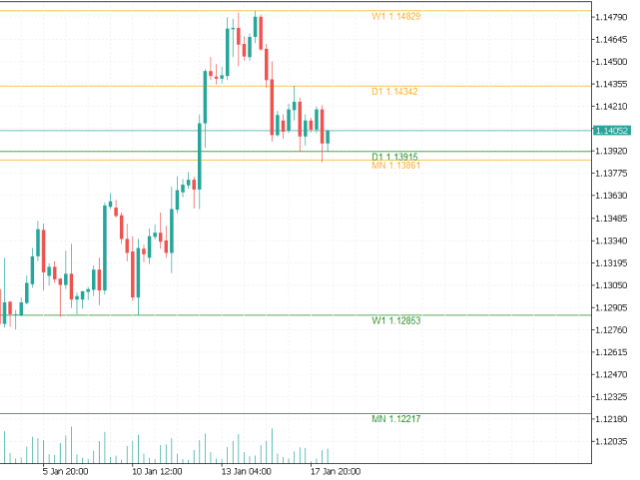
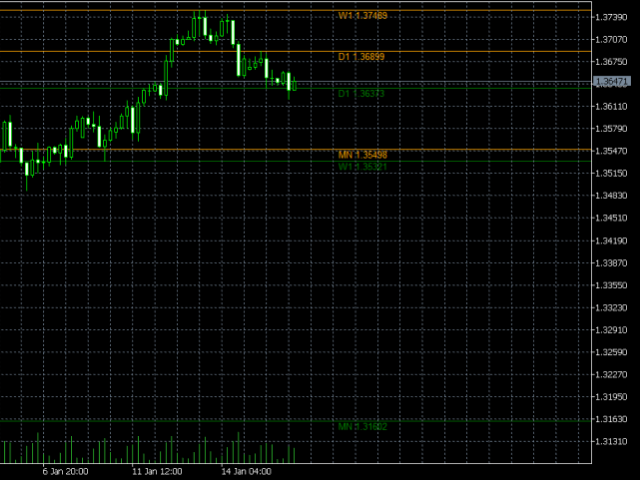
This indicator draws on the chart high and low prices of different periods . And If you want, Indicator can alert you when the current price arrive these levels.

Alert Options: Send Mobil Message, Send E-mail, Show Message, Sound Alert

Time Periods: M1, M5, M15, M30, H1, H4, D1, W1, MN
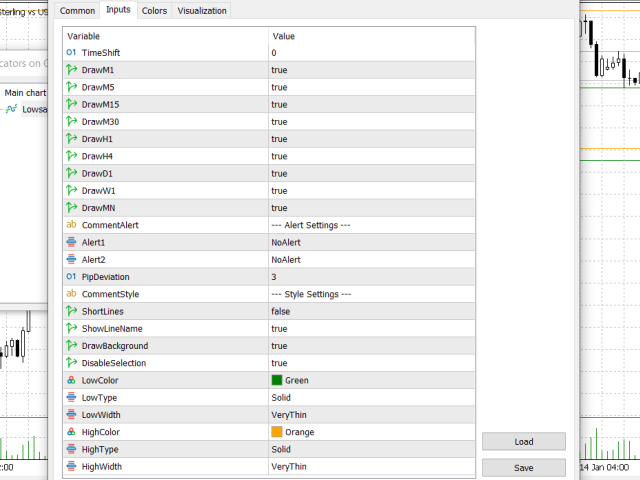
Inputs: 

  • TimeShift: You can set start hour for calculating. And that way you can see levels independently from broker server's time-zone.
  • PipDeviation: You can set price sensibility for alert (Default: 3)
  • Lines: You can chose short line or horizontal line for showing prices
  • Style: You can change line's style (Color, Width, Type)


推荐产品
Forex trading support timer: - This is an indicator that supports a trader's trading process. - Before placing a BUY or SELL order, it is advisable to observe what the current time is like, to get the best position when trading. Function of indicator: - Display information about candle closing time of different timeframes (M1,M5,M15,H1), best used when Scalping. - Show market spreads. - Show TimeZone Trading. - Displays the remaining time of a session.
FREE
Umagads Candle Timer MT4:纪律交易者的专业精准计时工具 在快速波动的交易市场中,精确掌握蜡烛图的收盘时间是区分成功交易与错失机会的关键。 Umagads Candle Timer MT4 是一款专为追求卓越执行力的交易者设计的高效实用程序。无论您是进行 M1 的超短线头寸交易,还是在日线图上进行波段交易,此工具都能为您提供所需的实时数据。 核心功能详情: 智能时间显示: 系统会根据当前周期自动调整格式。在内盘交易(M1-M30)中显示“分:秒”,而在小时图或更高周期中提供更详细的时分秒显示。 视觉紧急系统: 当蜡烛图进入最后 10 秒倒计时,计时器颜色会变为橙色。这种视觉线索能帮助交易者在关键时刻保持高度集中。 动态位置调整: 计时器可以漂浮在价格线旁边,也可以固定在图表的四个角落。我们优化了 MT4 的坐标算法,确保即使在屏幕边缘,文字显示也清晰完整。 全面警报覆盖: 支持桌面弹窗、手机推送(iOS/Android)和电子邮件警报。您可以自定义提前预警时间,默认设置为收盘前 30 秒。
FREE
-- 简单而有效。 反转指标 - 是什么? 一种结合超级趋势逻辑与指数曲线技术的趋势跟随叠加指标。它能识别趋势方向,在图表上绘制动态通道,并在趋势反转时发送实时警报。 工作原理 该指标通过ATR与超级趋势因子计算指数基准线。当价格收盘突破该基准线时,确认趋势反转。绿色箭头标记买入趋势启动,红色箭头标记卖出趋势启动。 功能特性: 基于ATR的指数趋势基准线与动态通道 绿色/红色趋势线及填充通道 趋势反转时的买入/卖出箭头信号 内置警报:弹窗、推送通知、邮件、声音 重复警报防护(每根K线仅触发一次警报) 完全可定制:颜色、线条粗细、箭头尺寸、通道宽度 无延迟的简洁图表叠加层 输入参数: 指数速率、超级趋势因子、ATR周期、通道宽度 开关控制:通道填充、箭头、各警报类型 所有视觉元素支持全色系定制 最佳适用场景:任意品种、任意周期。适用于外汇、指数、大宗商品及加密货币图表。
FREE
Master the Markets with Auto Trading Sessions V1.8E Stop guessing when to enter the market and start trading with institutional precision. The Auto Trading Sessions V1.8E | Global Market Hub is an all-in-one technical powerhouse designed to turn price action into actionable intelligence across Forex, Crypto, and Stocks. Why Traders Choose V1.8E: Global Session Mapping: Automatically visualizes the Asia, London, and New York sessions with clear, color-coded zones, allowing you to capitalize on se
FREE
Bar Timer Lite
DENIS SITDIKOV
5 (3)
The indicator informs when the current bar closes and a new bar opens. TIME is an important element of trading systems. BarTimerPro indicator helps you CONTROL THE TIME . Easy to use: place on the chart and set “alarms” if it necessary. In the tester, the indicator does not work. Key Features Shows the time elapsed since the opening of the current bar Indicator Updates Every Second  Setting the appearance (31-36) and the location (21-24) of the indicator, changing all texts (41-50). 4 types of “
FREE
Heikin Ashi Smoothed – MT4指标 Heikin Ashi Smoothed 是一款适用于 MetaTrader 4 (MT4) 的自定义指标,在传统的平均线蜡烛图基础上,通过加入额外的移动平均平滑处理,让趋势显示更加平滑直观。该方法极大减少了图表噪音,使得主趋势和可能的反转信号更加清晰,有助于把握市场方向。 主要特点 在图表上显示经过进一步平滑处理的 Heikin Ashi(平均足)K线,更清晰地反映价格走势 有效过滤小幅波动与虚假信号,趋势一目了然 更容易识别趋势反转,帮助避免因市场噪音导致的多余交易 适用于所有时间周期和任何品种(包括外汇、CFD、指数等) 计算轻巧高效,可在多图表、多周期下流畅运行 原理说明 Heikin Ashi Smoothed 首先计算标准的平均足四价(开盘、高点、低点、收盘),然后在此基础上再应用移动平均(如SMA或EMA)进行二次平滑处理。最终在图表上展现出极其平滑的K线,使细小波动被最大限度压制,主趋势方向更加明显。 通过不同的颜色和形状,趋势方向和强度一目了然,有助于持仓信心和避免因短期回调而频繁操作。 适用对象 采用趋势跟随
FREE
Power of Three
Suvashish Halder
4.67 (3)
The "Power of Three" (PO3) is a concept developed by the Inner Circle Trader (ICT) to illustrate a three-stage approach used by smart money in the markets: Accumulation, Manipulation, and Distribution . ICT traders view this as a foundational pattern that can explain the formation of any candle on a price chart. In simple terms, this concept is effective for any time frame, as long as there's a defined start, highest point, lowest point, and end. MT5 -  https://www.mql5.com/en/market/product/124
FREE
LT Force MT4
Thiago Duarte
For those who like trend the Force will be a very useful indicator. This is because it is based on the famouse ADX, which measure the strenght of a trend, but without its 3 confusing lines. Force has its very simple interpretation: if the histogram is above zero level the trend is up, otherwise it is down. You can use it to find divergences too, which is very profitable. If you have any doubt or suggestion, please, contact me. Enjoy! MT5 version:  https://www.mql5.com/en/market/product/41928 T
FREE
Super Ichi
Sinan Durkan
What is the Super Ichi Indicator? Super Ichi is an advanced combination of Ichimoku Kinko Hyo and SuperTrend indicators. This powerful technical analysis tool is designed to identify market trends and generate trading signals. What Does It Do? Dual-Level Trend Analysis : Uses customized versions of Tenkan-sen and Kijun-sen lines Automatic Signal Generation : Displays visual markers (arrows) at crossover points Real-Time Alert System : Provides audio and visual alerts when new signals occur Dynam
FREE
NotifyMaCross
Mr Ittiphol Pudkrajang
4 (2)
Moving average cross over notification ! How to use Add NotifyMaCross indicator into the chart. Set Moving average line one and two. Wait the notification when moving average cross over Support for development : https://www.buymeacoffee.com/itwetrade Check out all indicator and expert advisor here https://www.mql5.com/en/users/thanksmybot/seller ------------------------------------- Como usar     Adicione o indicador NotifyMaCross ao gráfico.     Defina a linha média móvel um e dois.     Agua
FREE
This simple indicator paints with a darker color on the volume bar when the quantity traded is above the average of select number of periods of the volume itself, highlighting the moments when there was a large volume of deals above the average. It is also possible to use a configuration of four colors where the color tone shows a candle volume strength. The indicator defaults to the simple average of 20 periods, but it is possible to change to other types of averages and periods. If you like t
FREE
Email Drawdown Alert
Roman Starostin
5 (12)
Free informative Indicator-helper. It'll be usefull for traders who trade many symbols or using grid systems (Averaging or Martingale). Indicator counts drawdown as percent and currency separate. It has a number of settings: Count deposite drawdown according equity value and send e-mail or notifications to user if DD more than set; Sending e-mail when max open orders reached; Shows price and remaining pips amount before MarginCall on current chart and Account generally; Display summary trade lot
FREE
Super Auto Fibonacci
Muhammed Emin Ugur
Discover the power of precision and efficiency in your trading with the " Super Auto Fibonacci " MT4 indicator. This cutting-edge tool is meticulously designed to enhance your technical analysis, providing you with invaluable insights to make informed trading decisions. Key Features: Automated Fibonacci Analysis: Say goodbye to the hassle of manual Fibonacci retracement and extension drawing. "Super Auto Fibonacci" instantly identifies and plots Fibonacci levels on your MT4 chart, saving you tim
FREE
交易实用必备工具指标 波浪自动计算指标,通道趋势交易 完美的趋势-波浪自动计算通道计算 , MT4版本 完美的趋势-波浪自动计算通道计算 , MT5版本 本地跟单复制交易 Easy And Fast Copy , MT4版本 Easy And Fast Copy , MT5版本 本地跟单复制交易 模拟试用 Easy And Fast Copy , MT4 模拟账号运行 Easy And Fast Copy , MT5 模拟账号运行 顺势指标又叫CCI指标,CCI指标是 美国 股市 技术分析   家唐纳德·蓝伯特(Donald Lambert)于20世纪80年代提出的,专门测量股价、外汇或者贵 金属 交易是否已超出常态分布范围。属于超买超卖类指标中较特殊的一种。波动于正无穷大和负无穷大之间。但是,又不需要以0为中轴线,这一点也和波动于正无穷大和负无穷大的指标不同。 相对强弱指标RSI是根据一定时期内上涨点数和下跌点数之和的比率制作出的一种技术曲线。能够反映出市场在一定时期内的景气程度。由威尔斯.威尔德(Welles Wilder)最早应用于期货买卖,后来人们发现在众多的图表技术分析中,
FREE
Ichimoku wave
Bardia Mohammadi
For all those traders interested or currently trading Ichimoku, you will not want to miss this article. Although I am heading out in a few hours with my girlfriend to Harbin Hot Springs, I wanted to write a brief introduction to   Ichimoku Number Theory   as there has been a lot of questions (and confusion) about Ichimoku settings, time frames, etc. The basis of Ichimoku as known to most is the 5 lines; Tenkan Line Kijun Line Senkou Span A (part of the Kumo) Senkou Span B (other part of the Kum
FREE
TradeDashboard
Cihan Akduman
TradeDashboard Comprehensive MT4 Indicator for Trade Visualization and Analysis Overview TradeDashboard is a powerful MetaTrader 4 indicator designed to enhance your trading experience by providing real-time visualization of take-profit levels for all open positions. This advanced tool goes beyond basic TP indicators by displaying comprehensive metrics including potential profits, losses, and total lot sizes, all directly on your chart. Key Features Take-Profit Visualization : Clearly displays h
FREE
Virtual Targets
Hoang Van Dien
3.83 (6)
This indicator is very useful for day traders or short term traders. No need to calculate the number of pips manually, just look at the chart and you will see the Virtual Take Profit / Virtual Stop Loss target line and evaluate whether the entry point is feasible to reach the intended target or not. Enter the intended Take Profit / Stop Loss pips for your trade. The indicator will display Virtual Take Profit / Virtual Stop Loss lines for you to easily see if the target is feasible or not.
FREE
该智能交易系统不进行任何交易,但它会扫描您的市场观察中的整个交易品种,并在不同的时间范围内逐一扫描每个股票,最后它会向您显示哪个交易品种在哪个时间范围内具有强大的吞没蜡烛。 此外,您可以定义 MA 周期和 RSI 上限和下限,它会显示哪个时间范围内的交易品种将穿越调整后的移动平均线,以及哪个时间范围内的交易品种将穿越移动平均线的上限或下限。 相对强弱指数。 Gāi zhìnéng jiāoyì xìtǒng bù jìnxíng rènhé jiāoyì, dàn tā huì sǎomiáo nín de shìchǎng guānchá zhōng de zhěnggè jiāoyì pǐnzhǒng, bìng zài bùtóng de shíjiān fànwéi nèi zhúyī sǎomiáo měi gè gǔpiào, zuìhòu tā huì xiàng nín xiǎnshì nǎge jiāoyì pǐnzhǒng zài nǎge shíjiān fànwéi nèi jùyǒu qiángdà de tūnmò làzhú. Cǐwài, nín
FREE
QuantumAlert Stoch Navigator is a free indicator available for MT4/MT5 platforms, its work is to provide "alerts" when the market is inside "overbought and oversold" regions in the form of "buy or sell" signals. This indicator comes with many customization options mentioned in the parameter section below, user can customise these parameters as needful. Join our   MQL5 group , where we share important news and updates. You are also welcome to join our private channel as well, contact me for the p
FREE
WikiRobo MT4
Hossein Ahmadi Beni
介绍 Wikirobo — 支持所有周期的智能进场区间指标。 Wikirobo 会自动在所有时间框架上以 买入限价(Buy Limit) 和 卖出限价(Sell Limit) 的形式显示潜在进场点。 你可以等待价格触及建议的进场区间,观察价格是否在该区间反应或反转,然后根据自己的策略确认后再入场。 每个时间框架都会显示对应的 止损(Stop Loss) ,帮助你更好地管理风险和仓位。 该工具适用于剥头皮交易者、日内交易者和波段交易者,不论你的交易风格是什么。 使用 Wikirobo 时,只需 加入我们的 Telegram 频道 并下载最新数据文件: @wikirobo 让指标为你指引 — 但策略由你决定。 Wikirobo:聪明的信号,更聪明的交易者。
FREE
MT Scanner
Niravkumar Maganbhai Patel
4 (2)
This indicator helps you to Scan symbols which are in the Market Watch Window  and filter out trends with alerts. It works based on the effective indicator "SUPERTREND" which is used by many traders for trading: When box color changes to " Green " or " Red " color, it indicates you for trend change for long and short entry. And also you will get alerted on screen. When it changes to " Green ", it indicates you that trend is going upwards, and you can take the long entry. If the color changes to
FREE
Limited-time free release: Market Structure BOS CHOCH Signals is free while MetaCoderStore collects real trader feedback. Please leave a comment if you want extra filters, alert styles, or scanner behavior in the next update. Market Structure BOS CHOCH Signals marks structural continuation breaks and change-of-character reversal breaks directly on the chart, then exposes stable buffers for EAs and dashboards. Use cases Identify bullish or bearish break of structure after confirmed swing highs an
FREE
The indicator allows you to trade binary options. The recommended time frame is М1 and the expiration time is 1 minute. The indicator suitable for auto and manual trading. A possible signal is specified as a arrows above/under a candle. You should wait until the candle closes! Arrows are not re-painted Trade sessions: LONDON and NEWYORK section Currency pairs: GRB/USD Working time frame: M1 Expiration time: 1 minute. The indicator also shows good results when using the martingale strategy - "Mar
FREE
Upper and Lower Trendline
David Muriithi
5 (2)
This indicator uses a different approach from the previous version to get it's trendlines. This method is derived from Orchard Forex, and the process of making the indicator is demonstrated in there video   https://www.youtube.com/watch?v=mEaiurw56wY&t=1425s . The basic idea behind this indicator is it draws a   tangent line   on the highest levels and lowest levels of the bars used for calculation, while ensuring that the lines don't intersect with the bars in review (alittle confusing? I know
FREE
MA Crosses Show
Faran Ataeiraveshti
Hello.  Another free indicator from Sepehr! ;) You can determine the trend with this tool. Using crosses of two Moving averages, you can say that the trend is going to be bullish or bearish; A fast-moving average and a slow one. When the fast-moving crosses up the slow-moving, it's going to be an uptrend and when it crosses down the slow-moving, it means that you are going to have a downtrend. That's easy ;) Hope to enjoy it Sepehr(Faran)
FREE
IMA Finder MT4
Mubashir Mohamed Quraish Albarakat
This indicator is designed based on the Moving Origin indicator When the moving origin indicator breaks the price, this indicator gives a signal It is useful for better viewing of signals and analysis on them Attributes: Can be used in all symbols Can be used in all time frames Too many signals Simple and quick settings Easy way to work Settings: period: like moving average settings alarmShow: If you want to receive an alert in Metatrader after receiving the signal, enable this setting alarmS
FREE
Stochastic Rsi Alert
Biswarup Banerjee
3 (1)
介绍 Stoch RSI MT4,一种创新的交易指标,旨在通过将 Stochastic 振荡器的优势与相对强弱指数 (RSI) 结合,增强您的交易策略。该工具非常适合新手和经验丰富的交易者,提供对市场动量和趋势反转的关键洞察。 使用 Stoch RSI MT4,您可以通过识别最佳的进出点做出明智的交易决策。该指标提供了一种独特的交易时机把握方法,使用户能够利用潜在的市场变化并最大化盈利。 MQL产品安装指南 | 在 MT4/MT5 上更新已购买的MQL产品 | 常见故障排除指南 | 指标设置 / 指南 主要特点 信号生成:利用 Stochastic 振荡器和 RSI 来测量市场状况和动量变化。 买入/卖出信号:当市场条件表明超卖水平时触发买入信号,在超买水平时触发卖出信号。 无重绘:确保提供的信号保持有效,事后不会改变。 图表上的仪表板:在图表上直接显示用户友好的实时信息面板,便于快速参考。 弹出警报:通过 MetaTrader 弹出窗口发送警报通知,提醒用户重要的交易信号。 推送通知:实时警报发送到您的移动设备,让您随时监控交易。 电子邮件警报:在关键信号事件上发送电子邮件通知,便于
FREE
Stochastic MA
Devy Tanusukma
5 (1)
Supertrend Moving Average A combination of Supertrend and Moving Average to create a converging trade setup Input parameters: signal mode: set it to true if you want to plug it into   STAT (Signal Tester and Trader) arrow shift: distance between fast EMA line to arrow on chart turn on price line filter turn on moving average signal for converging setup k period d period s period averaging method Moving average period Averaging method upper level limit (Stochastic) lower level limit  (Stochastic)
FREE
MP Gradient Adaptive RSI oscillator uses AMA with the basic RSI to cover the retracements with minimum lag. Trigger line crossing the oscillator will provide an entry point for trader. Settings: RSI period: period of the oscillator Sensitivity of the oscillator: controls the sensitivity of the oscillator to retracements, with higher values minimizing the sensitivity to retracements. RSI applied price: source input of the indicator Number of bars to draw: is used when the Fill Type option is no
FREE
please leave 5 stars to me A   support level   is a level where the price tends to find support as it falls. This means that the price is more likely to "bounce" off this level rather than break through it. However, once the price has breached this level, by an amount exceeding some noise, it is likely to continue falling until meeting another support level. A   resistance level   is the opposite of a support level. It is where the price tends to find resistance as it rises. Again, this means t
FREE
该产品的买家也购买
Neuro Poseidon MT4
Daria Rezueva
4.94 (31)
Neuro Poseidon is a new indicator by Daria Rezueva. It combines precise trading signals with adaptive TP/SL levels - creating best possible trades as a result! Message me and get  Neuro Poseidon Assistant  as a gift to automize your trading process! What makes it stand out? 1. Proven profitability on all assets and timeframes 2. Only confirmed BUY and SELL signals present on the chart 3. Adaptive TP & SL levels generated by the software for each trade 4. Easy to understand - suitable for all
Gann Made Easy
Oleg Rodin
4.84 (165)
Gann Made Easy 是一个专业且易于使用的外汇交易系统,它基于使用先生理论的最佳交易原则。 W.D.江恩。该指标提供准确的买入和卖出信号,包括止损和获利水平。您甚至可以使用推送通知在旅途中进行交易。 购买后请联系我,即可免费获得交易指导和超棒的额外指标! 您可能已经多次听说过江恩交易方法。通常 Gann 的理论不仅对于新手交易者而且对于那些已经有一定交易经验的人来说都是非常复杂的东西。这是因为江恩的交易方法在理论上并不那么容易应用。我花了几年时间来完善这些知识,并将最好的原则应用到我的外汇指标中。 该指标非常易于应用。您所需要的只是将其附加到您的图表并遵循简单的交易建议。该指标不断进行市场分析工作并寻找交易机会。当它检测到一个好的入口点时,它会为您提供一个箭头信号。该指标还显示止损和获利水平。 换句话说,当您像先生一样进行交易时,该指标会为您提供最佳江恩建议。江恩亲自告诉你此时此刻该做什么。但最好的部分是您不需要了解任何有关江恩交易原则的知识,因为该指标会为您完成整个市场分析工作。
Dynamic Forex28 Navigator
Bernhard Schweigert
4.43 (7)
Dynamic Forex28 Navigator - 下一代外汇交易工具。 当前 49% 折扣。 Dynamic Forex28 Navigator 是我们长期流行的指标的演变,将三种功能合二为一: 高级货币强度 28 指标 (695 条评论)+ 高级货币 IMPULSE 带警报 (520 条评论)+ CS28 组合信号(奖励)。 有关指标的详细信息 https://www.mql5.com/en/blogs/post/758844 下一代强度指标提供什么? 您喜欢的原始指标的一切,现在通过新功能和更高的精度进行了增强。 主要特点: 专有货币强度公式。  所有时间范围内的平滑和准确的强度线。 非常适合识别趋势和精确进入。 动态市场斐波那契水平(市场斐波那契)。  此指标独有的独特功能。 斐波那契应用于货币强度,而不是价格图表。 适应实时市场活动以获得准确的反转区域。 实时市场动量。  第 9 行显示市场是活跃还是被动。 对于定时交易至关重要。 全面的警报和显示。  每种货币最强的买入和卖出动量。 ​​28 对的双重动量买入和卖出。 超买/超卖警告外部范围和止损。 反转
M1 Sniper
Oleg Rodin
5 (24)
M1 SNIPER 是一款易于使用的交易指标系统。它是一个专为 M1 时间框架设计的箭头指标。该指标可以作为独立的系统在 M1 时间框架下进行剥头皮交易,也可以作为您现有交易系统的一部分使用。虽然该交易系统专为 M1 时间框架交易而设计,但它也可以用于其他时间框架。我最初设计此方法是为了交易 XAUUSD 和 BTCUSD。但我发现这种方法在其他市场交易中也同样有用。 指标信号既可以顺势交易,也可以逆势交易。我教授一种特殊的交易技巧,帮助您利用指标信号进行双向交易。该方法基于使用特殊的动态支撑位和阻力位区域。 购买后,您可以立即下载 M1 SNIPER 箭头指标。此外,我还为所有 M1 SNIPER 工具用户免费提供下方屏幕截图所示的 Apollo Dynamic SR 指标!这两个指标的组合可以帮助您更轻松、更准确地利用 M1 时间框架进行交易。 购买后请联系我,免费获取交易提示和奖励指标! 祝您交易成功!
Enigmera
Ivan Stefanov
5 (8)
ENIGMERA: 市场的核心 重要提示:MQL5.com 演示版本在策略测试器中运行,可能无法完全反映 Enigmera 的功能。请查看描述、截图和视频了解详细信息。如有任何问题,请随时联系我! 该指标的代码已完全重写。版本 3.0 增加了新功能并修复了自指标发布以来积累的错误。 简介 这个指标和交易系统是金融市场的一种独特方法。ENIGMERA 使用分形周期来精确计算支撑和阻力水平。它展示了真实的积累阶段,并提供了方向和目标。无论是在趋势中还是在修正中,这个系统都能工作。 它是如何工作的 指标的大部分功能通过图表左侧的按钮控制,使得能够快速响应不同的市场情况。 按钮 ON/OFF – 显示或隐藏整个指标。 Channel – 激活支撑通道,显示可接受的偏差范围。 Dev1 (第一偏差) – 指示价格在支撑偏差内的波动,信号表示市场正在整合或积累力量。 Dev2 (第二偏差) – 显示价格在偏差之间的波动,表示趋势形成和方向。 Dev3 (第三偏差) – 表示趋势的显著加速和高波动性。 45deg (45度) – 显示市场的节奏和相对于 45 度线的运动稳定性。 Tgt1/2
Scalper Inside PRO
Alexey Minkov
4.74 (68)
Scalper Inside PRO Scalper Inside PRO 是一款适用于 MetaTrader 4 的日内趋势与剥头皮指标,使用专有算法快速识别市场方向和关键目标价位。它能够自动计算进场价、出场价以及多级止盈目标,并显示详细的绩效统计,让您了解不同交易品种和策略以往的表现情况,从而帮助您为当前的市场环境选择最合适的交易工具。此外,您还可以将自己的箭头指标轻松接入 Scalper Inside PRO,快速评估其统计数据和历史表现。 该指标可用于任何交易品种和任何周期(建议在 M5 上进行日内交易),并内置多种交易策略,因此既可以作为独立的剥头皮工具使用,也可以作为您交易系统中功能强大的分析组件。 主要功能 通过专有算法(Next‑Generation Trend Detection Algorithm,NG TDA)快速识别当前市场趋势。 自动计算日内交易的进场价、出场价和多级止盈目标。 内置策略与统计模块,用于评估不同市场环境下各品种的表现。 支持接入自定义箭头指标(PRO 模式),并计算其详细信号统计数据。 适用于外汇、金属、指数、股票、商品、期货和加密货币等各类市
Trend Catcher ind
Ramil Minniakhmetov
5 (2)
趨勢捕捉指標 趨勢捕捉指標結合了作者獨有的客製化自適應趨勢分析指標,用於分析市場價格趨勢。它透過過濾掉短期噪音,並專注於潛在的動能強度、波動性擴張和價格結構行為,來識別真實的市場方向。此外,它還結合了平滑和趨勢過濾等客製化指標,例如移動平均線、相對強弱指標 (RSI) 和波動率過濾器。 您可以在這裡查看實際運行情況以及我的其他產品: https://www.mql5.com/en/users/mechanic/seller 請注意,我不會在 Telegram 上出售 EA 或任何設置,那是騙局。所有設定都可以在我的部落格上免費取得。 重要提示!購買後請立即聯繫我,以獲取使用說明和額外獎勵! 請注意,我不會在 Telegram 上出售 EA 或任何設置,那是騙局。所有設定都可以在我的部落格上免費取得。
本指标是实践实战交易完善的波浪自动分析的指标 !  案例... 注: 波浪分级用西方叫法不习惯,因受到缠论(缠中说禅)命名方式习惯的影响,我是将基础波浪命名为 笔 ,将二级波段命名为 段 ,同时具有趋势方向的段命名为 主趋段 (以后笔记中都是这种命名方式,先告知大家),但是算法上和缠论关系不大切勿混淆.反映的是本人分析盘面总结的 千变万化纷繁复杂的运行规律 . 对波段进行了标准化定义,不再是不同人不同的浪  ,   对人为干扰的画法进行了排除,在严格分析进场起到了关键的作用 . 使用这个指标,等于将交易界面提升美感,抛弃最原始的K线交易带你进入新的交易层次.如果不是为了交易,在宣传上也将使客户观感提升层次. 指标内容: 1. 基础波浪 (笔) : 首先我们找出了价格波动过程中的基础波动拐点,当然他的有序性低,为下一步的计算提供基础. 2. 二级波段( 段 ) :在基础波浪的基础上,通过算法分析得到层级更明显的二级波段,二级波段为波浪提供了分析基础 3. 波浪( 浪 ): 有着更清晰的趋势,更清晰直观的方向.分析一个波浪是否延续,需要看二级波段的形态,分析二级的构成,可以得出波浪后
KT Alpha Hunter Arrows MT4
KEENBASE SOFTWARE SOLUTIONS
大多数箭头指标只给你一个信号,然后把剩下的判断全部留给你自己。KT Alpha Hunter Arrows 给你的,是一套完整的交易计划。 每一个信号箭头出现时,图表上都会同时绘制完整计划:入场线、止损位、四个止盈目标,以及实时 Edge 结论,告诉你当前品种和时间周期是否值得交易。套装中还包含 Trade Manager EA,在你手动入场后负责后续执行,让你在市场波动和情绪干扰下依然保持纪律。非重绘。只在K线收盘后给出信号。适用于 Forex、黄金、指数,以及你交易的其他任何品种。 核心功能 非重绘买入和卖出箭头,只在K线收盘后出现。 每个信号都带有入场线、结构性止损和四个止盈目标。 Edge Dashboard 会分别评估当前图表上的买入和卖出机会。 结论系统:No Edge、Marginal、Tradeable、Good 或 Strong。 一键 Auto Optimize 按钮,可根据当前品种和时间周期自动调整设置。 完整套装包含 Trade Manager EA,并内置五种专为本指标设计的交易管理方案。 Prop Firm Risk Panel 可在图表上实时追踪日内回撤
Neo Wave PRO
Nikolay Raykov
5 (1)
Price & Time Market Structure Indicator A professional market structure tool that analyzes waves through both price and time — not price alone. Main Description NeoWave PRO is a professional market structure indicator for MetaTrader 4 designed for traders who want to move beyond traditional one-dimensional wave tools such as ZigZag, swing indicators, and basic high/low systems. Most wave indicators analyze only one thing: Price. But a real market wave is not only a price movement. A true wave de
PRO Renko System
Oleg Rodin
5 (30)
PRO Renko Arrow Based System for trading renko charts.  准确的信号交易任何外汇工具. 另外,我将免费提供系统的附加模块! PRO Renko系统是RENKO图表上高度准确的交易系统。该系统是通用的。 该交易系统可应用于各种交易工具。 该系统有效地中和了所谓的市场噪音,打开了获得准确反转信号的通道。 该指标易于使用,只有一个参数负责产生信号。 您可以很容易地使算法适应您感兴趣的交易工具和renko酒吧的大小。 我很乐意通过提供任何咨询支持来帮助所有客户有效地使用该指标。 祝您交易成功!购买后,立即写信给我! 我将与您分享我的建议和我的renko发电机。 另外,我将免费提供系统的附加模块!
Genesis Matrix Pro is a professional multi-timeframe trend detection indicator designed to help traders identify high-quality market alignment with clarity and structure. It combines 12 different technical indicators into one visual alignment matrix, allowing traders to quickly see when market conditions are bullish, bearish, or neutral. A signal is generated only when the selected strategies are aligned, helping reduce noise and improve decision-making. PLEASE CONTACT ME AFTER PURCHASE TO GET
Current event:  https://c.mql5.com/1/326/A2SR2025_NoMusic.gif A. 什么是 A2SR ?   * 这是一个领先的技术指标(没有重绘,没有滞后)。  -  指导 : -- 在  https://www.mql5.com/en/blogs/post/734748/page4#comment_16532516 -- 和  https://www.mql5.com/en/users/yohana/blog A2SR 在确定支撑(需求)和阻力(供应)水平方面有一种特殊的技术。 与我们在网上看到的普通方式不同,A2SR 在确定实际 SR 级别时有一个独创的概念。 原技术不是从网上拿来的,也没有在网上公开过。 A2SR 将根据您的交易风格自动选择 SR 级别。 即使您正在更改时间范围,但 SR 级别仍将保留在其位置上。 因为实际的 SR 不是从你使用的时间范围内获得的。 A2SR 拥有完整的交易工具 。 实际支持(需求)和阻力(供应)的真正概念。 新闻事件和央行讲话的市场情绪。 新闻事件和趋势的主要货币强度 (MCS) 的真正概念
PZ Trend Trading
PZ TRADING SLU
4.8 (5)
许多盈利交易者不仅知道如何识别市场趋势,而且也能把握趋势建立后的交易机会。 Pz 趋势交易 指标设计用来在趋势行情中尽可能的赚取利润。 已建立的趋势提供了一揽子交易机会,但大多数趋势交易指标完全忽视了它们,让交易者在趋势行情时完全不知道该如何做!一般趋势指标只通知有关的趋势变化,但根本不足以得到卓越的回报. Pz 趋势交易 指标比一般趋势指标显示多达 20 倍的交易 , 因为它注重所谓的市场时机。它不仅显示当前的市场趋势,也有回调,内柱线的突破和调整。它令您在趋势回调之后介入,安全的柱线内突破金字塔加仓,以及发现潜在的反转,和已知的调整。 趋势改变 一个趋势改变在市场方向变化时发生。趋势变化在图表上用带数字的彩色圆圈显示。蓝色 (1) 信号为上涨开始, 而红色 (1) 信号为下跌开始。趋势变化并非评估当前价格动作的结果, 它意味着交易设置是不定时地。如果您正确使用本指标, 在趋势变化时, 您将将已经入场 (参看下面的调整)。 回调 但凡趋势在运动中,行情上下抖动,盈利者收割利润,且其它参与者入场。趋势回调代表好的买入机会,通常是由主力获利离场导致。如果行情在回调后回归上行, 指标将
Step into the world of Forex trading with confidence, clarity, and precision using   Gold Indicator   a next-generation tool engineered to take your trading performance to the next level. Whether you’re a seasoned professional or just beginning your journey in the currency markets, Gold Indicator equips you with powerful insights and help you trade smarter, not harder. Built on the proven synergy of three advanced indicators, Gold Indicator focuses exclusively on medium and long-term trends eli
本产品已针对 2026 年市场进行更新,并针对最新 MT5 版本进行了优化。 价格更新通知: Smart Trend Trading System 目前价格为 $99 。 接下来的 30 次购买 后,价格将上涨至 $199 。 特别优惠: 购买 Smart Trend Trading System 后,请发送私信给我,即可免费领取 Smart Universal EA ,并将您的 Smart Trend 信号转换为自动交易。 Smart Trend Trading System 是一套完整的交易系统,具备不重绘、不回绘、不延迟的特点,专为希望获得更清晰信号、更准确趋势方向以及更有组织交易方式的交易者打造。 Online course , manual and download presets . 它将 10 多种交易工具 整合到一个系统中,包括趋势检测、反转区域、Smart Cloud、移动止损逻辑、支撑与阻力、K线着色、提醒以及多周期分析。 该系统旨在帮助您应对不同的市场环境: 趋势市场: 识别主要趋势,发现回调,跟随动能,并通过止损指导和移动止损选项寻找更清晰的入场机会。 震荡
Scalper Vault
Oleg Rodin
5 (37)
Scalper Vault 是一个专业的剥头皮系统,为您提供成功剥头皮所需的一切。该指标是一个完整的交易系统,可供外汇和二元期权交易者使用。推荐的时间范围是 M5。 该系统为您提供趋势方向的准确箭头信号。它还为您提供顶部和底部信号以及江恩市场水平。无论您拥有何种交易经验,该系统都易于使用。您只需要遵循简单的规则并每天重复该过程。 建议将此系统用于主要货币对。感谢您的关注! 请注意,该指标在策略测试器中可能无法正常工作。因此,我建议仅在模拟或真实账户的真实交易条件下使用该系统。 指示器提供所有类型的警报,包括推送通知。 购买指标后请与我联系。我将免费与您分享我的个人交易建议和出色的奖励指标! 祝您交易愉快,盈利!
PZ Swing Trading
PZ TRADING SLU
5 (3)
Swing Trading 是第一个旨在检测趋势方向的波动和可能的反转波动的指标。它使用在交易文献中广泛描述的基准摆动交易方法。该指标研究多个价格和时间向量,以追踪总体趋势方向,并检测市场超卖或超买并准备好进行修正的情况。 [ 安装指南 | 更新指南 | 故障排除 | 常见问题 | 所有产品 ] 市场波动的利润不会被窃取 指示器始终显示趋势方向 彩色价格带代表机会基准 彩色虚线表示可能的反转波动 该指标分析其自身的质量和性能 它实现了一个多时间仪表板 可定制的趋势和波动周期 它实现了电子邮件/声音/推送警报 指示器为非重涂或重涂 什么是摇摆交易 摇摆交易是一种尝试在一天到一周内从证券中获得收益的交易方式,尽管某些交易最终可以保持更长的寿命。摇摆交易者使用技术分析来买入弱点和卖出力量,并有耐心等待这些机会的发生,因为在发生一波抛售浪潮之后购买证券而不是陷入抛售更有意义。 机会基准 关于历史数据的大量研究证明,适合于波动交易的市场倾向于在基线价格带上下交易,基线价格带由图表显示,使用平均真实区间计算得出。波动交易者使用基线,该策略是购买常态和卖出躁狂,或做空常态并掩盖沮丧。在没有疲
BTMM State Engine Pro MT4
Garry James Goodchild
BTMM State Engine Pro is a MetaTrader 4 indicator for traders who use the Beat The Market Maker approach: Asian session context, kill zone timing, level progression, peak formation detection, and a multi-pair scanner from a single chart. It combines cycle state logic with a built-in scanner dashboard so you do not need the same tool on many charts at once. What it does Draws the Asian session range; session times can follow broker server offset or be set in inputs. Tracks level progression (L
Dynamic Scalper System
Vitalyi Belyh
5 (1)
“ Dynamic Scalper System ”指标专为在趋势波内进行剥头皮交易而设计。 已在主要货币对和黄金上进行测试,并可与其他交易工具兼容。 提供顺势短线建仓信号,并提供额外的价格变动支持。 指标原理: 大箭头决定趋势方向。 在趋势波内,我们采用一种生成小箭头形式的剥头皮交易信号的算法。 红色箭头代表看涨方向,蓝色箭头代表看跌方向。 敏感的价格变动线会沿着趋势方向绘制,并与小箭头信号协同作用。 信号运作方式如下:当线在适当时刻出现时,将形成入场信号;在出现线时,持仓;线完成后,平仓。 建议的操作时间范围为M1 - H4。 箭头在当前K线上方形成,如果下一根K线已开仓,则不会重新绘制上一根K线上方的箭头。 输入参数 Trend Wave Period - 趋势方向(大箭头)的周期,改变趋势波的时间间隔。值 1 表示趋势方向的最长持续时间,参数值越大,持续时间越短。 Scalper Arrows Period - 信号箭头(小箭头)的计算周期,改变入场信号的生成频率。值 3 表示最频繁的生成频率,参数值越大,箭头频率越低,准确度越高。 这些参数可以根据不同的时间范
M30/H1/H4 波段版已上线 想抓住M5/M15无法捕捉的大行情? Gold Signal Swing Pro(M30/H1/H4)现已发售。 目标每笔$20-$80+。 https://www.mql5.com/en/market/product/177643 KURAMA GOLD SIGNAL PRO(MT4版)— 7层过滤器、自动TP/SL、品质评分搭载 XAUUSD完整交易系统 不重绘。不重画。不延迟。每个信号永久固定。所见即所得。 福利:购买买断版许可证可免费获得 AI Zone Radar(价值$59)+ 完整PDF手册。购买后请给我发消息。 AI Zone Radar: https://www.mql5.com/en/market/product/175834 交易员的信赖:已被活跃的黄金交易员社区使用。因精度和易用性获得赞誉。 你的问题 — 以及解决方案 你知道黄金每天波动$30-50。你知道这里有钱可赚。但是: - 入场过早,价格反向$10后才朝你的方向走 -
PZ 123 Pattern
PZ TRADING SLU
1 (1)
123模式 是最受欢迎,功能强大和灵活的图表模式之一。该模式由三个价格点组成:底部,峰值或谷值以及38.2%至71.8%之间的斐波纳契回撤位。当价格突破最后一个峰值或谷值时,该形态被认为是有效的,此时指标绘制箭头,发出警报并可以进行交易。 [ 安装指南 | 更新指南 | 故障排除 | 常见问题 | 所有产品 ] 清除交易信号 可自定义的颜色和尺寸 实施绩效统计 可定制的斐波那契回撤水平 显示适当的止损和获利水平 该指标可用于查找连续或反转形态 它是不可重涂和不可重涂的 它实现了电子邮件/声音/视觉警报 123模式 可以表现为连续或反转模式。为了简化操作,该指标使您可以选择要寻找哪种类型的形态,使其成为趋势或反转交易者的绝佳工具。 设置 将指标加载到任何图表时,将显示一组选项作为输入参数。如果您认为它们太多,请不要感到失望,因为参数被分组为不言自明的块。这就是每个参数块的作用。 幅度-幅度表示替代价格点之间的最小柱线量。要找到大图案,请增加幅度参数。要查找较小的模式,请减小幅度参数。 闵。回撤-形态中所需的最小斐波那契回撤。设置为零不对其进行评估。 最大。回撤-形态中可能的最大斐
MonsterDash Harmonic Indicator
Paul Geirnaerdt
4.54 (26)
MonsterDash Harmonic Indicator is a harmonic pattern dashboard. It recognizes all major patterns. MonsterDash is a dashboard that displays all detected patterns for all symbols and (almost) all timeframes in sortable and scrollable format. Users can add their own user defined patterns . MonsterDash can open and update charts with the pattern found. Settings MonsterDash's default settings are good enough most of the time. Feel free to fine tune them to your needs. The color settings are for thos
Apollo SR Master
Oleg Rodin
5 (2)
Apollo SR Master 是一款支撑/阻力指标,其特殊功能使利用支撑/阻力区域进行交易更加便捷可靠。该指标通过检测局部价格顶部和底部,实时计算支撑/阻力区域,没有任何时间延迟。为了确认新形成的支撑/阻力区域,该指标会显示特殊信号,表明该支撑/阻力区域可以作为实际的卖出或买入信号。在这种情况下,支撑/阻力区域的强度会增强,因此从该区域进行交易的成功率也会更高。这正是该指标的核心理念。 SR区域也使止损和止盈的操作更加便捷。根据信号方向,可以将SR区域上方或下方的空间用作止损位。此外,相对的SR区域也可以用作潜在的止盈区域。 我还免费向所有 Apollo SR Master 指标的用户提供我的“Apollo 价格行为系统”指标。这两个指标结合使用将帮助您找到更好的入场点。 购买后请联系我,即可免费获得我的交易技巧以及我的“阿波罗价格行为系统”指标作为赠品!
地震仪 市场地震探测器。 Description in English : https://www.mql5.com/en/market/product/113869?source=Site+Market+Product+Page#description How to use the Seismograph : https://www.mql5.com/en/market/product/113869#!tab=comments&page=2&comment=52806941 Create an EA : https://www.mql5.com/en/market/product/113869#!tab=comments&page=3&comment=52816509 无论您以何种方式交易,您都绝对希望避免进入低流动性市场。 然而,即使你确保在应该繁忙的市场时间进入,事实是许多人经常被困在流动性低的市场中。 经过几个小时的等待,市场突然变得繁忙起来,但是......事实证明,现在很多人都站在了与市场相反的方向上。 如果人们不得不等待浮动负数需要很长时间,甚至人们不得不止
Advanced Currency Strength28 Indicator
Bernhard Schweigert
4.91 (657)
目前40%的折扣 任何新手或专家交易者的最佳解决方案! 这个指标是一个独特的、高质量的、可负担得起的交易工具,因为我们纳入了一些专有的功能和一个新的公式。只需一个图表,你就可以读出28个外汇对的货币强度!想象一下,你的交易将如何得到改善,因为你的交易是在你的手中进行的。想象一下,你的交易将如何改善,因为你能够准确地确定新趋势或剥头皮机会的触发点? 用户手册:点击这里  https://www.mql5.com/en/blogs/post/697384 这是第一本,原版的! 不要买一个毫无价值的崇拜者的克隆品。 特别的 子窗口中的箭头显示强劲的货币势头GAP将指导你的交易! 当基础货币或报价货币处于超卖/超买区域(外盘斐波那契水平)时,在个人图表的主窗口中出现警告信号。 当货币力量从外围区间回落时,回撤/反转警报。 十字星模式的特别警报 可选择多个时间框架,以快速查看趋势! 货币强度线在所有的时间框架中都非常平稳,当使用较高的时间框架来识别总体趋势,然后使用较短的时间框架来确定精确的入口时,效果非常好。你可以根据自己的意愿选择任何时间框架。每个时间框架都由其自身进行了优化。
Auto Optimized Parabolic RSI: 高级 3D 动量引擎 大多数零售指标之所以失效,是因为它们依赖于静态输入,一旦市场波动率发生变化,这些输入就会崩溃。Auto Optimized Parabolic RSI 通过不断重新计算自身的数学优势,解决了“指标衰退”的问题,将机构级别的量化自适应能力直接引入您的 MT5 终端。 核心优势:定制的内存 3D 优化   标准的自动优化器通常会导致 MT5 平台卡顿,因为它们通过标准的指标调用使终端超载。该工具完全绕过了这些性能瓶颈。内部引擎采用定制的原生基于 RAM 的计算器构建,每次加载图表或更改时间周期时,它都会执行极速的 3D 网格搜索。它同时扫描 RSI 周期(频率)、SAR 步长(加速度)和 SAR 最大值(速度限制),在绝对的毫秒级时间内测试数以万计的参数组合,且完全不会拖慢您的平台。它不是仅仅寻找一个“不错”的设置,而是映射整个参数空间,以寻找资产当前动量结构的绝对全局最大值。 严格的财务评分与逼真的交易模拟   与基于抽象“指标点数”进行优化评分的业余工具不同,该引擎的 3.10 版本严格与资金数学挂钩。每
Advanced Supply Demand
Bernhard Schweigert
4.91 (300)
现在优惠 40%! 任何新手或专业交易者的最佳解决方案! 该指标是一款独特、高质量、且价格合理的交易工具,因为我们已经整合了许多专有功能和新公式。 依据此更新,您将能够显示双重时间帧区域。 您不仅可以显示一个较高的时间帧,还可以同时显示图表时间帧,加上更高的时间帧:显示嵌套时区。 供需双方所有交易者都会喜欢它。 :) 重要信息披露 高级供需的最大潜力,请访问 https://www.mql5.com/zh/blogs/post/720245   想象您的交易如何得以改善,是因为您能够精准定位入场或目标位吗? 构建于新的底层算法,它可以更轻松地识别出买卖双方之间的潜在失衡。 这是因为它以图形方式展示供需最强劲区域,及其过去的表现(显示旧区域)。 这些功能旨在帮助您更轻松地发现最佳入场区域和价位。 现在您可以针对您的交易品种和时间帧来优化和编辑区域强度! 高级供需指标适用于所有产品和时间帧。 它是一个新的公式,非常新的功能是两个区域强度函数可由用户输入进行调整! 这在交易中是一大优势。 当您学习如何使用专有功能,例如带有价格游离最小 X 因子的区域强度时,您能够判断该区域强劲与否。 供需
该指标旨在与艾略特波浪理论相结合,提供了两种不同的工作方式: 自动工作: 在此模式下,指标会自动检测图表上的所有五个动机波浪,并为您提供预测和潜在的逆转区域。它还可以提供警报和推送消息。这种自动功能简化了识别和分析艾略特波浪模式的过程。 手动工作: 此选项适用于喜欢手动方法的交易员,用于手动绘制九个不同等级的波浪。每个等级都可以在它们出现后通过调整图表上的绘制线条来单独定义。此功能简化了手动绘制波浪的过程,使其更加高效。需要注意的是,所有绘图数据将保存在平台的数据文件夹中,以备将来参考。 参数: Name: 指标名称。 Use_System_Visuals: 启用或禁用指标主题,以匹配交易平台的整体外观。 Explain_Comment: 允许启用或禁用波浪编号的解释性注释,有助于理解已识别的波浪。 Show_Last_Candle_Counter: 启用或禁用蜡烛计时器,提供有关当前蜡烛收盘的剩余时间的信息。 Candle_Counter_Color: 蜡烛计时器文本的颜色。 Basic_Wave_Color: 用于表示波浪的主要颜色。 Bullish_Wave_Color: 当检测
Introduction to Fractal Pattern Scanner Fractal Indicator refers to the technical indicator that makes use of the fractal geometry found in the financial market. Fractal Pattern Scanner is the advanced Fractal Indicator that brings the latest trading technology after the extensive research and development work in the fractal geometry in the financial market. The most important feature in Fractal Pattern Scanner is the ability to measure the turning point probability as well as the trend probabi
作者的更多信息
All in One Pivot Point
Ali Gokay Duman
5 (8)
This indicator calculates support and resistance prices in multi-timeframe with different formulation and draw them on the chart that style do you choose. And If you want, Indicator can alert you when the current price arrive these pivot levels. Formulations: Classic, Camarilla, Woodie, Demark, Floor, Fibonacci Alert Options: Send Mobil Message, Send E-mail, Show Message, Sound Alert Levels: PP, S1, S2, S3, S4, S5, R1, R2, R3, R4, R5, TC, BC  and Middle Points Why do you need this indicator: Ti
FREE
Auto Fibonacci
Ali Gokay Duman
5 (3)
This indicator calculates fibonacci levels via moving averages trend and draw these lines. You can change fast and slow Moving Averages settings for customization. Inputs: Fast MA Time Period :  64 Fast MA Shift: 0 Fast MA Method: Smoothed Fast MA Apply To: Median Price Slow MA Time Period: 32 Slow MA Shift: 0 Slow MA Method: Smoothed Slow MA Apply To: Median Price ZigZag: False ZigZag Color: Red ZigZag Type: DashDot ZigZag Width: VeryThin Fibo Settings TrendFibonacci: True FiboTrendColor: Black
FREE
This Expert Advisor follows your channel lines that you draw. and when the price reaches these support and resistance trend lines, EA send open or close order automatically. You must draw two trend line with same color for EA to work, not equidistant channel line. and this color must be specified in ChannelColor parameter Strategies: Inside Channel Strategy: If the price reaches bottom trend line, the EA will place a buy order. and when the price reaches the top trend point, EA send close order
FREE
Gann Pivot Levels
Ali Gokay Duman
4.17 (6)
This indicator calculates gann support and resistance prices with use gann pyramid formulation and draw them on the chart. And If you want, Indicator can alert you when the current price arrive these pivot levels. Alert Options: Send Mobil Message, Send E-mail, Show Message and Sound Alert Levels: S1, S2, S3, S4, S5, R1, R2, R3, R4, R5 Inputs:  GannInputPrice: Input price for gann pyramid formulation. GannInputDigit: How many digit do you want to use for calculation formula. (The number and the
FREE
You can use this tool to create as many pending orders (limit order) as you want in one button press. All inputs must be in points. You can use this useful tool when such as FED speech times. User Inputs: MagicNumber = Magic number DeviationPoint = Deviation point number for limit orders Level = You can choise how many level do you want to create pending orders. BuyOrder = true/false SellOrder = true/false StartDistance = Distance between each level. StepDistance = Distance to be added increment
FREE
Lows And Highs
Ali Gokay Duman
5 (5)
This indicator draws the highest and the lowest prices of the previous periods on the chart. And If you want, Indicator can alert you when the current price arrives   these levels. For example: If you are watching the H1 timeframe, Indicator shows you the  lowest and the highest prices of H4, D1, W1 and M1 periods. So you don't need to open the other periods of chart windows. Alert Options: Send Mobil Message, Send E-mail, Show Message, Sound Alert Time Periods:  M1, M5, M15, M30, H1, H2, H3, H
FREE
MA ZigZag
Ali Gokay Duman
5 (2)
This indicator calculates trend via two different moving averages and draw zigzag trend lines. You can change fast and slow Moving Averages settings for customization. Inputs: Fast MA Time Period :  64 Fast MA Shift: 0 Fast MA Method: Smoothed Fast MA Apply To: Median Price Slow MA Time Period: 32 Slow MA Shift: 0 Slow MA Method: Smoothed Slow MA Apply To: Median Price ZigZag Color: Red ZigZag Type: DashDot ZigZag Width: VeryThin 
FREE
Pivot Point Expert
Ali Gokay Duman
5 (1)
This indicator calculates support and resistance prices in multi-timeframe with different formulation and draw them on the chart that style do you choose. And If you want, Indicator can alert you when the current price arrive these pivot levels. Formulations: Classic, Camarilla, Woodie, Demark, Floor, Fibonacci Alert Options: Send Mobil Message, Send E-mail, Show Message, Sound Alert Levels: PP, S1, S2, S3, S4, S5, R1, R2, R3, R4, R5, TC, BC and Middle Points Why do you need this indicator: Tim
FREE
This indicator calculates gann support and resistance prices with use gann pyramid formulation and draw them on the chart. And If you want, Indicator can alert you when the current price arrive these pivot levels. Alert Options: Send Mobil Message, Send E-mail, Show Message and Sound Alert Levels: S1, S2, S3, S4, S5, R1, R2, R3, R4, R5 Inputs:  GannInputPrice: Input price for gann pyramid formulation. GannInputDigit: How many digit do you want to use for calculation formula. (The number and the
FREE
This utility exports candle data   which you chosed by input parameter  to CSV  file. Time Frames:  M1,M5,M15,M30,H1,H4 Inputs: StartTime: Start time for exporting data. EndTime:   End time for exporting data. DataType: Close, Open, High, Low, Median(HL/2), Typical(HLC/3), Weighted(HLCC/4), Pip(H-L). DecimalSeperator: Decimal seperator for candle price data. (Default = ".") CSVDelimiter: Delimiter character for CSV file.  (Default = ";") * This utility exports candle data horizontally. That me
FREE
You can send MetaTrader screenshot easily to your identified telegram channel via press the send button that on the chart. TelegramBotToken: Telegram API credentials. You can create API credentials on my.telegram.org web page ChatId: Your telegram chatId. Secreenshots will be sending this channel - Please do not press the button repeatedly. This may cause your bot or ip address to be blocked. - You have to add telegram api address ( https://api.telegram.org ) in Option > Expert Advisors > Allow
FREE
You can send MetaTrader screenshot easily to your identified telegram channel via press the send button that on the chart. TelegramBotToken: Telegram API credentials. You can create API credentials on my.telegram.org web page ChatId: Your telegram chatId. Secreenshots will be sending this channel  - Please do not press the button repeatedly. This may cause your bot or ip address to be blocked. - You have to add telegram api address ( https://api.telegram.org ) in Option > Expert Advisors > Allow
FREE
筛选:
无评论
回复评论