Gann Pivot Levels
- 指标
- 版本: 1.1
- 更新: 30 十一月 2022

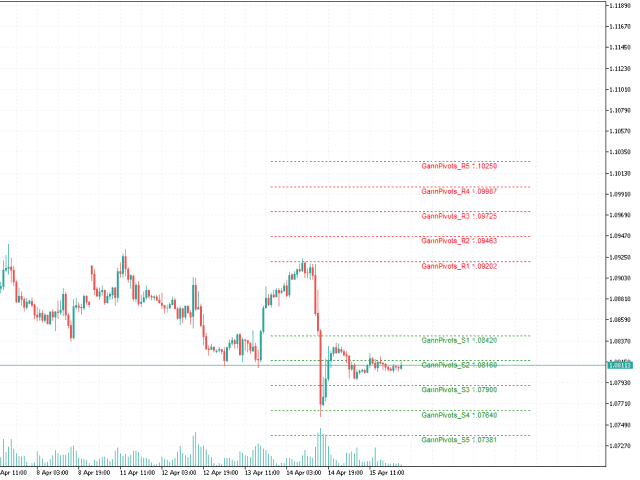
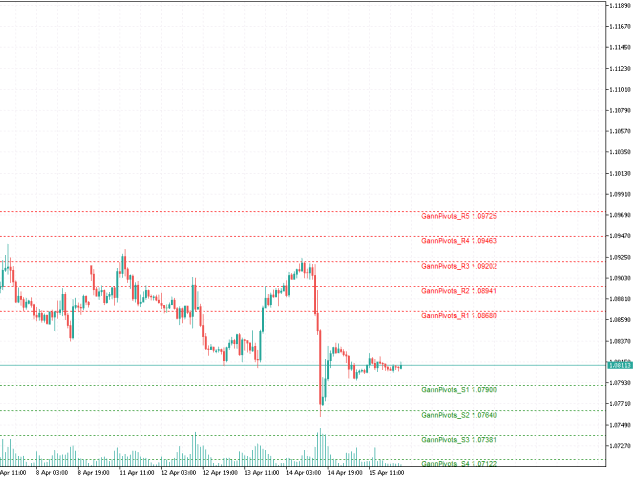
This indicator calculates gann support and resistance prices with use gann pyramid formulation and draw them on the chart. And If you want, Indicator can alert you when the current price arrive these pivot levels.
Alert Options: Send Mobil Message, Send E-mail, Show Message and Sound Alert
Levels: S1, S2, S3, S4, S5, R1, R2, R3, R4, R5
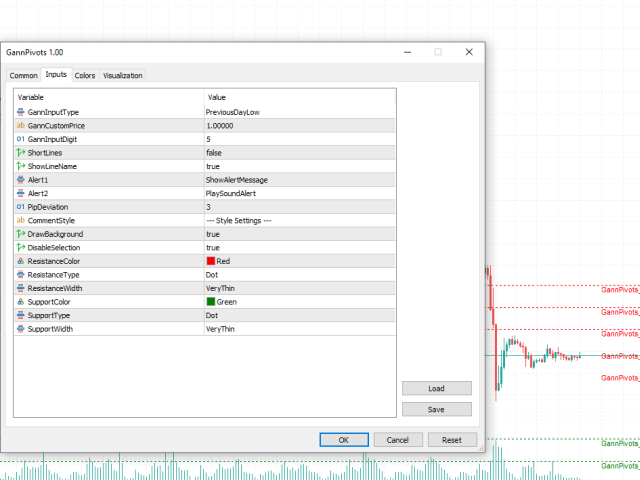
Inputs:
- GannInputPrice: Input price for gann pyramid formulation.
- GannInputDigit: How many digit do you want to use for calculation formula. (The number and the pivot intervals are inverse proportion. If decrease the number, pivot intervals will be larger then before.)
for example, EURUSD = 1.08147
- if you set 6, Indicator use 108147 number for gann input price.
- if you set 4, Indicator use 1081 number for gann input price.
- PipDeviation: You can set price sensibility for alert (Default: 3)
- Style: You can change line's style (Color, Width, Type)


dobry