
Lows And Highs
- 指标
- 版本: 1.3
- 更新: 30 十一月 2022

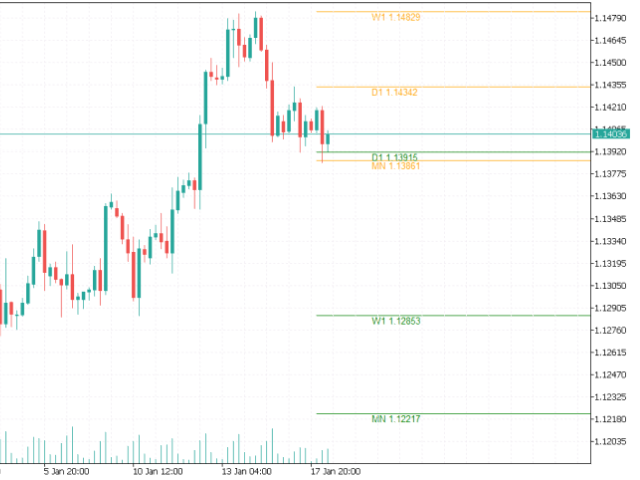
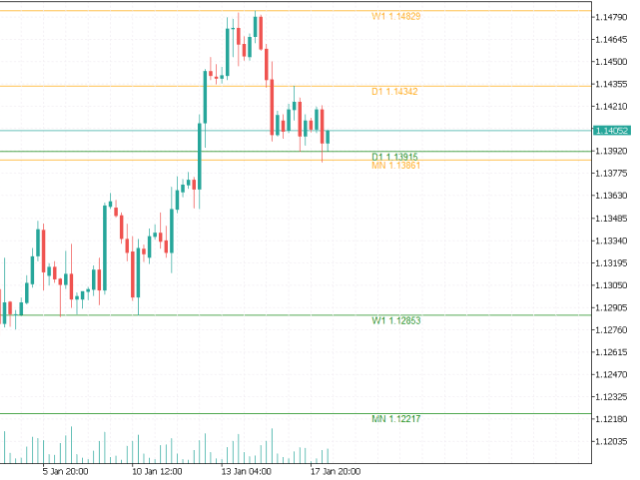
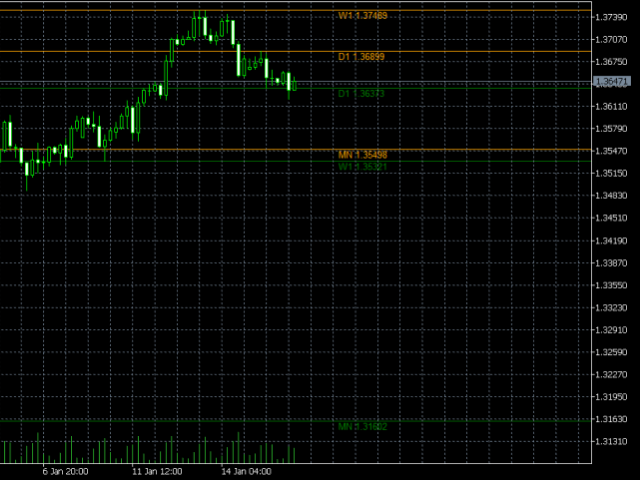
This indicator draws the highest and the lowest prices of the previous periods on the chart. And If you want, Indicator can alert you when the current price arrives these levels.
For example: If you are watching the H1 timeframe, Indicator shows you the lowest and the highest prices of H4, D1, W1 and M1 periods. So you don't need to open the other periods of chart windows.
Alert Options: Send Mobil Message, Send E-mail, Show Message, Sound Alert
Time Periods: M1, M5, M15, M30, H1, H2, H3, H4, H6, H8, H12, D1, W1, MN
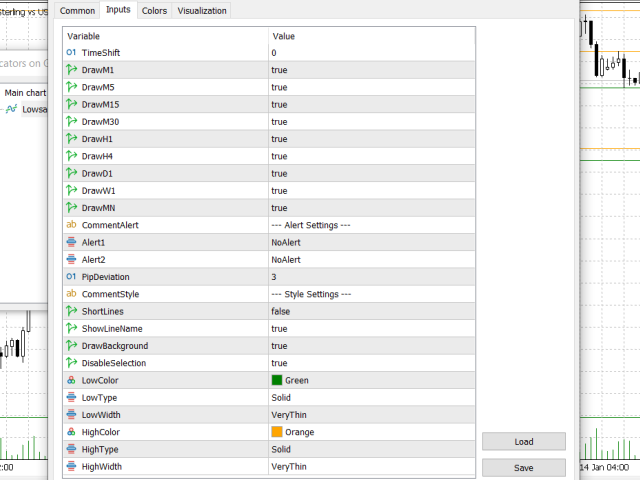
Inputs:
- TimeShift: You can set start hour for calculating. And that way you can see levels independently from broker server's time-zone.
- PipDeviation: You can set price sensibility for alert (Default: 3)
- Lines: You can chose short line or horizontal line for showing prices
- Style: You can change line's style (Color, Width, Type)
















































super