RSI Entry Points MT5
- 指标
- 版本: 1.3
- 更新: 8 七月 2021
- 激活: 10

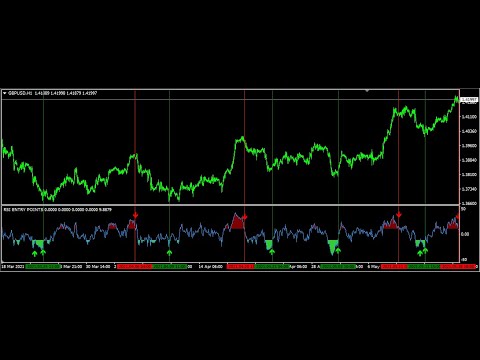
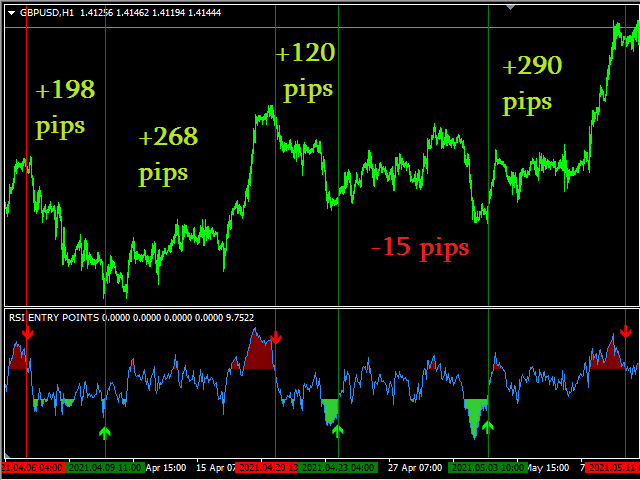
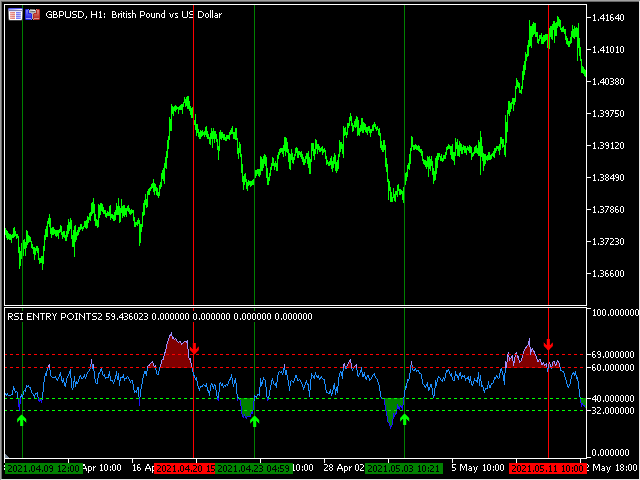
RSI Entry Points is the upgrade of the standard RSI indicator to avoid lagging. Indicator draws the clouds and the arrows to have clear picture where price is and what to wait for. Why standard RSI is lagging? because mostly we do not use it correctly and it is with very weak visual flexibility, less informativity. With my current upgrade I tried to Fix both problems same time and I got much better results and more exact entries than standard RSI has. To make yourself sure check out the screens and the video of the backtest of indicator entries with EA built based on it. (EA is not for sale).
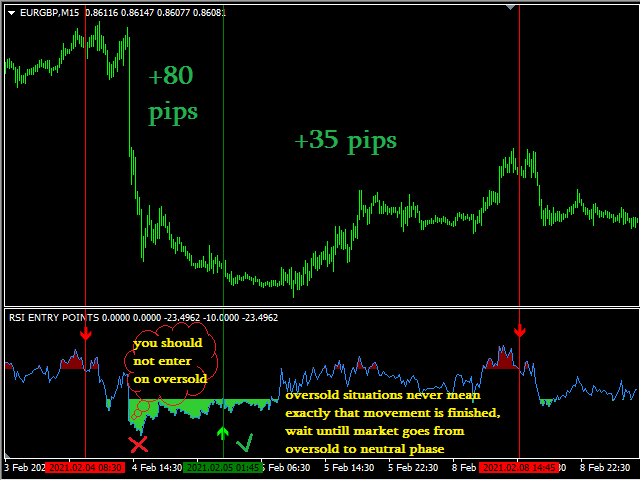
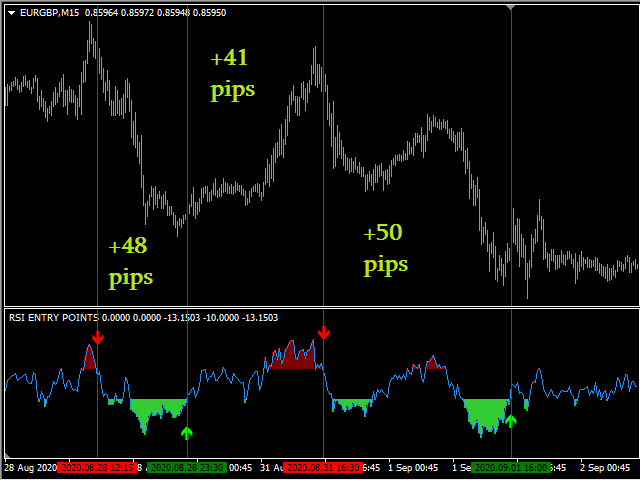
Indicator shows clouds up and down for detecting full zone of the market one side movement, at the end of each cloud indicator shows Entry Arrows. The end of the cloud is the end of the trending phase and showing neutral phase where is much more chanse to enter market in time and catch new full wave. So this have 2 positive sides: 1) We avoid entering too early wich is the reason of false entries and we get Draw downs (the definition of lagging). and 2) We catch full movement because the Entry is the Exit of previous possition, what means we caught it fully! To understand more clearly check the screens, watch the video and use it live :)
Default Settings after upgrade are for USD/CHF H4 Chart!
RSI Entry Points contain next parameters built in:
rsiPeriod: standard period of the rsi indicator.
rsiPrice: close price is used as default.
rsiSellProof: level wich is needed to cross first from down to up wich is proof for Sell red Arrows.
rsiSellCross: level wich is needed to cross after the proof from up to down for Sell arrow confirmation.
rsiBuyCross: level wich is needed to cross after the proof from down to up for Buy arrow confirmation.
rsiBuyProof: level wich is needed to cross first from up to down wich is proof for Buy green Arrows.
feel free to ask questions in comments section or PM. Good Luck.

I used the RSI Entry Points indicator in conjunction with a Support and Resistant, and trend following indicator I normally use, I ran a total of 62 tests within a 36 hour period at a hit rate of over 67%. The profitability was astounding to say the least... I only used 3 currency pairs with a 4HR time frame and only traded within the pairs "current" trend.... I have many indicators, (no EAs) and I have to say with all sincerity this is an easy to read, accurate RSI, combined with your regular use I believe would be profitable for any full time trader. -(with experience) Happy Trading, DTRH