G Cash IC Breaker order blocks

4.5

G-Ca$H IC Breaker

Automatic source and breaker order block indicator for MetaTrader 4 and MetaTrader 5. (This version is mt4)

For user guide please see the comments section.

Overview

Detects and draws two key zones from price structure across multiple timeframes: the Source order block where a directional move originates, and the Breaker order block where price confirms that structure has been invalidated. Works on any symbol — forex, metals, indices, crypto, or commodities.

What you see on the chart

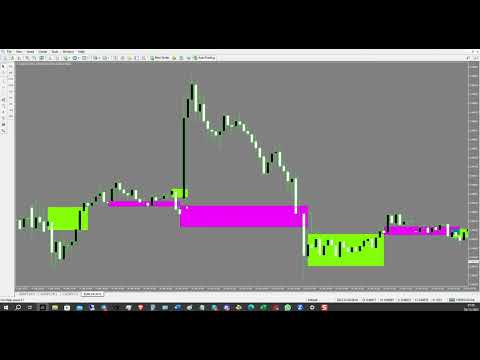
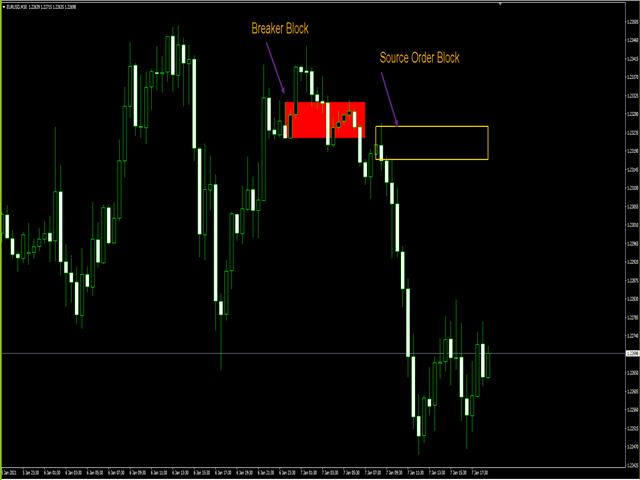
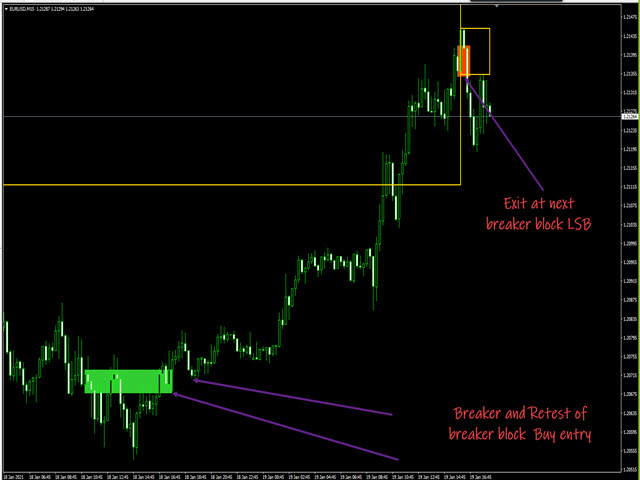
Source order block — drawn as an outlined rectangle (color per timeframe, default black). The right edge extends with the chart until the next structural event updates the anchor.

Breaker order block — drawn when price closes through the tracked level, converting the prior source zone into a breaker. Shown in the buy or sell breaker color (default green for bullish, red for bearish). Solid fill by default; switch to outline-only in the inputs.

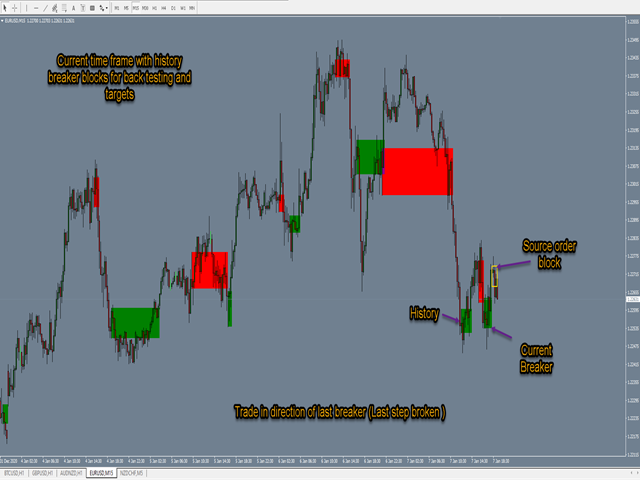
On a continuation, the source block re-anchors forward as price trends — older breakers remain fixed at the price band where they formed. On a directional flip, the former source becomes a breaker and a new source begins tracking the opposite bias.

Features

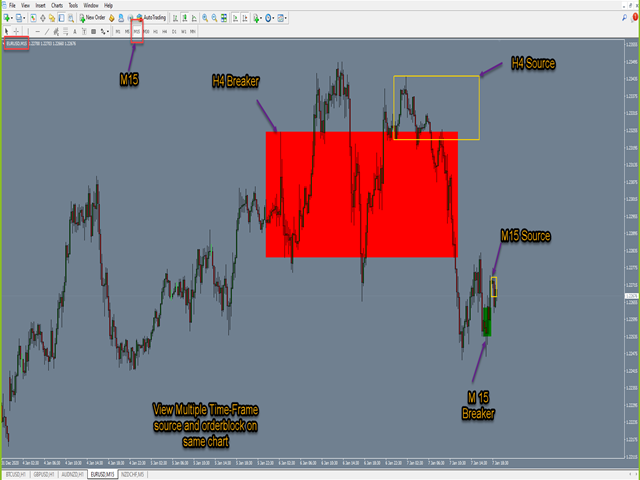
  • Multi-timeframe order blocks — view higher-timeframe zones on lower-timeframe charts
  • Per-timeframe toggle and independent color settings
  • Option to show only the current chart timeframe or all configured timeframes
  • Show current breaker only (clean chart) or keep historical breakers visible
  • Solid or outline breaker fill (configurable)
  • History depth control for faster loading
  • Customizable colors for source outline and bullish / bearish breakers

Alerts

  • New breaker formed — popup alert when a structural break is recognized
  • Return to breaker — optional alert when price crosses back through the prior source boundary
  • Email alerts available where the platform supports them
  • Alerts fire on live bars only; they do not trigger during history loading
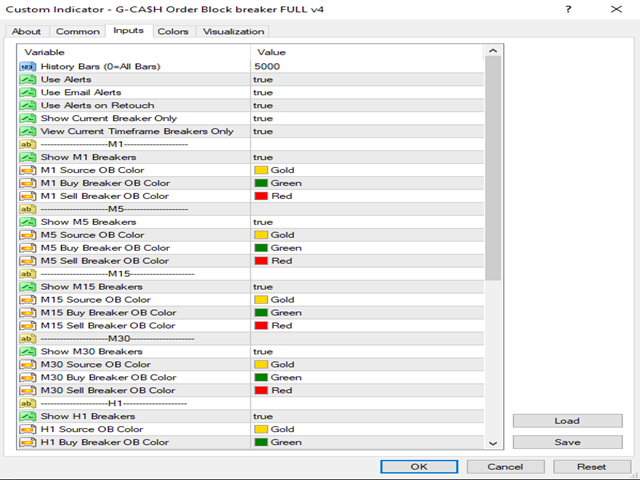
Inputs

  • HistoryBars — number of bars to process (0 for all available history)
  • ShowCurrentBreaker — true shows only the latest breaker per timeframe; false keeps past breakers on the chart
  • ViewCurrentTimeframe — restrict display to the chart timeframe only
  • SolidBreakerBlock — true for filled breakers, false for outline only
  • UseAlerts / UseEmailAlerts / UseAlertsOnTouch — control alert behavior
  • Per-timeframe color inputs for source, buy breaker, and sell breaker (M1 through MN1)

How to use

Attach to any chart. Order blocks appear automatically. Adjust timeframe visibility and colors in the inputs to match your chart style. A user guide with diagrams and a full setup walkthrough is included — see the Comments section below for the link.

Important

This is an analysis and visualization tool. It does not place or modify orders. Trading involves risk; use the indicator as part of your own plan and risk management.

Requirements

MetaTrader 4 or MetaTrader 5. Any broker, any symbol, any timeframe.

评分 5
goor311
493
goor311 2023.05.13 04:47 
 

GREAT indicator.But how do I get to the webinars?

man1980
2168
man1980 2021.04.16 02:09 
 

LOVE IT

orangeedge
239
orangeedge 2021.02.23 13:35 
 

Great indicator. Save me a lot of time and effort.

推荐产品
Volume Confirm Trend Zone is the indicator for filtering sideways and confirm trend to help your system trading. Indicator can use every currency pairs, every time frame, and every broker. You can see trend zone when color to change in volume indicator. Features When the color changes to the blue: Buy Zone is a strong trend. When the color changes to the red: Sell Zone is a strong trend.
Pointer View
Andrei Gerasimenko
The indicator marks the points on the chart where the standard ZigZag indicator has drawn its top or bottom. With this indicator, you can easily understand where the top or bottom was formed, and where it was redrawn. The indicator gives an alert when a new point appears. Warning! Parameter  Applied Price   -   expands the possibilities of building the indicator.   It is possible to build at OPEN, CLOSE and standard HIGH/LOW prices. Input parameters ----------- Depth   - period of the ZigZag ind
FREE
Forex Gump
Andrey Kozak
2.4 (5)
Forex Gump is a fully finished semi-automatic trading system. In the form of arrows, signals are displayed on the screen for opening and closing deals. All you need is to follow the instructions of the indicator. When the indicator shows a blue arrow, you need to open a buy order. When the indicator shows a red arrow, you need to open a sell order. Close orders when the indicator draws a yellow cross. In order to get the most effective result, we recommend using the timeframes H1, H4, D1. There
Reversal zones x2
Andrii Malakhov
The indicator looks for buying and selling zones, where a deal can be opened with a minimal stop loss and a better Risk Reward Ratio. The indicator is based on qualitative search of the Double top/Double bottom pattern. Indicator operation principle Looks for local tops/bottoms which can potentially become a Reversal zone It waits for an impulse movement that would exceed the Reversal zone and draws a red/blue wide rectangle Within the Reversal zone, it looks for the strongest area of the zone
Stratos Pali
Michela Russo
4.43 (7)
Stratos Pali Indicator   is a revolutionary tool designed to enhance your trading strategy by accurately identifying market trends. This sophisticated indicator uses a unique algorithm to generate a complete histogram, which records when the trend is Long or Short. When a trend reversal occurs, an arrow appears, indicating the new direction of the trend. Important Information Revealed Leave a review and contact me via mql5 message to receive My Top 5 set files for Stratos Pali at no cost! Dow
The trading statistics indicator notifies the trader of the aggregate income of the trading account for different time intervals. The indicator has wide display settings on the graph. There is a choice of one of the two display languages on the chart- English and Russian. Settings Indicator language (ENG, RUS) - Select the language to display on the chart; To control the magic (-1: any magic) - Entering the Magic for control (-1: any Magic); Angle of indicator tie - Selecting the angle of the c
Magical Arrow
Ranguni Abdulsamir Abdulmajid
Magical Arrow Indicator – Clear & Reliable Signals The Magical Arrow Indicator is a non-repainting, trend-following tool that gives you crystal-clear Buy and Sell signals . It  high-probability reversals and entries . No more guesswork – just follow the arrows on your chart! The Magical Arrow Indicator is a powerful, easy-to-use trading tool that helps you catch the most profitable Buy and Sell opportunities in the Forex market. It is designed for beginners and professional traders , giving y
Performance Analytics FX
Cesar Jose Perez Beltran
Performance Analytics 1.4 is an advanced real-time performance-tracking and risk-management indicator designed for traders who work with multiple EAs or simultaneous setups and need accurate, persistent, instance-separated metrics. It displays on-screen key statistics for both the entire account and the current EA, including profits, maximum losses, professional performance metrics, and smart alerts. The indicator visually divides the information into two independent blocks : 1. White Block – Ge
Diya The Light EA Diya The Light EA is a powerful averaging strategy Expert Advisor designed for consistent performance across all currency pairs and timeframes. With smart money management, customizable trading hours, spread/margin protection, and real-time profit tracking, it adapts to your trading style while maintaining control over risk. Ideal for both beginners and experienced traders, it supports 3 money management modes and adjustable lot sizes to match your capital and risk appetite. Pe
Trading Stats MT4
Frank Jose Olivo Flores
Stop wasting time digging through MT4/MT5 account statements to understand how your trading is performing. The Trading Stats Indicator puts every number you need — Win Rate, Avg Profit, Avg Loss, Risk:Reward Ratio, Expected Value, and Total Profit — right on the chart, updated live with every tick. Why Trading Stats Exists? Every serious trader eventually asks the same questions at the end of a session: How many trades did I take today? What was my average winner versus my average loser? Do I a
Gold Strength Index Pro
Pieter Gerhardus Van Zyl
Gold Strength Index Pro (GSI Pro)  is an indicator designed to analyze gold's strength across multiple currency pairs. It aggregates weighted price data from 7 XAU pairs (e.g., XAUUSD, XAUEUR) over a user-defined lookback period, calculating a composite strength value. Key features include: Color-Coded Histogram : Displays bullish (green) and bearish (red) - momentum based on a threshold zone (±0.2 default). Smoothed Lines : A gold-colored EMA (SmoothPeriod) reduces noise, while a DodgerBlue si
Breakeven Price
Vladimir Chiosa
Nowadays a lot of traders need to open more positions for the same pair, because one position is not usually the best possible position, thus a lot of trades are accumulated, sometimes with different lot sizes, and not easy to calculate the breakeven price of all opened positions, for solving this issue the Breakeven Price indicator was created. Breakeven Price is an MT4 indicator which calculates real time the breakeven price of all Buy & Sell positions opened by trader or EAs. It shows real ti
Shark Deal Book
Philip Pankaj Suthagar
4 (3)
Term  "shark"  in the business world denotes a high volume investor who just made a good investment in a highly Potential business deal.So, sharks are the ones who make the market move. In our case, if an American shark bought a Japanese company, he/she has to convert American dollars into Japanese yen to make the deal. So, the demand for the Japanese yen will increase sharply. Thus USD/JPY will go short rapidly if the deal was from the shark. Another example, In the case of forex, if fed increa
Introducing the POWER TRADE Indicator Created by a small group of experienced traders with years of profitable experience in the financial markets, the Power Trade Indicator is a plug-and-play trading tool designed to help traders spot high-quality setups with ease and confidence. What It Does: It provides powerful entry signals, profit-taking zones, and rebound areas — giving you a complete view of where price action is most likely to move next. The indicator reacts in real time, al
MajorAlert
Sergei Vassunov
MajorAlert - is a professional trading indicator for MetaTrader 4 that combines two distinct market analysis approaches into one powerful tool. By integrating a counter‑trend entry logic (upper block) with a trend‑following filter (lower block), the indicator generates high‑probability signals on the chart with clearly separated arrow colors. Key Features Fully self‑contained   – no external indicators required; all calculations are built‑in. Versatile inputs   – adjust all parameters to suit a
“动态交易震荡指标”是一款高级自定义加密货币外汇指标,适用于 MT4 平台,效率极高! - 新一代震荡指标 - 参见图片了解如何使用。 - 动态交易震荡指标具有自适应超卖/超买区域。 - 震荡指标是一款辅助工具,可帮助您从动态超卖/超买区域找到准确的入场点。 - 超卖值:低于蓝线,超买值:高于红线。 - 该指标也非常适合与价格行为模式结合使用。 - 它比标准震荡指标更精准。适用时间范围:30 分钟、1 小时、4 小时、1 天、1 周。 - 提供 PC 和移动端提醒。 ..................................................... 点击这里查看高质量的交易机器人和指标! 本产品为原创产品,仅在 MQL5 网站上提供。
Introduction Ultimate Arrows Prognosis is a unique indicator, in which the signals are actually rendered without delay! This fact, unlike other indicators, allows traders to respond to the current market situation and achieve to high quality and efficient analyzes. This indicator does not redraw and never changes the previous signals! And so, you know, that every signals, which is possible to see in history, will this unique indicator show exactly the same in the future. With this indicator,
Noize Absorption Index MT4
Ekaterina Saltykova
5 (1)
Noize Absorption Index - is the manual trading system that measures the difference of pressure between bears forces and bulls forces. Green line - is a noize free index that showing curent situation. Zero value of index shows totally choppy/flat market.Values above zero level shows how powerfull bullish wave is and values below zero measures bearish forces.Up arrow appears on bearish market when it's ready to reverse, dn arrow appears on weak bullish market, as a result of reverse expectation. S
FiboZigZag PRO
Jan Isaac Rodriguez Castro
FiboZigZag PRO — Precision Fibonacci with Trend Confirmation FiboZigZag PRO is an advanced trading indicator designed for traders who want precise entries using Fibonacci levels confirmed by market structure and institutional trend. This tool automatically combines: Confirmed ZigZag (real market structure) Automatic Fibonacci levels Daily EMA 34 (trend filter) Smart alerts at key levels KEY FEATURES Smart Automatic Fibonacci Automatically draws Fibonacci levels from confirme
我们为您提供一个指标"蜡烛收盘台",它将成为您在贸易领域不可或缺的助手。 这就是为什么知道蜡烛何时关闭会有所帮助的原因: 如果你喜欢使用蜡烛花纹进行交易,你就会知道蜡烛何时关闭。 此指标将允许您检查是否形成了已知模式以及是否存在交易的可能性。 该指标将帮助您做好市场开放和市场关闭的准备。 可以设置一个计时器来创建计划新闻的预览,这样就可以检查市场对此的反应。 您可以设置指示灯,以便在蜡烛关闭前几秒钟发送警报/警告。 通知/警报/警报可以发送到: 屏幕警报 电子邮件 移动应用 MT4烛台计时器指示器为什么有用 那么烛台计时器什么时候有用呢?如果你长期交易,你可能不需要蜡烛计时器指示器,因为你的参赛不会受到一分钟或一小时的太大影响。但是,如果你在短时间内是黄牛或交易员,那么你知道时机非常重要。 外汇市场24小时开放,只在周末关门,有些策略可能会受到您入仓时出现错误时机的严重影响。 MT4蜡烛计时器指示器可以显示当前蜡烛中的剩余时间,以便为下一次蜡烛打开做好准备。 可以从这一指标中受益的一些情况例子有: 预定消息传出 地理市场开闭 预定发生的事件,通常是金融、经济或政治事件
Gann Square of 144
Taras Slobodyanik
5 (6)
江恩箱(或江恩方)是一种基于 W.D. Gann 的“市场预测的数学公式”文章的市场分析方法。 该指标可以绘制三种正方形模型:90、52(104)、144。有六种网格变体和两种弧形变体。 您可以在一张图表上同时绘制多个方块 参数 Square — 江恩方格模型的选择: 90 — 90 的平方(或 9 的平方); 52 (104) — 52(或 104)的平方; 144 — 144的万能平方; 144 (full) — 正方形的“完整”版本,结合了其他正方形的线条。 据我们所知,W.D.江恩并没有这样的加价; for Arcs — 圆弧的简化正方形; Grid — 网格的变体: 4x4 (52) — 4 x 4 网格,52 个标记; 5x5 (40); 8x8 (90); 8x8 (104); 8x8 (144); 16x16 (144); 36x36 (144); disable — 禁用网格; Arcs — 弧线的变体: 4x4; 5x5; disable — 禁用弧; 开始时的方形参数: Length of Square, Bars (X-axis) — 正方形的长度(以条为
EZZ Zig Zag MT4
Paulo Rocha
5 (1)
EZZ Elite Zig Zag is an indicator for the MetaTrader 4 terminal. This indicator traces the peak of the trend based on the market reversal, thus showing various opportunities in the financial market. EZZ Elite Zig Zag is a visual tool, intuitive, and easy to understand and use.  Test it Yourself by Downloading it for Free. Author Paulo Rocha all rights reserved
我们的 Basic Support and Resistance 指示器是提高技术分析所需的解决方案。该指标允许您在图表/ MT5版本 功能 斐波那契水平的集成: 可以选择显示斐波那契水平以及支持和阻力水平,我们的指标使您对市场行为和可能的逆转区域有更深入的了解。 性能优化: 只能在每个栏的打开时更新扩展线,我们的指标可确保最佳性能,而无需牺牲支持和阻力级别的准确性。 输入 主设置 Timeframe:   通过此输入,您可以选择在图表上显示较高时间范围的支撑线和阻力线。 Support/Resistance Strength [Number of Bars]:  使用此输入,您可以确定支撑和电阻的强度。数量越高,支持/阻力越强。 Price mode: 此参数允许您选择哪种价格将用于计算支持和电阻水平。它可以是收盘价,最高价格,最低价格等。取决于您的策略和偏好,您可以选择最适合您需求的价格。 显示设置 Display Fibonacci levels: 此参数确定是否将显示斐波那契水平以及图表上的支持和电阻级别。斐波那契水平是技术分析中使用的关键水平,并使用斐波那契序列进行计算
FW 2WPR MTF
Sergey Zhukov
Indicator based trading according to the price analysis of bars, the most popular among traders. The indicators calculated based on larger periods are used for identification of a stable trend on the market, and the ones calculated based on smaller periods are used for entering the market after a correction. The oscillators with overbought and oversold levels have a special place in indicator-based trading. The values of such indicators are subjected to wave structure - the higher waves (chart t
Secret Liquidity Zones Indicator User Manual Introduction Unlock the power of hidden market opportunities with the Secret Liquidity Zones Indicator . This cutting‐edge tool is designed to reveal critical price levels where market momentum may shift. With its dynamic adaptability and sleek gold visuals, it offers clear and elegant insights into key trading opportunities—making it the perfect secret weapon for traders who demand precision and clarity. Key Features Dynamic Timeframe Adaptation: A
通过 Shepherd Numerology Levels 指标,探索一种革命性的交易方法。这一创新工具将古老的数理学智慧与尖端的交易技术相结合,帮助您在图表上识别关键的支撑和阻力水平。通过运用九宫格数理方法的力量,该指标为您提供了对市场动态的独特视角,使您能够做出更有根据的交易决策。 主要特点和优势: 九宫格数理学: Shepherd Numerology Levels 指标采用九宫格数理方法,这是一种经过时间验证的数理方法,揭示了价格运动中的隐藏模式。该方法以其准确性在预测潜在转折点和市场逆转方面享有盛誉。 精确的支撑和阻力水平: 借助 Shepherd Numerology Levels,您可以确定精确的支撑和阻力水平,这些可能在常规分析中不明显。这些水平基于数理学原则,为市场行为提供了新的视角。 动态价格区域: 该指标根据数理学计算为您提供了动态的价格区域。这些区域可作为潜在的决策点,价格趋势可能在这些区域发生转变,为您的交易策略提供优势。 视觉呈现: Shepherd Numerology Levels 指标在图表上直观地绘制了识别出的水平。这种图形化呈现简化了理解价格动态和
Hugo
Andriy Sydoruk
The indicator algorithm with the highest accuracy generates input signals using the arrows. Strategy for trading in a flat, all the necessary functions built into one tool! The principle of the indicator is to automatically determine the current state of the market when it is placed on a chart, analyze historical data, based on historical data and display instructions to the trader for further actions. The system itself shows in the form of arrows when to buy and when to sell.
Phase Analytics Pro: Advanced Cyclic Market Analyzer Phase Analytics Pro is a sophisticated technical tool designed for traders who prioritize mathematical precision over lag-heavy traditional indicators. Based on the principles of digital signal processing, this indicator decomposes price action into phase and quadrature components to identify the dominant market cycle. How it works: The algorithm calculates the instantaneous phase of the market, allowing it to distinguish between trending and
SMC Venom 模型 BPR 指標是針對在智慧貨幣 (SMC) 概念內工作的交易者的專業工具。它會自動辨識價格圖表上的兩種關鍵模式: FVG (公平價值缺口)是三根蠟燭的組合,其中第一根和第三根蠟燭之間存在缺口。它在水平之間形成一個沒有成交量支撐的區域,這通常會導致價格調整。 BPR (平衡價格區間)是兩種 FVG 模式的組合,形成一個「橋樑」 - 當價格以低成交量活動移動時,突破並返回到水平的區域,從而在蠟燭之間產生間隙。 這些模式可協助交易者透過分析圖表上的交易量和價格動態(大型市場參與者和普通參與者之間的互動)來識別關鍵的支撐/阻力位、突破區域和切入點。 此指標以矩形和箭頭的形式可視化模式,也支援靈活的警報設定。 主要特點: 模式顯示模式:選擇顯示 BPR 模式(看漲和看跌)或 FVG 模式(看漲和看跌)。 可以隱藏所有圖表分析模式。 以條數過濾:BPR 結構中 FVG 之間的最小/最大距離。 訊號的附加視覺化: 箭頭有 9 種類型可供選擇(標準、細、分形等)或手動輸入 Wingdings 代碼,其表格可以選擇性地顯示在圖表上。 使用 ATR 配置顏色、尺寸及其相對於價格
Visual River Flow Divergence Indicator MT4
AL MOOSAWI ABDULLAH JAFFER BAQER
Introducing the River Flow Divergence Indicator Are you ready to unlock your trading potential? Meet the River Flow Divergence Indicator, a powerful tool designed to help you navigate market trends and reversals with precision. This indicator is tailored for traders who are eager to fine-tune their strategies and take control of their success. Note: This indicator is not optimized out of the box. It’s crafted for you to customize and optimize according to your unique trading style and goals. Ho
该产品的买家也购买
Neuro Poseidon MT4
Daria Rezueva
4.94 (17)
Neuro Poseidon is a new indicator by Daria Rezueva. It combines precise trading signals with adaptive TP/SL levels - creating best possible trades as a result! Message me and get  Neuro Poseidon Assistant  as a gift to automize your trading process! What makes it stand out? 1. Proven profitability on all assets and timeframes 2. Only confirmed BUY and SELL signals present on the chart 3. Adaptive TP & SL levels generated by the software for each trade 4. Easy to understand - suitable for all
Scalper Inside PRO
Alexey Minkov
4.74 (68)
Scalper Inside PRO Scalper Inside PRO 是一款适用于 MetaTrader 4 的日内趋势与剥头皮指标,使用专有算法快速识别市场方向和关键目标价位。它能够自动计算进场价、出场价以及多级止盈目标,并显示详细的绩效统计,让您了解不同交易品种和策略以往的表现情况,从而帮助您为当前的市场环境选择最合适的交易工具。此外,您还可以将自己的箭头指标轻松接入 Scalper Inside PRO,快速评估其统计数据和历史表现。 该指标可用于任何交易品种和任何周期(建议在 M5 上进行日内交易),并内置多种交易策略,因此既可以作为独立的剥头皮工具使用,也可以作为您交易系统中功能强大的分析组件。 主要功能 通过专有算法(Next‑Generation Trend Detection Algorithm,NG TDA)快速识别当前市场趋势。 自动计算日内交易的进场价、出场价和多级止盈目标。 内置策略与统计模块,用于评估不同市场环境下各品种的表现。 支持接入自定义箭头指标(PRO 模式),并计算其详细信号统计数据。 适用于外汇、金属、指数、股票、商品、期货和加密货币等各类市
M1 Sniper
Oleg Rodin
5 (23)
M1 SNIPER 是一款易于使用的交易指标系统。它是一个专为 M1 时间框架设计的箭头指标。该指标可以作为独立的系统在 M1 时间框架下进行剥头皮交易,也可以作为您现有交易系统的一部分使用。虽然该交易系统专为 M1 时间框架交易而设计,但它也可以用于其他时间框架。我最初设计此方法是为了交易 XAUUSD 和 BTCUSD。但我发现这种方法在其他市场交易中也同样有用。 指标信号既可以顺势交易,也可以逆势交易。我教授一种特殊的交易技巧,帮助您利用指标信号进行双向交易。该方法基于使用特殊的动态支撑位和阻力位区域。 购买后,您可以立即下载 M1 SNIPER 箭头指标。此外,我还为所有 M1 SNIPER 工具用户免费提供下方屏幕截图所示的 Apollo Dynamic SR 指标!这两个指标的组合可以帮助您更轻松、更准确地利用 M1 时间框架进行交易。 购买后请联系我,免费获取交易提示和奖励指标! 祝您交易成功!
Gann Made Easy
Oleg Rodin
4.84 (164)
Gann Made Easy 是一个专业且易于使用的外汇交易系统,它基于使用先生理论的最佳交易原则。 W.D.江恩。该指标提供准确的买入和卖出信号,包括止损和获利水平。您甚至可以使用推送通知在旅途中进行交易。 购买后请联系我,即可免费获得交易指导和超棒的额外指标! 您可能已经多次听说过江恩交易方法。通常 Gann 的理论不仅对于新手交易者而且对于那些已经有一定交易经验的人来说都是非常复杂的东西。这是因为江恩的交易方法在理论上并不那么容易应用。我花了几年时间来完善这些知识,并将最好的原则应用到我的外汇指标中。 该指标非常易于应用。您所需要的只是将其附加到您的图表并遵循简单的交易建议。该指标不断进行市场分析工作并寻找交易机会。当它检测到一个好的入口点时,它会为您提供一个箭头信号。该指标还显示止损和获利水平。 换句话说,当您像先生一样进行交易时,该指标会为您提供最佳江恩建议。江恩亲自告诉你此时此刻该做什么。但最好的部分是您不需要了解任何有关江恩交易原则的知识,因为该指标会为您完成整个市场分析工作。
PRO Renko System
Oleg Rodin
5 (30)
PRO Renko Arrow Based System for trading renko charts.  准确的信号交易任何外汇工具. 另外,我将免费提供系统的附加模块! PRO Renko系统是RENKO图表上高度准确的交易系统。该系统是通用的。 该交易系统可应用于各种交易工具。 该系统有效地中和了所谓的市场噪音,打开了获得准确反转信号的通道。 该指标易于使用,只有一个参数负责产生信号。 您可以很容易地使算法适应您感兴趣的交易工具和renko酒吧的大小。 我很乐意通过提供任何咨询支持来帮助所有客户有效地使用该指标。 祝您交易成功!购买后,立即写信给我! 我将与您分享我的建议和我的renko发电机。 另外,我将免费提供系统的附加模块!
Trend Catcher ind
Ramil Minniakhmetov
趨勢捕捉指標 趨勢捕捉指標結合了作者獨有的客製化自適應趨勢分析指標,用於分析市場價格趨勢。它透過過濾掉短期噪音,並專注於潛在的動能強度、波動性擴張和價格結構行為,來識別真實的市場方向。此外,它還結合了平滑和趨勢過濾等客製化指標,例如移動平均線、相對強弱指標 (RSI) 和波動率過濾器。 您可以在這裡查看實際運行情況以及我的其他產品: https://www.mql5.com/en/users/mechanic/seller 請注意,我不會在 Telegram 上出售 EA 或任何設置,那是騙局。所有設定都可以在我的部落格上免費取得。 重要提示!購買後請立即聯繫我,以獲取使用說明和額外獎勵! 請注意,我不會在 Telegram 上出售 EA 或任何設置,那是騙局。所有設定都可以在我的部落格上免費取得。
Trend Lines PRO
Roman Podpora
5 (1)
TREND LINES PRO 帮助您了解市场真正的方向转变点。该指标显示真实的趋势反转点以及主要参与者重新入场的时机。 您可以看到 BOS线、 趋势变化和更高时间框架的关键水平——无需复杂的设置或不必要的干扰。信号不会重绘,并在K线收盘后仍然保留在图表上。 VERSION MT 5    -   与……搭配使用时,可发挥其最大潜力   RFI LEVELS PRO 指示器 该指标显示的内容: 实际变化 趋势(BOS 线) 一旦信号出现,它就始终有效!这与会重绘的指标有着重要的区别,后者可能会发出信号后又改变信号,从而导致资金损失。现在,您可以更精准、更准确地进入市场。此外,还有一个功能,会在箭头出现后为K线着色,直到达到目标价位(止盈)或出现反转信号为止。 重复条目   以及主要玩家的充值 为了提高寻找入场点时的视觉清晰度,我们创建了一个模块,该模块首先显示买入/卖出区域,并在该区域内寻找最佳入场点。此外,我们还加入了智能逻辑来管理止损位,该逻辑会随着时间的推移逐步降低止损位的大小,从而降低入场交易时的初始风险(移动止损位)。 信号强度水平(BOS) 该指标采用三个显著性等级来衡量
Enigmera
Ivan Stefanov
5 (8)
ENIGMERA: 市场的核心 重要提示:MQL5.com 演示版本在策略测试器中运行,可能无法完全反映 Enigmera 的功能。请查看描述、截图和视频了解详细信息。如有任何问题,请随时联系我! 该指标的代码已完全重写。版本 3.0 增加了新功能并修复了自指标发布以来积累的错误。 简介 这个指标和交易系统是金融市场的一种独特方法。ENIGMERA 使用分形周期来精确计算支撑和阻力水平。它展示了真实的积累阶段,并提供了方向和目标。无论是在趋势中还是在修正中,这个系统都能工作。 它是如何工作的 指标的大部分功能通过图表左侧的按钮控制,使得能够快速响应不同的市场情况。 按钮 ON/OFF – 显示或隐藏整个指标。 Channel – 激活支撑通道,显示可接受的偏差范围。 Dev1 (第一偏差) – 指示价格在支撑偏差内的波动,信号表示市场正在整合或积累力量。 Dev2 (第二偏差) – 显示价格在偏差之间的波动,表示趋势形成和方向。 Dev3 (第三偏差) – 表示趋势的显著加速和高波动性。 45deg (45度) – 显示市场的节奏和相对于 45 度线的运动稳定性。 Tgt1/2
Dynamic Forex28 Navigator
Bernhard Schweigert
4.43 (7)
Dynamic Forex28 Navigator - 下一代外汇交易工具。 当前 49% 折扣。 Dynamic Forex28 Navigator 是我们长期流行的指标的演变,将三种功能合二为一: 高级货币强度 28 指标 (695 条评论)+ 高级货币 IMPULSE 带警报 (520 条评论)+ CS28 组合信号(奖励)。 有关指标的详细信息 https://www.mql5.com/en/blogs/post/758844 下一代强度指标提供什么? 您喜欢的原始指标的一切,现在通过新功能和更高的精度进行了增强。 主要特点: 专有货币强度公式。  所有时间范围内的平滑和准确的强度线。 非常适合识别趋势和精确进入。 动态市场斐波那契水平(市场斐波那契)。  此指标独有的独特功能。 斐波那契应用于货币强度,而不是价格图表。 适应实时市场活动以获得准确的反转区域。 实时市场动量。  第 9 行显示市场是活跃还是被动。 对于定时交易至关重要。 全面的警报和显示。  每种货币最强的买入和卖出动量。 ​​28 对的双重动量买入和卖出。 超买/超卖警告外部范围和止损。 反转
Genesis Matrix Pro is a professional multi-timeframe trend detection indicator designed to help traders identify high-quality market alignment with clarity and structure. It combines 12 different technical indicators into one visual alignment matrix, allowing traders to quickly see when market conditions are bullish, bearish, or neutral. A signal is generated only when the selected strategies are aligned, helping reduce noise and improve decision-making. PLEASE CONTACT ME AFTER PURCHASE TO GET
本指标是实践实战交易完善的波浪自动分析的指标 !  案例... 注: 波浪分级用西方叫法不习惯,因受到缠论(缠中说禅)命名方式习惯的影响,我是将基础波浪命名为 笔 ,将二级波段命名为 段 ,同时具有趋势方向的段命名为 主趋段 (以后笔记中都是这种命名方式,先告知大家),但是算法上和缠论关系不大切勿混淆.反映的是本人分析盘面总结的 千变万化纷繁复杂的运行规律 . 对波段进行了标准化定义,不再是不同人不同的浪  ,   对人为干扰的画法进行了排除,在严格分析进场起到了关键的作用 . 使用这个指标,等于将交易界面提升美感,抛弃最原始的K线交易带你进入新的交易层次.如果不是为了交易,在宣传上也将使客户观感提升层次. 指标内容: 1. 基础波浪 (笔) : 首先我们找出了价格波动过程中的基础波动拐点,当然他的有序性低,为下一步的计算提供基础. 2. 二级波段( 段 ) :在基础波浪的基础上,通过算法分析得到层级更明显的二级波段,二级波段为波浪提供了分析基础 3. 波浪( 浪 ): 有着更清晰的趋势,更清晰直观的方向.分析一个波浪是否延续,需要看二级波段的形态,分析二级的构成,可以得出波浪后
RFI levels PRO
Roman Podpora
5 (1)
该指标能够准确显示反转点和价格回落区域。     行业领军人物 。您能洞察新趋势的形成,并以最高的精准度做出决策,掌控每一笔交易。 与……结合时,展现其最大潜力     趋势线专业版   指标  VERSION MT5 该指标显示的内容: 新趋势开始时的反转结构和反转水平及其激活。 显示屏   获利了结   和   止损   风险回报比最低的水平     RR 1:2       。 具有智能减值逻辑的止损。 显示指定指标中两种趋势类型的反转形态。 指标: 根据     趋势线     (全球趋势变化) 潮流专业版     (趋势快速变化) 简单有效   扫描器   实时趋势(新增)。 多时间框架工具筛选。 展示   利润   在 LOGIC AI 信号之后。 以下列出今日走势积极的金融工具。(RB键) 能够为终端启用通知(警报)功能,并向移动设备推送通知。 逻辑人工智能     — 利用人工智能寻找最佳切入点。 只有在启用 MTF(多时间框架分析)模式时,该功能才可用。 兼容性。 当与趋势线指标结合使用时,该指标能发挥其最大潜力。 这     RFI LEVELS PRO    
本产品已针对 2026 年市场进行更新,并针对最新 MT5 版本进行了优化。 价格更新通知: Smart Trend Trading System 目前价格为 $99 。 接下来的 30 次购买 后,价格将上涨至 $199 。 特别优惠: 购买 Smart Trend Trading System 后,请发送私信给我,即可免费领取 Smart Universal EA ,并将您的 Smart Trend 信号转换为自动交易。 Smart Trend Trading System 是一套完整的交易系统,具备不重绘、不回绘、不延迟的特点,专为希望获得更清晰信号、更准确趋势方向以及更有组织交易方式的交易者打造。 Online course , manual and download presets . 它将 10 多种交易工具 整合到一个系统中,包括趋势检测、反转区域、Smart Cloud、移动止损逻辑、支撑与阻力、K线着色、提醒以及多周期分析。 该系统旨在帮助您应对不同的市场环境: 趋势市场: 识别主要趋势,发现回调,跟随动能,并通过止损指导和移动止损选项寻找更清晰的入场机会。 震荡
MTF Supply Demand Zones
Georgios Kalomoiropoulos
4.82 (22)
下一代自动化供需区。适用于任何图表的创新算法。所有区域都是根据市场的价格行为动态创建的。 两种类型的警报 --> 1) 当价格触及区域时 2) 当新区域形成时 你不会再得到一个无用的指标。您将获得一个完整的交易策略和经过验证的结果。     新的功能:     价格触及供需区时发出警报     创建新的供应/需求区时发出警报     推送通知警报     以点为单位的区域宽度标签     关于 MTF 的又一个时间表。因此,现在您将能够看到高于当前 3 个时间帧,而不是高于当前 2 个时间帧     启用/禁用警报/区域/MTF 功能的按钮 您获得的优势:     消除交易中的情绪。     客观化您的交易条目。     通过高概率设置提高您的利润。     节省绘图区域的时间。     像专业人士一样交易金融市场。     任何市场的即时多时间框架分析。 你在图表上看到了什么?     蓝色和红色矩形是当前时间范围的供需区。     虚线样式线是当前上方第一个时间范围内的供需区域。     实线样式线是当前上方第二个时间范围内的
Step into the world of Forex trading with confidence, clarity, and precision using   Gold Indicator   a next-generation tool engineered to take your trading performance to the next level. Whether you’re a seasoned professional or just beginning your journey in the currency markets, Gold Indicator equips you with powerful insights and help you trade smarter, not harder. Built on the proven synergy of three advanced indicators, Gold Indicator focuses exclusively on medium and long-term trends eli
Entry Points Pro
Yury Orlov
4.59 (174)
这是一款 MT4 的趋势指标,可提供准确的入场交易信号,且无重绘或延迟。 它可应用在任何金融资产:外汇、加密货币、贵金属、股票、指数。 最好的结果出现在 M15+ 的时间帧内。 指标的 MT5 版本 重要! 购买后请联系我,以便获取详细指南和奖励。 视频 (6:22) - 一个信号赢取的利润等于指标价格的三倍。 视频 (4:44) - 它如何在测试器中工作,我的提示和技巧。 视频 (1:44) - 有关它如何处理加密货币和指数的几句话。 大多数交易者在 Entry Points Pro 指标的帮助下,在第一个交易周内就改善了他们的交易结果。 Entry Points Pro 指标的益处 入场信号无重绘或延迟 如果信号出现,并得到确认(如果信号所在烛条已收盘),则它不会再消失;不像是重绘指标,它会导致重大的财产损失,因为它们可以在显示信号后再将其删除。 无差错开仓 指标算法可令您找到入场交易(买入或卖出资产)的理想时机,从而提高每位交易者的成功率。 Entry Points Pro 可操作任何资产 它允许您在 MT4 平台上交易任何经纪商提供的加密货币、股票、金属、指数、商品
MetaBands M4
Vahidreza Heidar Gholami
3.5 (6)
MetaBands使用强大且独特的算法绘制通道并检测趋势,以便为交易者提供进出交易的潜在点。它是一个通道指标和强大的趋势指标。它包括不同类型的通道,可以通过使用输入参数简单地合并以创建新通道。MetaBands使用所有类型的警报通知用户市场事件。 功能 支持大多数通道算法 强大的趋势检测算法 能够合并不同类型的通道 多时间帧和多货币(信号矩阵) 所有类型的警报功能(声音、屏幕闪烁、推送通知、电子邮件、弹出窗口、箭头) 它永远不会重绘 趋势检测 MetaBands使用在通道内振荡的蓝色线来检测趋势。当该线遇到通道的上界时,表明开始下跌趋势,当它遇到下界时,表明开始上涨趋势。如果蓝线接近中线,则市场处于整理期。 该指标使用独特的方法来检测趋势。一开始可能看起来有些复杂,但如果您观看视频教程,您就会意识到它是多么强大且易于使用。 入场和出场信号 当趋势变化或价格穿过上下通道时,MetaBands会立即通过不同的方法提醒交易者,这些方法可以在指标设置中启用。 信号矩阵 要监视来自不同时间框架的多个符号并在一个地方查看信号,请单击右上角按钮或按键盘上的M键以打开信号矩阵。该矩阵可以快速概览
M30/H1/H4 波段版已上线 想抓住M5/M15无法捕捉的大行情? Gold Signal Swing Pro(M30/H1/H4)现已发售。 目标每笔$20-$80+。 https://www.mql5.com/en/market/product/177643 KURAMA GOLD SIGNAL PRO(MT4版)— 7层过滤器、自动TP/SL、品质评分搭载 XAUUSD完整交易系统 不重绘。不重画。不延迟。每个信号永久固定。所见即所得。 福利:购买买断版许可证可免费获得 AI Zone Radar(价值$59)+ 完整PDF手册。购买后请给我发消息。 AI Zone Radar: https://www.mql5.com/en/market/product/175834 交易员的信赖:已被活跃的黄金交易员社区使用。因精度和易用性获得赞誉。 你的问题 — 以及解决方案 你知道黄金每天波动$30-50。你知道这里有钱可赚。但是: - 入场过早,价格反向$10后才朝你的方向走 -
Current event:  https://c.mql5.com/1/326/A2SR2025_NoMusic.gif A. 什么是 A2SR ?   * 这是一个领先的技术指标(没有重绘,没有滞后)。  -  指导 : -- 在  https://www.mql5.com/en/blogs/post/734748/page4#comment_16532516 -- 和  https://www.mql5.com/en/users/yohana/blog A2SR 在确定支撑(需求)和阻力(供应)水平方面有一种特殊的技术。 与我们在网上看到的普通方式不同,A2SR 在确定实际 SR 级别时有一个独创的概念。 原技术不是从网上拿来的,也没有在网上公开过。 A2SR 将根据您的交易风格自动选择 SR 级别。 即使您正在更改时间范围,但 SR 级别仍将保留在其位置上。 因为实际的 SR 不是从你使用的时间范围内获得的。 A2SR 拥有完整的交易工具 。 实际支持(需求)和阻力(供应)的真正概念。 新闻事件和央行讲话的市场情绪。 新闻事件和趋势的主要货币强度 (MCS) 的真正概念
Market Structure Patterns MT4
Samuel Manoel De Souza
5 (18)
Market Structure Patterns   is an indicator based on   smart money concepts   that displays   SMC/ICT   elements that can take your trading decisions to the next level. Take advantage of the   alerts ,   push notifications   and   email messages   to keep informed from when an element is formed on the chart, the price crosses a level and/or enters in a box/zone. Developers can access the values of the elements of the indicator using the   global variables  what allows the automation of trading d
BTMM State Engine Pro MT4
Garry James Goodchild
BTMM State Engine Pro is a MetaTrader 4 indicator for traders who use the Beat The Market Maker approach: Asian session context, kill zone timing, level progression, peak formation detection, and a multi-pair scanner from a single chart. It combines cycle state logic with a built-in scanner dashboard so you do not need the same tool on many charts at once. What it does Draws the Asian session range; session times can follow broker server offset or be set in inputs. Tracks level progression (L
Quant Direction
Georgios Kalomoiropoulos
Quant Direction 是一款三维市场分析工具。它通过同时计算多个维度上的精确百分比偏差,提供完全客观的、基于算法的市场分析视角。该算法采用先进的人工智能建模工具开发,并经过全面测试,旨在以独特的精准度解读市场。它可以分析您平台上的任何货币对或金融工具。 无论您是短线 交易者、日内 交易者还是波段交易者,Quant Direction 都是您的理想之选。 交易者的真正优势 Quant Direction 的真正优势在于彻底消除情绪、屏幕疲劳和过度思考。它无需手动点击十几个图表来寻找方向并反复质疑自己的偏好,引擎即可在几毫秒内即时处理 8 个时间周期(从 5 个月到月线)。它能准确告诉你任何时刻谁在掌控市场,确保你始终朝着概率最高的方向进行交易。 市场分析的三个维度 该算法将市场分为三个不同的交易维度,为您提供完整的宏观和微观视角: 超短线交易分析: 捕捉即时、快速的动量变化和较低时间框架的执行点。 日内分析: 识别真实的、潜在的每日方向性偏差。 波动分析: 专注于宏观趋势,确保您不会与大盘机构的走势背道而驰。 独家评分引擎 Quant Direction 的底层采用了一套
FX Power MT4 NG
Daniel Stein
4.95 (21)
FX Power:分析货币强度,助您做出更明智的交易决策 概述 FX Power 是一款专业工具,帮助您全面了解主要货币和黄金在任何市场条件下的真实强度。通过识别强势货币用于买入,弱势货币用于卖出, FX Power 简化了交易决策,并帮助您发现高概率的交易机会。不论您是想跟随趋势还是通过极端的 Delta 值预测反转,这款工具都能完美适应您的交易风格。别再盲目交易——用 FX Power 让您的交易更加智慧。 1. 为什么 FX Power 对交易者极具价值 实时货币和黄金强度分析 • FX Power 实时计算并显示主要货币和黄金的相对强度,助您全面了解市场动态。 • 监控领先或落后资产,轻松识别值得交易的货币对。 全面的多时间框架视图 • 跟踪短期、中期和长期时间框架的货币和黄金强度,以便将您的交易策略与市场趋势保持一致。 • 无论是快进快出的短线交易还是更长期的投资策略, FX Power 都能为您提供所需的信息。 Delta 动态分析用于趋势和反转 • 极端 Delta 值常常预示反转机会,而平缓的 Delta 变化则确认趋势延续。 • 使用 Delta 分析,轻
NAM Order Blocks
NAM TECH GROUP, CORP.
3.67 (3)
MT4多時限訂單塊檢測指示器。 特徵 -在圖表控制面板上完全可自定義,提供完整的交互。 -隨時隨地隱藏和顯示控制面板。 -在多個時間範圍內檢測OB。 -選擇要顯示的OB數量。 -不同的OB用戶界面。 -OB上的不同過濾器。 -OB接近警報。 -ADR高低線。 -通知服務(屏幕警報|推送通知)。 概括 訂單塊是一種市場行為,它指示從金融機構和銀行收取訂單。著名的金融機構和中央銀行帶動了外匯市場。因此,交易者必須知道他們在市場上正在做什麼。當市場建立訂單塊時,它會像發生大多數投資決策的範圍一樣移動。 訂單建立完成後,市場將朝著上升和縮小的方向發展。訂單大宗交易策略的關鍵術語是它包括機構交易者正在做的事情。由於它們是主要的價格驅動因素,因此包括機構交易在內的任何策略都可以。 您將在任何時間範圍內實時看到訂單塊,使用我們的控制面板,您將能夠在所選的歷史記錄週期內檢測常規,拒收和未大寫的訂單塊。 現在您可以接收到訂單塊接近警報,我們在MT4上顯示屏幕通知,並將通知推送到您的手機!
PowerBall Signals
Oleg Rodin
5 (4)
PowerBall 信号是基于使用支撑/阻力区域理念的买入/卖出信号指标。该指标根据支撑/阻力区域检测特殊反转模式,并在图表上提供这些信号。该指标的主要思想是使用 MTF(多时间框架)分析,并根据当前和下一个更高时间框架的水平提供信号。这种方法可以预测任何市场上可能的价格逆转,无论是货币、金属、指数甚至加密货币。 事实上,您绝对可以在任何市场进行交易。 除了反转信号之外,该指标还提供趋势延续信号,让您在交易过程中紧跟趋势。该指标对外汇和二元期权交易者都有帮助。您可以选择是否要在 NON-MTF 或 MTF 模式下使用该指标。您还可以选择要从中获取数据以生成信号的源时间范围。 购买后请联系我以获得我的交易提示和丰厚奖金! 祝您交易愉快、盈利!
Auto Optimized Parabolic RSI: 高级 3D 动量引擎 大多数零售指标之所以失效,是因为它们依赖于静态输入,一旦市场波动率发生变化,这些输入就会崩溃。Auto Optimized Parabolic RSI 通过不断重新计算自身的数学优势,解决了“指标衰退”的问题,将机构级别的量化自适应能力直接引入您的 MT5 终端。 核心优势:定制的内存 3D 优化   标准的自动优化器通常会导致 MT5 平台卡顿,因为它们通过标准的指标调用使终端超载。该工具完全绕过了这些性能瓶颈。内部引擎采用定制的原生基于 RAM 的计算器构建,每次加载图表或更改时间周期时,它都会执行极速的 3D 网格搜索。它同时扫描 RSI 周期(频率)、SAR 步长(加速度)和 SAR 最大值(速度限制),在绝对的毫秒级时间内测试数以万计的参数组合,且完全不会拖慢您的平台。它不是仅仅寻找一个“不错”的设置,而是映射整个参数空间,以寻找资产当前动量结构的绝对全局最大值。 严格的财务评分与逼真的交易模拟   与基于抽象“指标点数”进行优化评分的业余工具不同,该引擎的 3.10 版本严格与资金数学挂钩。每
Volume Master
Mohamed Hassan
Volume Master – Real-Time Market Power Indicator See who’s in control of the market: buyers or sellers in real time. Volume Master is a powerful trading tool designed to give you a clear edge by visualizing bull vs bear activity across multiple symbols, while helping you confirm high-probability entries directly on your chart. WHAT MAKES VOLUME MASTER DIFFERENT? Unlike traditional volume indicators, Volume Master doesn’t just show volume — it shows market dominance. Real-Time Bull vs Bear Activi
GoldRush Trend Arrow Signal
Kirk Lee Holloway
5 (2)
GoldRush 趨勢箭頭信號 GoldRush 趨勢箭頭信號 指標為 XAU/USD 中的高速、短期短線交易者提供精確、實時的趨勢分析。 專為1分鐘時間框架設計,此工具顯示方向箭頭以明確顯示入場點,使短線交易者能在波動市場中自信操作。 該指標包含主要和次要警示箭頭。主要信號為白色和黑色方向箭頭,用於指示趨勢方向的轉變;次要信號為藍色和紅色箭頭,用於確認主要箭頭指示的方向並提示潛在交易入場點。 注意:當趨勢方向發生變化後僅出現一個主要警報箭頭時,請注意可能會出現多個次要藍/紅箭頭。次要信號將在滿足信號標準的任何蠟燭圖後出現,因此在長期趨勢移動中,螢幕上將顯示大量次要箭頭(如附帶的截圖所示)。您可在設置中開啟或關閉任一箭頭類型。 以下是我使用此指標進行交易的方式: - 對於買入入場,我會耐心等待白箭頭在蠟燭收盤時出現,並在下一根可用蠟燭收盤時出現藍箭頭時進行買入交易。 - 對於賣出入場,我會耐心等待黑箭頭在蠟燭收盤時出現,並在下一根可用蠟燭收盤時出現紅箭頭時進行賣出交易。 - 獲利了結/止損設置由使用者自行負責,但我個人使用最低R:R為1:2,並發現這在倫敦/紐約開盤等
PZ 123 Pattern
PZ TRADING SLU
1 (1)
123模式 是最受欢迎,功能强大和灵活的图表模式之一。该模式由三个价格点组成:底部,峰值或谷值以及38.2%至71.8%之间的斐波纳契回撤位。当价格突破最后一个峰值或谷值时,该形态被认为是有效的,此时指标绘制箭头,发出警报并可以进行交易。 [ 安装指南 | 更新指南 | 故障排除 | 常见问题 | 所有产品 ] 清除交易信号 可自定义的颜色和尺寸 实施绩效统计 可定制的斐波那契回撤水平 显示适当的止损和获利水平 该指标可用于查找连续或反转形态 它是不可重涂和不可重涂的 它实现了电子邮件/声音/视觉警报 123模式 可以表现为连续或反转模式。为了简化操作,该指标使您可以选择要寻找哪种类型的形态,使其成为趋势或反转交易者的绝佳工具。 设置 将指标加载到任何图表时,将显示一组选项作为输入参数。如果您认为它们太多,请不要感到失望,因为参数被分组为不言自明的块。这就是每个参数块的作用。 幅度-幅度表示替代价格点之间的最小柱线量。要找到大图案,请增加幅度参数。要查找较小的模式,请减小幅度参数。 闵。回撤-形态中所需的最小斐波那契回撤。设置为零不对其进行评估。 最大。回撤-形态中可能的最大斐
Bull versus Bear
Mohamed Hassan
4.5 (18)
Send us a message after your purchase to receive more information on how to get your  BONUS  for FREE  that works in great combination with Bull vs Bear ! Bull versus Bear is an easy-to-use Forex indicator that gives traders clear and accurate signals based on clear trend retests . Forget about lagging indicators or staring at charts for hours because  Bull vs Bear provides real-time entries with no lag and no repaint, so you can trade with confidence. Bull vs Bear  helps you enter trades during
作者的更多信息
Btmm state engine pro
Garry James Goodchild
5 (5)
BTMM State Engine Pro is a MetaTrader 5 indicator for traders who use the Beat The Market Maker approach: Asian session context, kill zone timing, level progression, peak formation detection, and a multi-pair scanner from a single chart. It combines cycle state logic with a built-in scanner dashboard so you do not need the same tool on many charts at once. What it does Draws the Asian session range; session times can follow broker server offset or be set in inputs. Tracks level progression (L
BTMM State Engine Pro MT4
Garry James Goodchild
BTMM State Engine Pro is a MetaTrader 4 indicator for traders who use the Beat The Market Maker approach: Asian session context, kill zone timing, level progression, peak formation detection, and a multi-pair scanner from a single chart. It combines cycle state logic with a built-in scanner dashboard so you do not need the same tool on many charts at once. What it does Draws the Asian session range; session times can follow broker server offset or be set in inputs. Tracks level progression (L
Smart Market Structure Toolkit
Garry James Goodchild
5 (1)
Smart Market Structure Pro is a complete Smart Money Concepts and ICT indicator that maps institutional order flow on any chart, any timeframe, for MetaTrader 5 and MetaTrader 4. Please see the comments section for the full user guide  Attach it to a chart and the indicator draws Break of Structure (BOS), Change of Character (CHoCH), Order Blocks, Fair Value Gaps, Liquidity Sweeps, Premium/Discount zones, ICT session windows, and a real-time Confluence Score from 0 to 10 — all controlled from a
G-Labs Advanced Market Maker Dashboard for MetaTrader 5 is a multi-symbol chart indicator that shows a full BTMM-style workflow: average daily range expansion, price formation, intraday structure, breaker blocks, momentum, divergence, and stop-hunt context across many pairs from one chart. It is designed for traders who use Beat The Market Maker (BTMM) ideas: market structure, cycle stage, and liquidity behaviour, with a single dashboard instead of flipping charts. Brief overview The indicato
Market Maker Dashboard by G labs
Garry James Goodchild
4.6 (10)
G-Labs Market Maker Dashboard — BTMM multi-pair scanner (Peak Formation, ADR cycle, Asian range, stop hunt, RSI) Stop guessing which pairs are “in cycle.” This dashboard scans your watchlist in real time and shows where each symbol sits in a Banks Track Market Maker (BTMM) style workflow: Peak Formation context (PFH / PFL), expansion measured in ADR multiples, Asian session range behaviour, stop-hunt proximity signals, today’s range versus ADR, and M15 RSI for timing. One panel replaces a wall o
Magic lines mt5
Garry James Goodchild
MagicLines MT5 — Multi-Currency Cycle and Trend Dashboard MagicLines is a multi-currency indicator and dashboard for MetaTrader 5. It combines Heikin-Ashi cycle detection, two dynamic trend lines, and a multi-pair scanner into one chart tool. It generates signal suggestions with entry, stop loss, and take profit levels across multiple pairs from a single chart. How It Works MagicLines uses three analysis layers together: Heikin-Ashi Cycle Logic identifies whether each pair is in an up or down c
G Labs Trade Manager
Garry James Goodchild
G-Labs Trade Manager is a professional on-chart trading panel for MetaTrader 4. It helps you plan trades, size positions from risk, manage open trades, and stay informed — while you stay in control of every decision. It is a trading utility, not a black-box signal or automated strategy. WHO IT IS FOR • Traders who want one place to set stop loss, take profit, and risk before clicking buy or sell. • Anyone who trades manually or semi-manually and wants faster execution and clearer risk. • Users w
G-Labs Advanced Market Maker Dashboard for MetaTrader 4   is a multi-symbol chart indicator that shows a full BTMM-style workflow: average daily range expansion, price formation, intraday structure, breaker blocks, momentum, divergence, and stop-hunt context across many pairs from one chart. It is designed for traders who use Beat The Market Maker (BTMM) ideas: market structure, cycle stage, and liquidity behaviour, with a single dashboard instead of flipping charts. Brief overview The indicato
Connix MT5
Garry James Goodchild
5 (1)
Connix SMC — Smart Trading Dashboard & Scanner Multi-Timeframe · Smart Money Concepts · ICT · Order Blocks · FVGs · BoS/CHoCH · VWAP Connix SMC is a professional Smart Money Concepts (SMC) and ICT trading dashboard for MetaTrader 5. It scans multiple currency pairs across multiple timeframes simultaneously and displays the status of key market structure elements in a single interactive dashboard — while drawing those structures live on your chart. Built by G-Labs for traders who work with SMC,
Smart Market Structure Pro is a complete Smart Money Concepts and ICT indicator that maps institutional order flow on any chart, any timeframe, for MetaTrader 5 and MetaTrader 4. Please see the comments section for the full user guide  Attach it to a chart and the indicator draws Break of Structure (BOS), Change of Character (CHoCH), Order Blocks, Fair Value Gaps, Liquidity Sweeps, Premium/Discount zones, ICT session windows, and a real-time Confluence Score from 0 to 10 — all controlled from an
Connix SMC — Smart Trading Dashboard & Scanner Multi-Timeframe · Smart Money Concepts · ICT · Order Blocks · FVGs · BoS/CHoCH · VWAP Connix SMC is a professional Smart Money Concepts (SMC) and ICT trading dashboard for MetaTrader 5. It scans multiple currency pairs across multiple timeframes simultaneously and displays the status of key market structure elements in a single interactive dashboard — while drawing those structures live on your chart. Built by G-Labs for traders who work with SMC,
G-Labs Market Maker Dashboard — BTMM multi-pair scanner (Peak Formation, ADR cycle, Asian range, stop hunt, RSI) Stop guessing which pairs are “in cycle.” This dashboard scans your watchlist in real time and shows where each symbol sits in a Banks Track Market Maker (BTMM) style workflow: Peak Formation context (PFH / PFL), expansion measured in ADR multiples, Asian session range behaviour, stop-hunt proximity signals, today’s range versus ADR, and M15 RSI for timing. One panel replaces a wall o
G-Ca$H IC Breaker Automatic source and breaker order block indicator for MetaTrader 4 and MetaTrader 5. (This version is mt5) For user guide please see the comments section. Overview Detects and draws two key zones from price structure across multiple timeframes: the Source order block where a directional move originates, and the Breaker order block where price confirms that structure has been invalidated. Works on any symbol — forex, metals, indices, crypto, or commodities. What you see on the
G-Labs Trade Manager is a professional on-chart trading panel for MetaTrader 5. It helps you plan trades, size positions from risk, manage open trades, and stay informed — while you stay in control of every decision. It is a trading utility, not a black-box signal or automated strategy. WHO IT IS FOR • Traders who want one place to set stop loss, take profit, and risk before clicking buy or sell. • Anyone who trades manually or semi-manually and wants faster execution and clearer risk. • Users w
筛选:
goor311
493
goor311 2023.05.13 04:47 
 

GREAT indicator.But how do I get to the webinars?

Daniel Oliver Sturm Schwarz
364
Daniel Oliver Sturm Schwarz 2021.12.23 23:10 
 

用户没有留下任何评级信息

Garry James Goodchild
3922
来自开发人员的回复 Garry James Goodchild 2021.12.24 01:30
this is 55USD 1 off payment! and is not available elsewhere.
man1980
2168
man1980 2021.04.16 02:09 
 

LOVE IT

orangeedge
239
orangeedge 2021.02.23 13:35 
 

Great indicator. Save me a lot of time and effort.

8601567
789
8601567 2021.01.15 18:05 
 

I will try this again. I will start with a base of three stars because of a misunderstanding between the vendor and me. He has been sincere about fixing the problems and that should be noted. I will try to re-evaluate the indicator when I am able to get it back on my charts.

Garry James Goodchild
3922
来自开发人员的回复 Garry James Goodchild 2021.02.02 17:11
Thank you for your comments , I have reached out to you personally and tried to address all of your concerns. We take those on board and have made the listing for the indicator a little clearer. I have also updated my website to let customer know we can allow them to change account number as they wish. Mql5 facility automatically grants the 5 activations locked to your MQL5 ID. I have also added a video on how to set the indicator up and customise its key features. I think you will find this very useful . We care greatly about looking after our customers. The indicator itself is very good I hope you will benefit from using it. This is a fairly priced product. Understanding the features of it and how to customise it to assist you in the strategy you use. We try and listen to customers and if it makes sense it helps us improve and deliver better products and services. If you need any further assistance please feel free to message me personally and i will try and help you.
回复评论