Volume Confirm Trend Zone

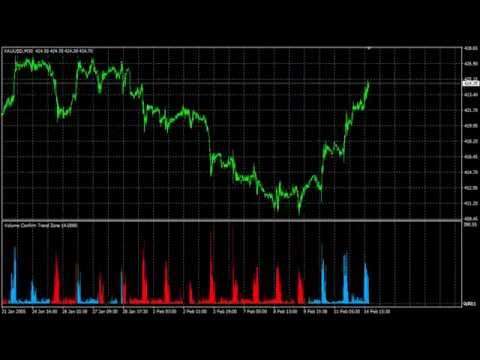
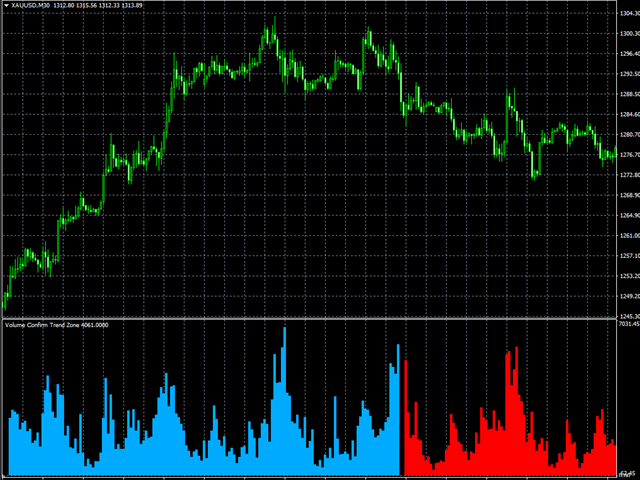
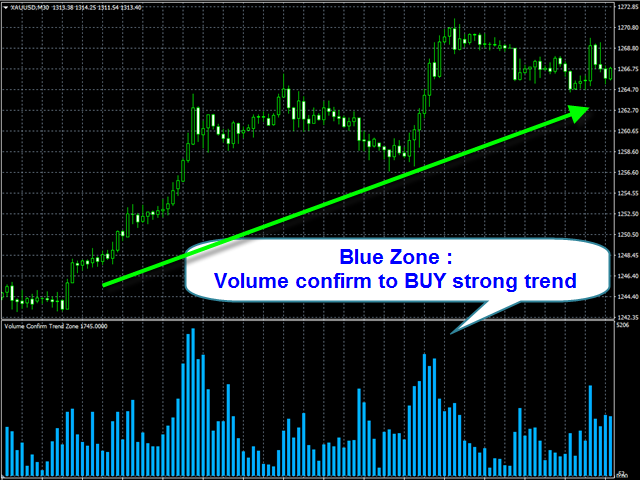
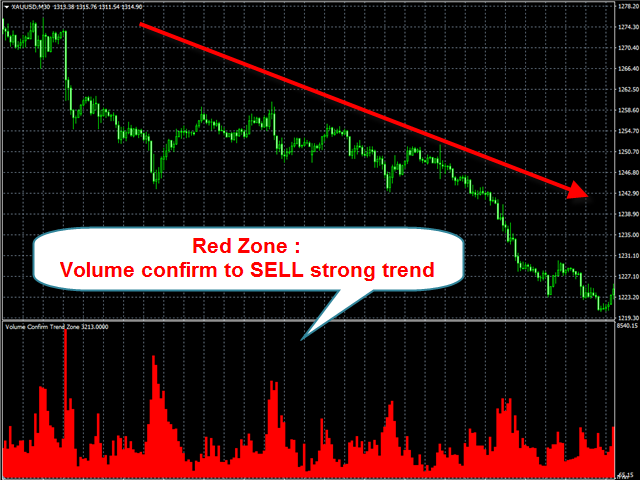
Volume Confirm Trend Zone is the indicator for filtering sideways and confirm trend to help your system trading.

Indicator can use every currency pairs, every time frame, and every broker.

You can see trend zone when color to change in volume indicator.


Features

  • When the color changes to the blue: Buy Zone is a strong trend.
  • When the color changes to the red: Sell Zone is a strong trend.
推荐产品
Forex Gump
Andrey Kozak
2.4 (5)
Forex Gump is a fully finished semi-automatic trading system. In the form of arrows, signals are displayed on the screen for opening and closing deals. All you need is to follow the instructions of the indicator. When the indicator shows a blue arrow, you need to open a buy order. When the indicator shows a red arrow, you need to open a sell order. Close orders when the indicator draws a yellow cross. In order to get the most effective result, we recommend using the timeframes H1, H4, D1. There
Binary Option Signal
Yaroslav Varankin
Indicator for binary options arrow is easy to use and does not require configuration works on all currency pairs, cryptocurrencies buy signal blue up arrow sell signal red down arrow tips do not trade during news and 15-30 minutes before their release, as the market is too volatile and there is a lot of noise it is worth entering trades one or two candles from the current period (recommended for 1 candle) timeframe up to m 15 recommended money management fixed lot or fixed percentage of the depo
我们为您提供一个指标"蜡烛收盘台",它将成为您在贸易领域不可或缺的助手。 这就是为什么知道蜡烛何时关闭会有所帮助的原因: 如果你喜欢使用蜡烛花纹进行交易,你就会知道蜡烛何时关闭。 此指标将允许您检查是否形成了已知模式以及是否存在交易的可能性。 该指标将帮助您做好市场开放和市场关闭的准备。 可以设置一个计时器来创建计划新闻的预览,这样就可以检查市场对此的反应。 您可以设置指示灯,以便在蜡烛关闭前几秒钟发送警报/警告。 通知/警报/警报可以发送到: 屏幕警报 电子邮件 移动应用 MT4烛台计时器指示器为什么有用 那么烛台计时器什么时候有用呢?如果你长期交易,你可能不需要蜡烛计时器指示器,因为你的参赛不会受到一分钟或一小时的太大影响。但是,如果你在短时间内是黄牛或交易员,那么你知道时机非常重要。 外汇市场24小时开放,只在周末关门,有些策略可能会受到您入仓时出现错误时机的严重影响。 MT4蜡烛计时器指示器可以显示当前蜡烛中的剩余时间,以便为下一次蜡烛打开做好准备。 可以从这一指标中受益的一些情况例子有: 预定消息传出 地理市场开闭 预定发生的事件,通常是金融、经济或政治事件
Quantum Falcon Signal Free is a smart visual trading indicator for MetaTrader 4 designed for Forex and Gold traders. The indicator combines: • Trend analysis • RSI momentum confirmation • MACD momentum filtering • ATR volatility filtering • Higher timeframe confirmation • Smart exit signal detection Main Features: • Smart Buy and Sell signals • Exit Buy / Exit Sell alerts • Real-time dashboard on chart • Professional candle arrows • Multi-timeframe trend confirmation • ATR market volatility filt
FREE
Step into the world of Forex trading with confidence, clarity, and precision using   Gold Indicator   a next-generation tool engineered to take your trading performance to the next level. Whether you’re a seasoned professional or just beginning your journey in the currency markets, Gold Indicator equips you with powerful insights and help you trade smarter, not harder. Built on the proven synergy of three advanced indicators, Gold Indicator focuses exclusively on medium and long-term trends eli
MN1-W1-D1 Close Price Indicator to Index Trading for MT4 The indicator draws lines to the close prices of the last closed bars of monthly, weekly and daily timeframes. Observably, these prices are significant support and resistance prices at major indices, like Nasdaq, DAX. The info panel always shows the prices relative to each other in the correct order. If the current price is the highest - i.e. higher than the last monthly, weekly and daily closing price - it is in the first row. The lowest
Gold Koala Arrows
Pieter Gerhardus Van Zyl
Gold Koala Arrows is a smart arrow-based trading indicator designed to help identify potential market turning points and momentum shifts. It plots clear buy and sell arrows directly on the chart, making it easy to spot possible trading opportunities without cluttering your workspace. The indicator adapts to changing market conditions and includes built-in filtering to help reduce low-quality signals during difficult trading periods. Arrows are only generated on completed candles, helping to prov
IconTradeSL
Vadim Gorodetskii
IconTradeSL.  Возможность выставлять sl по уровням. В индикаторе установлена возможность показывать историю уровней на графике. Возможность выставлять sl по уровням. Настройки индикатора: ЦВЕТ_BAR - цвет баров по которым ищем SL ЦВЕТ_Тек_BAR - Purple;//цвет текущего бара BAR - поиск в последних BAR барах (по умолчанию 200) show_bar - показывать бары по которым ищем SL
Sniper Zones Pro
Thepphawut Piampuechana
ตัวบ่งชี้ Sniper Zones Pro - คำอธิบายการใช้งาน ตัว บ่งชี้ Sniper Zones Pro ออกแบบมาเพื่อช่วยให้ผู้ซื้อขายระบุ "โซน" ราคาที่สำคัญและจุดเข้า/ออกที่แม่นยำสำหรับการซื้อขายได้อย่างรวดเร็ว โดยมุ่งหวังที่จะเพิ่มผลกำไรสูงสุดหรือจำกัดความเสี่ยง ตัวบ่งชี้ทำงานโดยคำนวณและแสดงระดับราคาตามค่าเฉลี่ยเคลื่อนที่ถ่วงน้ำหนักเชิงเส้น (LWMA) และให้คำแนะนำในการทำกำไร (TP) และหยุดการขาดทุน (SL) แบบไดนามิก ส่วนประกอบและหลักการทำงาน: การคำนวณระดับราคา: เส้นหลัก (L2 - จุดเข้า): เส้นสีแดงนี้แสดง ค่าเฉลี่ยเคลื่อนที่ถ่วงน้
DualVWAP
Kourosh Hossein Davallou
Dual Timeframe VWAP Indicator for MT4  Description Professional VWAP indicator that displays both **Daily** and **Weekly** VWAP simultaneously on your chart.   Features: - Dual VWAP Lines: Blue for Daily, Red for Weekly - Configurable Bands: Two deviation bands for each timeframe - Session Control: Customizable trading hours for Daily VWAP - Clean Visuals: Solid lines for main VWAP, dashed for bands - Optimizable: Parameters can be optimized using Genetic Algorithm Key Settings: - Enable/di
Williams Precision Prime
Steffen Reinhold Noll
5 (2)
Williams Precision Prime – Precision Meets Legend Williams Precision Prime is a high-performance trend-following indicator that bridges the gap between Larry Williams' time-tested logic and modern algorithmic filtering, all wrapped in the exclusive Peak Precision design. Engineered for traders who demand clarity, stability, and mathematically sound entries, this system utilizes a triple-layer EMA strategy (100, 50, and 21) to identify high-probability "Cross-Momentum" setups within a confirmed d
FREE
MA Alignment Scanner
Benedict Jamora
5 (1)
This indicator scans and displays currency pairs that have recently aligned moving averages on a given timeframe. You can configure which pairs the indicator will scan. It also includes all types of alert options. Bullish MA Alignment =  MA1>MA2>MA3>MA4>MA5 Bearish MA Alignment =  MA1<MA2<MA3<MA4<MA5 Features Attach to one chart and scans all the currency pairs configured and visible in the Market Watch Window It can monitor all the available timeframes from M1 to MN1 and sends alerts on every
Introducing the POWER TRADE Indicator Created by a small group of experienced traders with years of profitable experience in the financial markets, the Power Trade Indicator is a plug-and-play trading tool designed to help traders spot high-quality setups with ease and confidence. What It Does: It provides powerful entry signals, profit-taking zones, and rebound areas — giving you a complete view of where price action is most likely to move next. The indicator reacts in real time, al
Scalping Snake Pro 是一種獨特的剝頭皮指標,可向交易者顯示價格反轉時刻且不會重繪。與 Internet 上的許多其他指標不同,該指標不會重新繪製其值。它在第一個柱上繪製信號,這樣您就不會遲到開倉交易。當信號出現時,該指標通過電話和電子郵件向交易者發送通知。您只需 147 美元即可獲得所有這些功能。 如何使用該指標進行​​交易? 打開 H1 時間框架。貨幣對 GBPUSD 或 EURUSD。我們正在等待指標將繪製藍線的第一個柱。我們開立交易買入並設置 TakeProfit +20 點。止損將是相反方向的信號,即紅線。要打開賣出交易,請等待指標繪製紅線的第一個柱。之後,我們開立交易出售。止盈 20 點。止損將是相反方向的信號,即藍線。 該指標是否正在重繪? 不,該指標不會重繪。 這個指標是遲到的信號嗎? 不,這個指標沒有滯後。它在第一個柱上顯示信號。 這個指標可以用在你的機器人上嗎? 是的你可以。該指示器使用內存緩衝區,可以將其集成到任何機器人中。 客戶通過購買該指標得到什麼? 您獲得此指標 + 您在鏈接 https://www.mql5.com/en/market/
Gann Square of 144
Taras Slobodyanik
5 (6)
江恩箱(或江恩方)是一种基于 W.D. Gann 的“市场预测的数学公式”文章的市场分析方法。 该指标可以绘制三种正方形模型:90、52(104)、144。有六种网格变体和两种弧形变体。 您可以在一张图表上同时绘制多个方块. 参数 Square — 江恩方格模型的选择: 90 — 90 的平方(或 9 的平方); 52 (104) — 52(或 104)的平方; 144 — 144的万能平方; 144 (full) — 正方形的“完整”版本,结合了其他正方形的线条。 据我们所知,W.D.江恩并没有这样的加价; for Arcs — 圆弧的简化正方形; Grid — 网格的变体: 4x4 (52) — 4 x 4 网格,52 个标记; 5x5 (40); 8x8 (90); 8x8 (104); 8x8 (144); 16x16 (144); 36x36 (144); disable — 禁用网格; Arcs — 弧线的变体: 4x4; 5x5; disable — 禁用弧; 开始时的方形参数: Length of Square, Bars (X-axis) — 正方形的长度(以条
MACD Color for GOLD
Chitipat Changsamrit
黄金的 MACD 颜色 用于查看图表的走势和检查将要买入或卖出 看 trand 的颜色很容易看。 红色向下/蓝色向上。 可以在很短的时间内使用它 1. 多头交易:与时间框架 H1 / H4 / 每日一起使用 2.Short Trade : 使用时间框架 M5 / M15 / M 30 / H1 您可以通过查看此指标来了解何时打开或关闭订单 ---------------------------- 黄金的 MACD 颜色 用于查看图表的走势和检查将要买入或卖出 看 trand 的颜色很容易看。 红色向下/蓝色向上。 可以在很短的时间内使用它 1. 多头交易:与时间框架 H1 / H4 / 每日一起使用 2.Short Trade : 使用时间框架 M5 / M15 / M 30 / H1 您可以通过查看此指标来了解何时打开或关闭订单
Quantum Currency Strength Indicator
QUANTUM TRADING SOFTWARE LIMITED
Your success as a forex trader depends on being able to identify when a currency or currency pair is oversold or overbought. If it is strong or weak. It is this concept which lies at the heart of forex trading. Without the Quantum Currency Strength indicator, it is almost impossible. There are simply too many currencies and too many pairs to do this quickly and easily yourself. You need help! The Quantum Currency Strength indicator has been designed with one simple objective in mind. To give you
Currency Power Meter
Vu Trung Kien
4.67 (15)
Currency Power Meter shows the power of major currencies against each other. The indicator shows the relative strength of currency/pair at the current moment in a period of time (H4, daily, weekly, monthly). It is useful for day traders, swing traders and position traders with suitable period options. Currency power is the true reason of market trend: The strongest currency against the weakest currency will combine into a most trending pair. As we know, trend makes money and all traders love tre
“动态剥头皮震荡指标”是一款高级自定义加密货币外汇指标,适用于 MT4 平台,高效交易! ............................................................................................................ - 新一代震荡指标 - 参见图片了解如何使用。 - 动态剥头皮震荡指标具有自适应超卖/超买区域。 - 震荡指标是一款辅助工具,可从动态超卖/超买区域找到准确的入场点。 - 超卖值:低于绿线,超买值:高于橙线。 - 该指标也非常适合与价格行为模式结合使用。 - 它比标准震荡指标更精准。 - 提供 PC 和移动端警报。 ................................................... 点击这里查看高质量的交易机器人和指标! 本产品为原创,仅在 MQL5 网站上提供。
Matrixs
Andriy Sydoruk
Matrix is a Forex arrow indicator. Displays signals simply and clearly! The arrows show the direction of the transaction, and are colored accordingly, which can be seen in the screenshots. As you can see, trading with such an indicator is easy. I waited for an arrow to appear in the desired direction - I opened a deal. An arrow formed in the opposite direction - closed the deal. The indicator also displays the lines with the help of which the arrow signals are formed, taking into account the int
This all-in-one indicator displays real-time market structure (internal & swing BOS / CHoCH), order blocks, premium & discount zones, equal highs & lows, and much more...allowing traders to automatically mark up their charts with widely used price action methodologies. Following the release of our Fair Value Gap script, we received numerous requests from our community to release more features in the same category. //------------------------------------// Version 1.x has missing functions + PDAr
EZZ Zig Zag MT4
Paulo Rocha
5 (1)
EZZ Elite Zig Zag is an indicator for the MetaTrader 4 terminal. This indicator traces the peak of the trend based on the market reversal, thus showing various opportunities in the financial market. EZZ Elite Zig Zag is a visual tool, intuitive, and easy to understand and use.  Test it Yourself by Downloading it for Free. Author Paulo Rocha all rights reserved
Phase Analytics Pro: Advanced Cyclic Market Analyzer Phase Analytics Pro is a sophisticated technical tool designed for traders who prioritize mathematical precision over lag-heavy traditional indicators. Based on the principles of digital signal processing, this indicator decomposes price action into phase and quadrature components to identify the dominant market cycle. How it works: The algorithm calculates the instantaneous phase of the market, allowing it to distinguish between trending and
Performance Analytics FX
Cesar Jose Perez Beltran
Performance Analytics 1.4 is an advanced real-time performance-tracking and risk-management indicator designed for traders who work with multiple EAs or simultaneous setups and need accurate, persistent, instance-separated metrics. It displays on-screen key statistics for both the entire account and the current EA, including profits, maximum losses, professional performance metrics, and smart alerts. The indicator visually divides the information into two independent blocks : 1. White Block – Ge
Magical Arrow
Ranguni Abdulsamir Abdulmajid
Magical Arrow Indicator – Clear & Reliable Signals The Magical Arrow Indicator is a non-repainting, trend-following tool that gives you crystal-clear Buy and Sell signals . It  high-probability reversals and entries . No more guesswork – just follow the arrows on your chart! The Magical Arrow Indicator is a powerful, easy-to-use trading tool that helps you catch the most profitable Buy and Sell opportunities in the Forex market. It is designed for beginners and professional traders , giving y
VR Cub
Vladimir Pastushak
VR Cub 这是获得高质量切入点的指标。该指标的开发是为了促进数学计算并简化对仓位入场点的搜索。多年来,该指标所针对的交易策略已被证明其有效性。交易策略的简单性是其巨大的优势,即使是新手交易者也能成功进行交易。 VR Cub 计算开仓点以及获利和止损目标水平,这显着提高了效率和易用性。查看使用以下策略进行交易的屏幕截图,了解简单的交易规则。 设置、设置文件、演示版本、说明、问题解决,可以从以下位置获取 [博客] 您可以在以下位置阅读或撰写评论 [关联] 版本为 [MetaTrader 5] 计算入场点的规则 开仓 要计算入场点,您需要将 VR Cub 工具从最后一个高点拉伸到最后一个低点。 如果第一个点在时间上早于第二个点,交易者等待柱线收于中线上方。 如果第一个点在时间上晚于第二个点,交易者等待柱线收于中线下方。 根据上述条件,严格在 柱线收盘 后建仓。 换句话说,如果我们在小时图上进行交易,那么从最高点到最低点的时间距离必须超过24小时,最高点和最低点之间的点数必须大于或等于平均价格变动每天。 维持和改变市场地位 可以有多个未平仓头寸;每个头寸都可以单独修改。 VR Cub
Noize Absorption Index MT4
Ekaterina Saltykova
5 (1)
Noize Absorption Index - is the manual trading system that measures the difference of pressure between bears forces and bulls forces. Green line - is a noize free index that showing curent situation. Zero value of index shows totally choppy/flat market.Values above zero level shows how powerfull bullish wave is and values below zero measures bearish forces.Up arrow appears on bearish market when it's ready to reverse, dn arrow appears on weak bullish market, as a result of reverse expectation. S
“动态交易震荡指标”是一款高级自定义加密货币外汇指标,适用于 MT4 平台,效率极高! - 新一代震荡指标 - 参见图片了解如何使用。 - 动态交易震荡指标具有自适应超卖/超买区域。 - 震荡指标是一款辅助工具,可帮助您从动态超卖/超买区域找到准确的入场点。 - 超卖值:低于蓝线,超买值:高于红线。 - 该指标也非常适合与价格行为模式结合使用。 - 它比标准震荡指标更精准。适用时间范围:30 分钟、1 小时、4 小时、1 天、1 周。 - 提供 PC 和移动端提醒。 ..................................................... 点击这里查看高质量的交易机器人和指标! 本产品为原创产品,仅在 MQL5 网站上提供。
限时优惠 “限时发布价格” “2.0版本后将涨价” Currencies Gold Momentum Flow Dashboard — 即刻洞察市场强弱 一款强大的多合一交易面板,实时显示外汇与黄金在多个时间周期(M5–D1)的动量。 多时间周期ROC分析 内置交易信号(趋势一致与动量变化) 货币强弱指标 热力图快速识别趋势 实时提醒 + 一键切换交易品种 无需来回切换图表 — 一个界面掌握整个市场。 像真正看懂市场一样交易 大多数交易者是“盲目的”。 他们不断切换图表… 追逐信号… 入场太晚…离场困惑。 这一切,到此为止。 看到别人看不到的机会 这不仅仅是一个指标。 这是一个“市场透视系统”,帮助你看到: 哪些交易对正在爆发 哪些货币正在主导市场 哪些高概率机会正在形成 为精准交易者打造 提前捕捉动量变化 确认多周期趋势一致 避免震荡行情 专注高质量机会 内置优势 智能信号系统 货币强弱分析 热力图分析 实时提醒 一键执行 彻底改变你的交易方式 交易什么 何时交易 哪个方向概率最高 ️ 大多
Proxy OrderFlow MT4
Vincent Jose Proenca
5 (1)
Proxy Order Flow – Imbalance Tick-Spread 基于点差不平衡的指标。 TF: 适用于所有时间周期(M1 到 D1)。 交易品种: 兼容外汇、指数、黄金和差价合约(自动适配 JPY、黄金和 CFD 品种)。 参数: TickWindow (200) – 观察的 tick 窗口 SpreadWeight (1.5) – 点差权重 NormalizationPeriod (20) – 标准化周期(z-score) Overbought / Oversold (±3.0) – 超买/超卖阈值 AlertCooldown (300s) – 警报冷却时间 结论: Proxy Order Flow – Imbalance Tick-Spread v2.4 通过分析 OHLC 变化和点差,识别买卖压力,清晰显示市场流向与不平衡区域。
该产品的买家也购买
Neuro Poseidon MT4
Daria Rezueva
4.95 (37)
Neuro Poseidon is a new indicator by Daria Rezueva. It combines precise trading signals with adaptive TP/SL levels - creating best possible trades as a result! Message me and get  Neuro Poseidon Assistant  as a gift to automize your trading process! What makes it stand out? 1. Proven profitability on all assets and timeframes 2. Only confirmed BUY and SELL signals present on the chart 3. Adaptive TP & SL levels generated by the software for each trade 4. Easy to understand - suitable for all
Dynamic Forex28 Navigator
Bernhard Schweigert
4.43 (7)
Dynamic Forex28 Navigator - 下一代外汇交易工具。 当前 49% 折扣。 Dynamic Forex28 Navigator 是我们长期流行的指标的演变,将三种功能合二为一: 高级货币强度 28 指标 (695 条评论)+ 高级货币 IMPULSE 带警报 (520 条评论)+ CS28 组合信号(奖励)。 有关指标的详细信息 https://www.mql5.com/en/blogs/post/758844 下一代强度指标提供什么? 您喜欢的原始指标的一切,现在通过新功能和更高的精度进行了增强。 主要特点: 专有货币强度公式。  所有时间范围内的平滑和准确的强度线。 非常适合识别趋势和精确进入。 动态市场斐波那契水平(市场斐波那契)。  此指标独有的独特功能。 斐波那契应用于货币强度,而不是价格图表。 适应实时市场活动以获得准确的反转区域。 实时市场动量。  第 9 行显示市场是活跃还是被动。 对于定时交易至关重要。 全面的警报和显示。  每种货币最强的买入和卖出动量。 ​​28 对的双重动量买入和卖出。 超买/超卖警告外部范围和止损。 反转
MetaBands M4
Vahidreza Heidar Gholami
3.5 (6)
MetaBands使用强大且独特的算法绘制通道并检测趋势,以便为交易者提供进出交易的潜在点。它是一个通道指标和强大的趋势指标。它包括不同类型的通道,可以通过使用输入参数简单地合并以创建新通道。MetaBands使用所有类型的警报通知用户市场事件。 功能 支持大多数通道算法 强大的趋势检测算法 能够合并不同类型的通道 多时间帧和多货币(信号矩阵) 所有类型的警报功能(声音、屏幕闪烁、推送通知、电子邮件、弹出窗口、箭头) 它永远不会重绘 趋势检测 MetaBands使用在通道内振荡的蓝色线来检测趋势。当该线遇到通道的上界时,表明开始下跌趋势,当它遇到下界时,表明开始上涨趋势。如果蓝线接近中线,则市场处于整理期。 该指标使用独特的方法来检测趋势。一开始可能看起来有些复杂,但如果您观看视频教程,您就会意识到它是多么强大且易于使用。 入场和出场信号 当趋势变化或价格穿过上下通道时,MetaBands会立即通过不同的方法提醒交易者,这些方法可以在指标设置中启用。 信号矩阵 要监视来自不同时间框架的多个符号并在一个地方查看信号,请单击右上角按钮或按键盘上的M键以打开信号矩阵。该矩阵可以快速概览
Advanced Supply Demand
Bernhard Schweigert
4.91 (300)
现在优惠 30%! 任何新手或专业交易者的最佳解决方案! 该指标是一款独特、高质量、且价格合理的交易工具,因为我们已经整合了许多专有功能和新公式。 依据此更新,您将能够显示双重时间帧区域。 您不仅可以显示一个较高的时间帧,还可以同时显示图表时间帧,加上更高的时间帧:显示嵌套时区。 供需双方所有交易者都会喜欢它。 :) 重要信息披露 高级供需的最大潜力,请访问 https://www.mql5.com/zh/blogs/post/720245   想象您的交易如何得以改善,是因为您能够精准定位入场或目标位吗? 构建于新的底层算法,它可以更轻松地识别出买卖双方之间的潜在失衡。 这是因为它以图形方式展示供需最强劲区域,及其过去的表现(显示旧区域)。 这些功能旨在帮助您更轻松地发现最佳入场区域和价位。 现在您可以针对您的交易品种和时间帧来优化和编辑区域强度! 高级供需指标适用于所有产品和时间帧。 它是一个新的公式,非常新的功能是两个区域强度函数可由用户输入进行调整! 这在交易中是一大优势。 当您学习如何使用专有功能,例如带有价格游离最小 X 因子的区域强度时,您能够判断该区域强劲与否。 供需
Scalper Inside PRO
Alexey Minkov
4.68 (69)
Scalper Inside PRO Scalper Inside PRO 是一款日内趋势与剥头皮指标,采用独家的内置算法来评估市场方向和关键目标位。该指标会自动计算进场点、出场点以及多个止盈目标位,并显示详细的绩效统计数据,让您能够看到不同品种和策略在历史数据上的表现。这有助于您选择符合当前市场状况的交易品种。您还可以将自己的箭头指标连接到 Scalper Inside PRO,并快速查看它们的统计数据和历史信号。 Scalper Inside PRO 使用手册及参数说明: 点击阅读 该指标适用于任何品种和时间周期(日内交易推荐使用 M5),并包含多种内置策略。它既可作为独立的剥头皮工具使用,也可作为您交易系统的分析组件。 主要功能 基于独家的新一代趋势检测算法 Next-Generation Trend Detection Algorithm (NG TDA) 进行趋势识别。 自动计算进场点和出场点,并提供多级止盈目标(TP1、TP2、TP3)。 三种内置策略和一个优化器,用于将信号适配到当前品种和时间周期(仅在实时模式下可用)。 提供品种和策略在历史数据上的详细绩效统计。 提
Gann 方块指标是一种强大的市场分析工具,基于 W.D. Gann 在其“市场预测数学公式”一文中介绍的数学概念。该指标融合了与平方数(如 144、90 和 52)有关的 Gann 技术,以及平方 9。此外,它还融入了  关于如何将平方 9 与通道和星形图案结合使用的方法。 用户手册和使用方式: 在使用该指标之前,我们建议您阅读用户手册,并与我们联系以获得任何澄清。您可以在我们的网站上找到完整的用户手册。 该指标提供了 MT5 的完整版本供购买,也提供了 MT4 的免费版本供测试。提供了两个版本的链接供您方便使用。 主要特点和功能: Gann 方块指标为您的交易环境提供了全套工具,使您能够基于几何图案和 Gann 的概念做出明智的决策。以下是主要特点: 平方 9 分析: 该指标可以绘制与平方 9 有关的各种元素,包括水平线、星形图案、网格、Gann 扇形等。这在您的图表上提供了 Gann 的几何概念的视觉表示。 Gann 方块: 该指标绘制了 Gann 方块 52、90 和 144,使您能够可视化和分析它们与价格走势的关系。 自由 Gann 星形图案: 该指标使您能够直接在图表上绘制
Breakout Arrows Mt4
Michael Oko Oboh
5 (1)
Trend Breakout Arrows Indicator The Trend Breakout Arrows Indicator is a momentum-based signal tool designed to identify potential bullish and bearish breakout opportunities. It displays clear arrow signals directly on the price chart, helping traders quickly recognize possible trend changes and continuation setups. Up Arrow (Buy Signal) A magenta up arrow appears below a candle when bullish momentum begins to strengthen. This signal indicates that buying pressure may be overtaking selling press
Neo Wave PRO
Nikolay Raykov
5 (1)
Price & Time Market Structure Indicator A professional market structure tool that analyzes waves through both price and time — not price alone. Main Description NeoWave PRO is a professional market structure indicator for MetaTrader 4 designed for traders who want to move beyond traditional one-dimensional wave tools such as ZigZag, swing indicators, and basic high/low systems. Most wave indicators analyze only one thing: Price. But a real market wave is not only a price movement. A true wave de
本产品已针对 2026 年市场进行更新,并针对最新 MT5 版本进行了优化。 价格更新通知: Smart Trend Trading System 目前价格为 $99 。 接下来的 30 次购买 后,价格将上涨至 $199 。 特别优惠: 购买 Smart Trend Trading System 后,请发送私信给我,即可免费领取 Smart Universal EA ,并将您的 Smart Trend 信号转换为自动交易。 Smart Trend Trading System 是一套完整的交易系统,具备不重绘、不回绘、不延迟的特点,专为希望获得更清晰信号、更准确趋势方向以及更有组织交易方式的交易者打造。 Online course , manual and download presets . 它将 10 多种交易工具 整合到一个系统中,包括趋势检测、反转区域、Smart Cloud、移动止损逻辑、支撑与阻力、K线着色、提醒以及多周期分析。 该系统旨在帮助您应对不同的市场环境: 趋势市场: 识别主要趋势,发现回调,跟随动能,并通过止损指导和移动止损选项寻找更清晰的入场机会。 震荡
BTMM State Engine Pro MT4
Garry James Goodchild
BTMM State Engine Pro is a MetaTrader 4 indicator for traders who use the Beat The Market Maker approach: Asian session context, kill zone timing, level progression, peak formation detection, and a multi-pair scanner from a single chart. It combines cycle state logic with a built-in scanner dashboard so you do not need the same tool on many charts at once. What it does Draws the Asian session range; session times can follow broker server offset or be set in inputs. Tracks level progression (L
IQ FX Gann Levels
INTRAQUOTES
5 (2)
IQ FX Gann Levels a precision trading indicator based on W.D. Gann’s square root methods . It plots real-time, non-repainting support and resistance levels to help traders confidently spot intraday and scalping opportunities with high accuracy. William Delbert Gann (W.D. Gann) was an exceptional market analyst, whose trading technique was based on a complex blend of mathematics, geometry, astrology, and ancient mathematics which proved to be extremely accurate. Setup & Guide:  Download  MT5 Ver
GOLD Impulse with Alert
Bernhard Schweigert
4.67 (12)
这个指标是我们2个产品 Advanced Currency IMPULSE with ALERT  +   Currency Strength Exotics 的一个超级组合。 它适用于所有时间框架,并以图形方式显示8种主要货币和一种符号的强势或弱势冲动! 该指标专门用于显示任何符号的货币强度加速,如黄金、异国货币对、商品、指数或期货。这是它的第一个指标,任何符号都可以被添加到第9行,以显示黄金、白银、石油、DAX、US30、MXN、TRY、CNH等的真实货币强度加速(冲动或速度)。 建立在新的基础算法上,它使识别和确认潜在的交易更加容易。这是因为它以图形方式显示了一种货币的强势或弱势是否正在加速,并测量了这种加速的速度--把它想象成你汽车中的速度表。当你加速时,事情显然会发生得更快,这在外汇市场上也是一样的,即如果你配对的货币正在向相反的方向加速,你就会发现一个潜在的有利可图的交易。 动态市场斐波那契28水平被用作警报触发器,将适应市场活动。如果冲动击中黄色触发线,你将收到警报。然后你就知道作为一个交易员应该做什么。货币对和方向已经给出。只需点击警报按钮,就可以切换到该货
The indicator scans for Dinapoli thrust pattern in multiple timeframes for the all markets filtered and shows the results on Dashboard. Key Features Dashboard can be used for all markets It can scan for thrust pattern on MN1, W1, D1, H4, H1, M30, M15 ,M5, M1 timeframes Ability to choose number of bars required above/below displaced moving average to define thrust Parameters UseMarketWatch: Set true to copy all symbols available in market watch MarketWatchCount : Set the number of symbols that
Enigmera
Ivan Stefanov
5 (8)
ENIGMERA: 市场的核心 重要提示:MQL5.com 演示版本在策略测试器中运行,可能无法完全反映 Enigmera 的功能。请查看描述、截图和视频了解详细信息。如有任何问题,请随时联系我! 该指标的代码已完全重写。版本 3.0 增加了新功能并修复了自指标发布以来积累的错误。 简介 这个指标和交易系统是金融市场的一种独特方法。ENIGMERA 使用分形周期来精确计算支撑和阻力水平。它展示了真实的积累阶段,并提供了方向和目标。无论是在趋势中还是在修正中,这个系统都能工作。 它是如何工作的 指标的大部分功能通过图表左侧的按钮控制,使得能够快速响应不同的市场情况。 按钮 ON/OFF – 显示或隐藏整个指标。 Channel – 激活支撑通道,显示可接受的偏差范围。 Dev1 (第一偏差) – 指示价格在支撑偏差内的波动,信号表示市场正在整合或积累力量。 Dev2 (第二偏差) – 显示价格在偏差之间的波动,表示趋势形成和方向。 Dev3 (第三偏差) – 表示趋势的显著加速和高波动性。 45deg (45度) – 显示市场的节奏和相对于 45 度线的运动稳定性。 Tgt1/2
本指标是实践实战交易完善的波浪自动分析的指标 !  案例... 注: 波浪分级用西方叫法不习惯,因受到缠论(缠中说禅)命名方式习惯的影响,我是将基础波浪命名为 笔 ,将二级波段命名为 段 ,同时具有趋势方向的段命名为 主趋段 (以后笔记中都是这种命名方式,先告知大家),但是算法上和缠论关系不大切勿混淆.反映的是本人分析盘面总结的 千变万化纷繁复杂的运行规律 . 对波段进行了标准化定义,不再是不同人不同的浪  ,    对人为干扰的画法进行了排除,在严格分析进场起到了关键的作用 . 使用这个指标,等于将交易界面提升美感,抛弃最原始的K线交易带你进入新的交易层次.如果不是为了交易,在宣传上也将使客户观感提升层次. 指标内容: 1. 基础波浪 (笔) : 首先我们找出了价格波动过程中的基础波动拐点,当然他的有序性低,为下一步的计算提供基础. 2. 二级波段( 段 ) :在基础波浪的基础上,通过算法分析得到层级更明显的二级波段,二级波段为波浪提供了分析基础 3. 波浪( 浪 ): 有着更清晰的趋势,更清晰直观的方向.分析一个波浪是否延续,需要看二级波段的形态,分析二级的构成,可以得出波浪
Harmonic Pattern Plus MT4
Young Ho Seo
4.44 (18)
Introduction Harmonic Patterns are best used to predict potential turning point. Traditionally, Harmonic Pattern was identified manually connecting peaks and troughs points in the chart. Manual harmonic pattern detection is painfully tedious and not suitable for everyone. You are often exposed under subjective pattern identification with manual pattern detection. To avoid these limitations, Harmonic Pattern Plus was designed to automate your harmonic pattern detection process. The functionality
Current event:  https://c.mql5.com/1/326/A2SR2025_NoMusic.gif A. 什么是 A2SR ?   * 这是一个领先的技术指标(没有重绘,没有滞后)。  -  指导 : -- 在  https://www.mql5.com/en/blogs/post/734748/page4#comment_16532516 -- 和  https://www.mql5.com/en/users/yohana/blog A2SR 在确定支撑(需求)和阻力(供应)水平方面有一种特殊的技术。 与我们在网上看到的普通方式不同,A2SR 在确定实际 SR 级别时有一个独创的概念。 原技术不是从网上拿来的,也没有在网上公开过。 A2SR 将根据您的交易风格自动选择 SR 级别。 即使您正在更改时间范围,但 SR 级别仍将保留在其位置上。 因为实际的 SR 不是从你使用的时间范围内获得的。 A2SR 拥有完整的交易工具 。 实际支持(需求)和阻力(供应)的真正概念。 新闻事件和央行讲话的市场情绪。 新闻事件和趋势的主要货币强度 (MCS) 的真正概念
KT Alpha Hunter Arrows MT4
KEENBASE SOFTWARE SOLUTIONS
大多数箭头指标只给你一个信号,然后把剩下的判断全部留给你自己。KT Alpha Hunter Arrows 给你的,是一套完整的交易计划。 每一个信号箭头出现时,图表上都会同时绘制完整计划:入场线、止损位、四个止盈目标,以及实时 Edge 结论,告诉你当前品种和时间周期是否值得交易。套装中还包含 Trade Manager EA,在你手动入场后负责后续执行,让你在市场波动和情绪干扰下依然保持纪律。非重绘。只在K线收盘后给出信号。适用于 Forex、黄金、指数,以及你交易的其他任何品种。 核心功能 非重绘买入和卖出箭头,只在K线收盘后出现。 每个信号都带有入场线、结构性止损和四个止盈目标。 Edge Dashboard 会分别评估当前图表上的买入和卖出机会。 结论系统:No Edge、Marginal、Tradeable、Good 或 Strong。 一键 Auto Optimize 按钮,可根据当前品种和时间周期自动调整设置。 完整套装包含 Trade Manager EA,并内置五种专为本指标设计的交易管理方案。 Prop Firm Risk Panel 可在图表上实时追踪日内回撤
Market Structure Patterns MT4
Samuel Manoel De Souza
5 (18)
Market Structure Patterns   is an indicator based on   smart money concepts   that displays   SMC/ICT   elements that can take your trading decisions to the next level. Take advantage of the   alerts ,   push notifications   and   email messages   to keep informed from when an element is formed on the chart, the price crosses a level and/or enters in a box/zone. Developers can access the values of the elements of the indicator using the   global variables  what allows the automation of trading d
Trend Lines PRO
Roman Podpora
5 (1)
TREND LINES PRO 帮助您了解市场真正的方向转变点。该指标显示真实的趋势反转点以及主要参与者重新入场的时机。 您可以看到 BOS线、 趋势变化和更高时间框架的关键水平——无需复杂的设置或不必要的干扰。信号不会重绘,并在K线收盘后仍然保留在图表上。 VERSION MT 5    -   与……搭配使用时,可发挥其最大潜力   RFI LEVELS PRO 指示器 该指标显示的内容: 实际变化 趋势(BOS 线) 一旦信号出现,它就始终有效!这与会重绘的指标有着重要的区别,后者可能会发出信号后又改变信号,从而导致资金损失。现在,您可以更精准、更准确地进入市场。此外,还有一个功能,会在箭头出现后为K线着色,直到达到目标价位(止盈)或出现反转信号为止。 重复条目   以及主要玩家的充值 为了提高寻找入场点时的视觉清晰度,我们创建了一个模块,该模块首先显示买入/卖出区域,并在该区域内寻找最佳入场点。此外,我们还加入了智能逻辑来管理止损位,该逻辑会随着时间的推移逐步降低止损位的大小,从而降低入场交易时的初始风险(移动止损位)。 信号强度水平(BOS) 该指标采用三个显著性等级来衡量
The Propfolio Master Suite is the ultimate all-in-one analytical workstation for professional traders. Combining the power of the Beat The Market Maker (BTMM) methodology, Smart Money Concepts (SND/Liquidity), and Advanced Volume Profile, this suite replaces multiple different indicators with one optimized engine. Monitor up to 14 pairs simultaneously from a single chart, instantly identify market cycles, and seamlessly map institutional footprints with the click of a button. The Command Center
RFI levels PRO
Roman Podpora
5 (1)
该指标能够准确显示反转点和价格回落区域。     行业领军人物 。您能洞察新趋势的形成,并以最高的精准度做出决策,掌控每一笔交易。 与……结合时,展现其最大潜力     趋势线专业版   指标  VERSION MT5 该指标显示的内容: 新趋势开始时的反转结构和反转水平及其激活。 显示屏   获利了结   和   止损   风险回报比最低的水平     RR 1:2       。 具有智能减值逻辑的止损。 显示指定指标中两种趋势类型的反转形态。 指标: 根据     趋势线     (全球趋势变化) 潮流专业版     (趋势快速变化) 简单有效   扫描器   实时趋势(新增)。 多时间框架工具筛选。 展示   利润   在 LOGIC AI 信号之后。 以下列出今日走势积极的金融工具。(RB键) 能够为终端启用通知(警报)功能,并向移动设备推送通知。 逻辑人工智能     — 利用人工智能寻找最佳切入点。 只有在启用 MTF(多时间框架分析)模式时,该功能才可用。 兼容性。 当与趋势线指标结合使用时,该指标能发挥其最大潜力。 这     RFI LEVELS PRO    
IQ FX Strength  answers the single most important question in trading: "Who is truly driving the market right now?" Designed with a stunning Hybrid UI, this tool separates true trend moves from market noise, allowing you to catch "Explosive" moves before the crowd sees them. System Requirement: For higher accurate signal and optimal, smoother performance of this indicator without any lag, a good CPU (with   RAM of  atleast 8GB or above) and fast internet connection is highly recommended. IQ FX
Block Master Pro
Stanislav Konin
5 (3)
The Block Master Pro indicator is designed to visually identify areas on the chart where significant volumes from major market participants are likely concentrated. These areas, known as order blocks, represent price ranges where large players place their orders, potentially signaling a price reversal and movement in the opposite direction. Key Features: Order Block Identification: Block Master Pro effectively identifies order blocks by pinpointing price ranges where large orders are placed. Th
Delta Fusion Pro
Francesco Secchi
5 (2)
Delta Fusion Pro – 高级订单流分析,专为日内交易设计 Delta Fusion Pro 是一款专业的 MetaTrader 4 指标,能够揭示市场中的主动订单流,实时显示机构压力的强度和方向。与传统的成交量指标不同,它分析买盘(Ask)与卖盘(Bid)之间的成交量差值(Delta),用于提前预测反转、确认趋势并识别专业兴趣区域。 主要特点 智能自动调节系统 根据以下条件自动调整所有参数: 交易品种类型(外汇、加密货币、指数、大宗商品、股票) 操作周期 市场波动率(ATR) 最近平均成交量 无需手动配置,适合新手交易者——指标自动完成校准! 核心功能 净Delta与累计Delta 计算主动买盘/卖盘成交量差值,支持自定义 EMA 平滑 实时显示方向性压力 可自定义直方图颜色(买入/卖出) 价格/成交量背离 自动检测常规与隐藏背离 强度分类:强/中/弱 高级过滤:成交量确认、趋势、时间距离 图形信号(彩色箭头) 市场失衡 识别显著的买盘/卖盘比例失衡(可配置比率) 最小成交量阈值验证 图表显示彩色点(多头/空头) Infusion Volume 检测异常成交量峰值(
NAM Order Blocks
NAM TECH GROUP, CORP.
3.67 (3)
MT4多時限訂單塊檢測指示器。 特徵 -在圖表控制面板上完全可自定義,提供完整的交互。 -隨時隨地隱藏和顯示控制面板。 -在多個時間範圍內檢測OB。 -選擇要顯示的OB數量。 -不同的OB用戶界面。 -OB上的不同過濾器。 -OB接近警報。 -ADR高低線。 -通知服務(屏幕警報|推送通知)。 概括 訂單塊是一種市場行為,它指示從金融機構和銀行收取訂單。著名的金融機構和中央銀行帶動了外匯市場。因此,交易者必須知道他們在市場上正在做什麼。當市場建立訂單塊時,它會像發生大多數投資決策的範圍一樣移動。 訂單建立完成後,市場將朝著上升和縮小的方向發展。訂單大宗交易策略的關鍵術語是它包括機構交易者正在做的事情。由於它們是主要的價格驅動因素,因此包括機構交易在內的任何策略都可以。 您將在任何時間範圍內實時看到訂單塊,使用我們的控制面板,您將能夠在所選的歷史記錄週期內檢測常規,拒收和未大寫的訂單塊。 現在您可以接收到訂單塊接近警報,我們在MT4上顯示屏幕通知,並將通知推送到您的手機!
Smart Price Action Concepts
Issam Kassas
4.77 (13)
本产品已针对 2026 年市场进行更新,并针对最新 MT5 版本进行了优化。 价格更新通知: Smart Price Action Concepts 目前价格为 $200 。 接下来的 30 次购买 后,价格将上涨至 $299 。 特别优惠: 购买后,请发送私信给我,即可领取 免费赠品 + 礼物 。 首先需要强调的是,这款交易工具是不重绘、不回绘、不延迟的指标,因此非常适合专业交易使用。 Online course , and manual Smart Price Action Concepts 指标是一款非常强大的工具,适合新手和有经验的交易者使用。它将 20 多个实用指标整合到一个系统中,结合了 Inner Circle Trader Analysis 和 Smart Money Concepts Trading Strategies 等高级交易理念。该指标专注于 Smart Money Concepts,帮助交易者理解大型机构如何交易,并辅助预测其市场行为。 它特别擅长流动性分析,使交易者更容易理解机构交易逻辑。它也非常适合预测市场趋势并仔细分析价格走势。通过让交易与机构策略保
Cycle Sniper
Elmira Memish
4.39 (36)
Please contact us after your purchase and we will send you the complimentary indicators to complete the system Cycle Sniper is not a holy grail but when you use it in a system which is explained in the videos, you will feel the difference. If you are not willing to focus on the charts designed with Cycle Sniper and other free tools we provide, we recommend not buying this indicator. We recommend watching the videos about the indiactor and system before purchasing. Videos, settings  and descri
Dynamic Scalper System
Vitalyi Belyh
5 (1)
“ Dynamic Scalper System ”指标专为在趋势波内进行剥头皮交易而设计。 已在主要货币对和黄金上进行测试,并可与其他交易工具兼容。 提供顺势短线建仓信号,并提供额外的价格变动支持。 指标原理: 大箭头决定趋势方向。 在趋势波内,我们采用一种生成小箭头形式的剥头皮交易信号的算法。 红色箭头代表看涨方向,蓝色箭头代表看跌方向。 敏感的价格变动线会沿着趋势方向绘制,并与小箭头信号协同作用。 信号运作方式如下:当线在适当时刻出现时,将形成入场信号;在出现线时,持仓;线完成后,平仓。 建议的操作时间范围为M1 - H4。 箭头在当前K线上方形成,如果下一根K线已开仓,则不会重新绘制上一根K线上方的箭头。 输入参数 Trend Wave Period - 趋势方向(大箭头)的周期,改变趋势波的时间间隔。值 1 表示趋势方向的最长持续时间,参数值越大,持续时间越短。 Scalper Arrows Period - 信号箭头(小箭头)的计算周期,改变入场信号的生成频率。值 3 表示最频繁的生成频率,参数值越大,箭头频率越低,准确度越高。 这些参数可以根据不同的时间范
Quants HL Break
Ferhat Mutlu
5 (2)
通過純價格行為進行高級計算,以找到 LH 和 HL 突破。 它會給你一個很好的市場反轉點。 LH 和 HL 信號也可用於 traingle 突破。 一旦突破發生,則表明強烈反轉。 移動平均線的漂亮過濾器。 我強烈建議將其與趨勢指標一起使用。 可用作支撐和阻力、供需指標的額外確認。 可以在以下外匯線程中找到更多詳細信息: 該指標未重新繪製。 Buffers :   SetIndexBuffer ( 0 ,UpBar);      SetIndexBuffer ( 1 ,UpBar2);           SetIndexBuffer ( 2 ,DnBar);      SetIndexBuffer ( 3 ,DnBar2);           SetIndexBuffer ( 4 ,UpBarTop);      SetIndexBuffer ( 5 ,UpBarLow);                    SetIndexBuffer ( 6 ,DnBarTop);      SetIndexBuffer ( 7 ,DnBarLow);           SetIn
作者的更多信息
EMA Cross Alert
Suriya Thammalungka
EMA Cross Alert is a signal indicator based on exponential moving average crossover. It will alert signal with audio or pop up on chart when 2 periods EMA cross above/below for Buy/Sell. It easy use. Help to your system trading. You can customize period of EMA for crossing alert signal, if you want. And You can ON/OFF audio alert. Indicator can use every currency pairs and every broker. Features Period1: Short moving averages Period2: Long moving averages Audible_Alerts : ON/OFF audio alert on
Smooth MA Trend Cross Alert is indicator signal strategy trading by Smoothed Moving Average (SMMA) crossover. It'll alert signal with an audio or pop up on the chart when 2 periods SMMA cross above/below for Buy/Sell. It easy use. Filter sideways by SMMA's smoothed trend. Helpful for your system trading. You can customize period of SMMA for crossing alert signal. You can ON/OFF audio alert signal on the chart, Notifications alert on mobile, Email message alert when Buy/Sell SMMA cross alert sign
TrendXHunter
Suriya Thammalungka
Trend Hunter is the indicator for filtering sideway and confirm trend to help your system trading. Indicator can use every currency pairs, every timeframe, and every broker. You can see trend and side way when color to change in candlestick. Features Candlestick when the color changes to green: Uptrend. Candlestick when the color changes to red: Downtrend. Candlestick when the color changes to Yellow: Sideway.
3xEMA Golden Cross Alert is indicator signal strategy trading by 3 Exponential Moving Average (EMA). It'll alert signal on next bar open with an audio or pop up on the chart when EMA signal cross above/below 3 periods EMA for Buy/Sell and Exit alert signal. BUY/SELL: When Short term's EMA > Medium term's EMA > Long term's EMA = Buy Signal When Short term's EMA < Medium term's EMA < Long term's EMA = Buy Signal Exit: When Short term's EMA < Medium term's EMA > Long term's EMA = Exit Signal for Bu
Gold Digger Martingale Robot is a fully automated scalping Expert Advisor based on Heiken Ashi, Moving Average and Ichimoku Kinko Hyo. Each entry point is calculated using an advanced entry filter based on Price Action by following the trend. Advantages Money management system. Indicators are Heiken Ashi, Moving Average and Ichimoku Kinko Hyo for filter sideway and scalping by following the trend. Easy to set up. Requirements Symbols: XAUUSD H4. Minimum deposit: $500. Leverage: 1:400-1:500. An
Samurai Scalping Indy
Suriya Thammalungka
Samurai Scalping Indy is indicator signal strategy trading with Heiken Ashi, Smoothed Moving Average, and Ichimoku. It'll alert signal with an audio or pop up on the chart for Entry BUY/SELL and Exit BUY/SELL alert signal. Helpful for your system trading. Its easy use to filter major trend and help for scalping strategy to follow the trend. You can ON/OFF audio alert signal on the chart, Notifications alert on mobile, Email message alert. (Setting the alert on Mobile/Email in MT4. Go to Tools >>
A trend indicator based on the Ichimoku Kinko Hyo and MACD. The ICloud Scalper Trend Indy is an improved variant of the Ichimoku Kinko Hyo and MACD, which shows the moment of trend following quite accurately. It is often used as a signal filter. Combination of two indicators makes a better use of these advantages: Ichimoku Kinko Hyo identifies the trend, while MACD determines the short-term movements and signals in the trend direction. Messages/Sounds (Notifications and sound settings) ON/OFF -
Scanner Trend Indy
Suriya Thammalungka
A trend indicator based on the Ichimoku Kinko Hyo and Candlestick. The Scanner Trend Indy is an improved variant of the Ichimoku Kinko Hyo and Candlestick, which shows the moment of trend following quite accurately. It is often used as a signal filter. Combination of two indicators makes a better use of these advantages: Ichimoku Kinko Hyo identifies the trend, while Candlestick determines the short-term movements and signals in the trend direction. Messages/sounds (notifications and sound sett
A trend reversal indicator based on the Candlestick Pattern. A candlestick pattern is a movement in prices shown graphically on a candlestick chart that trader can predict a particular market movement. Engulfing Pattern: A reversal pattern that can be bearish or bullish, depending upon whether it appears at the end of an uptrend (bearish engulfing pattern) or a downtrend (bullish engulfing pattern). The Engulfing Of Sparta indicator is an improved variant of the Candlestick Pattern, which shows
A trend indicator based on the CCI indicator. ZI Trend PaintBar Indicator is an improved variant of the CCI indicator, which shows the moment of trend following quite accurately. Combination of CCI indicator makes a better use of these advantages: Colored candlesticks showing the trend direction based on CCI indicator. Messages/Sounds (Notifications and sound settings) Mail - enable/disable sending emails. Alerts - enable/disable messages in the terminal when signals occur. Push - enable/disable
Over BS RSI Zone Alarm
Suriya Thammalungka
Over BS RSI Zone Alarm is an oscillator indicator which based on RSI oversold/overbought indicator. It'll alert signal on next bar open with an audio or pop up on the chart When RSI above 70 that the signal oversold alert. And RSI below 30 that the signal overbought alert. The indicator can customize Level of Relative Strength Index. Messages/Sounds (Notifications and sound settings) RSI_Period - Period of Relative Strength Index. Level_Overbought_Zone - Level of Relative Strength Index for Ove
Trend Follow Me Moving
Suriya Thammalungka
Trend Follow Me Moving Trend Follow Me Moving is a trend indicator which based on Moving average indicator. It'll alert signal on next bar open with an audio or pop up on the chart when SMA cross above SMMA high average price that the signal "Buy" alert and SMA cross below SMMA low average price that the signal "Sell" alert.   Messages/Sounds (Notifications and sound settings) Send_EMail - enable/disable sending emails. Audible_Alerts - enable/disable messages in the terminal when signals o
SMA Cross Envelopes Alert
Suriya Thammalungka
5 (1)
SMA Cross Envelopes Alert is a trend indicator based on the Moving average and Envelopes indicator. It'll alert signal on next bar open with the audio or pop up on the chart when SMA crosses above the Envelopes upper line that the signal "Buy" alert and SMA crosses below the Envelopes lower line that the signal "Sell" alert. Settings SMA: Simple moving average setting period Envelopes: Envelopes setting period Deviation: Envelopes setting deviation (%) Send_EMail: enable/disable sending
Slope Trend Robot v1
Suriya Thammalungka
Slope Trend Robot  is the Expert Advisors trading with a combination of multiple strategy trading algorithms (Trend, Level Trading, and Money Management with Martingale recovery loss to profitable).  The Trading algorithms. 1. Follow trends with Indicators is Moving average and Envelopes. 2. Open order two ways that trading both BUY and SELL. 3. Open orders with distance. 4. Close order follow indicator's signal with a profit.  How to work? Open BUY When Moving Average Cross Above Envelopes L
DMZ X Zone Robot
Suriya Thammalungka
DMZ X Zone Robot  is the Expert Advisors trading with a combination of multiple strategy trading algorithms (Trend, Hedging, and Money Management with Martingale Zone recovery).  The Trading algorithms. 1. Follow trends with Indicators is Moving average and Envelopes. 2. Open order two ways that trading both BUY and SELL. 3. Open STOP orders for hedging with zone recovery distance. 4. Close orders and exit with a profit.  How to work? Open BUY When Moving Average is Above Envelopes Line Upper.
CCI Robot
Suriya Thammalungka
CCI Robot is a trading robot that mainly uses the CCI indicator to trade signals, including Money   management and placing orders with Oversold, Overbought, Level Trading, and Grid distance. And can trade with Money Management with Martingale recovery loss to profitable or Fix each lot size depending on each trading style. for flexibility in Money   management. The Trading algorithms. 1. Trade according to CCI signal. 2. Open order two ways that trading both BUY and SELL. 3. Open orders with d
OB Scanner
Suriya Thammalungka
OB Scanner Indicator — Overview OB Scanner is an enhanced Support & Resistance + Supply & Demand indicator designed to help traders identify where institutions and smart money are placing orders. It scans the chart for: 1. Order Blocks (Improved Demand & Supply Zones) Automatically detects Bullish Order Blocks (Demand) Automatically detects Bearish Order Blocks (Supply) Marks high-probability reversal zones Filters out weak OBs with volume and break-of-structure (BOS) confirmation 2. Buyer
Candle x Env TPSL
Suriya Thammalungka
EA Description (English) Candle XENV TPSL Marti is an automated trading system designed to trade based on candle-structure breakouts combined with trend-filter logic. The EA intelligently manages position sizing using dynamic lot sizing, martingale recovery, and adaptive risk control. It is optimized for medium-term swing trading on H1 timeframes across major currency pairs. The algorithm is built to avoid over-trading, reduce drawdown risk, and self-adjust to market volatility. With improved
Engulfing Scalping EA
Suriya Thammalungka
Engulfing Scalping EA is a fully automated Expert Advisor designed for traders who appreciate the reliability of Price Action combined with a robust recovery mechanism. This EA operates based on the classic Engulfing Candle Pattern , one of the most powerful reversal and continuation signals in technical analysis. It does not rely on lagging indicators; instead, it reads raw market sentiment directly from the charts. How It Works The logic is divided into two intelligent phases: 1. Continuous En
Smart FIFO Grid Pro MT4
Suriya Thammalungka
Smart FIFO Grid Pro: Fuel Sentinel Edition Headline: The Intelligent Grid System with "Profit Recycling" Technology. Now features customizable 'Fuel Days' and real-time Margin Health Monitoring. ️ Overview Smart FIFO Grid Pro is a next-generation trading system designed for traders who prioritize Account Preservation over reckless gambling. Unlike traditional martingale grids that simply hope for a reversal, this EA actively manages risk by "recycling" your secured profits to reduce drawdown.
Auto Trendline Fibo Dow Theory - Automated Price Action & Structure Analysis Overview: Stop drawing manual trendlines and Fibonacci retracements! Auto Trendline Fibo Dow Theory  is a powerful price action utility designed to automate your technical analysis based on the classic Dow Theory and Fibonacci ratios. This indicator scans market structure using a customizable ZigZag algorithm to identify higher highs, higher lows (Uptrend), or lower highs, lower lows (Downtrend). It automatically plots
MACD Hist Breakout Indy
Suriya Thammalungka
Introduction Stop trading lagging zero-line crosses and start trading pure momentum. The MACD 1-2-3 Momentum Breakout PRO is an advanced algorithm designed exclusively for MetaTrader 5. It tracks the internal "breathing cycle" of the market to identify high-probability momentum shifts using a strict, multi-step algorithmic cycle. Now updated to Version 1.03 , this indicator features a complete multi-channel alert system and introduces Dynamic Visual Breakout Levels —giving you absolute clarity o
筛选:
无评论
回复评论