Support and Resistance Screener Pro MT5
- 指标
-
STE S.S.COMPANY
 Hello,
my name is Ashraf a fintech Software Engineer.
I create amazing forex indicators and expert advisors for Metatrader 4 and Metatrader 5, the best trading platforms.
Use my service and let me build your trading strategies ( Indicator coding or EA coding ) by click on bellow link - 版本: 13.20
- 更新: 13 十二月 2023
- 激活: 10
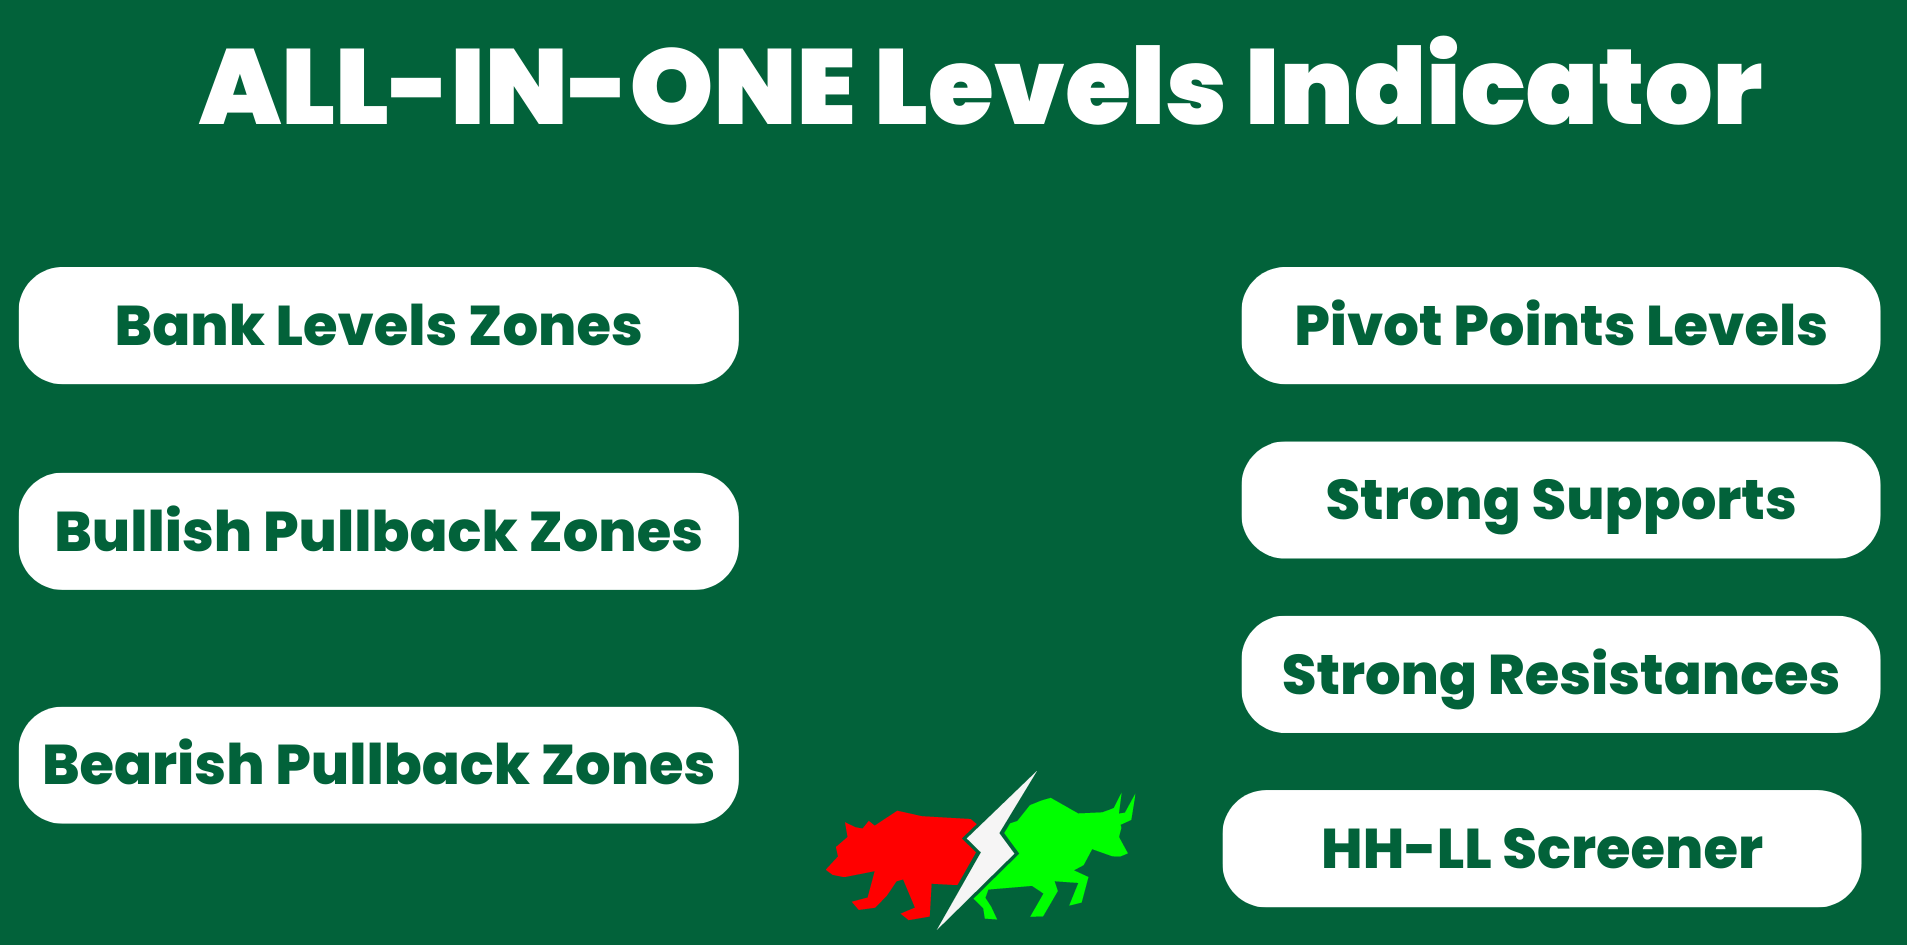
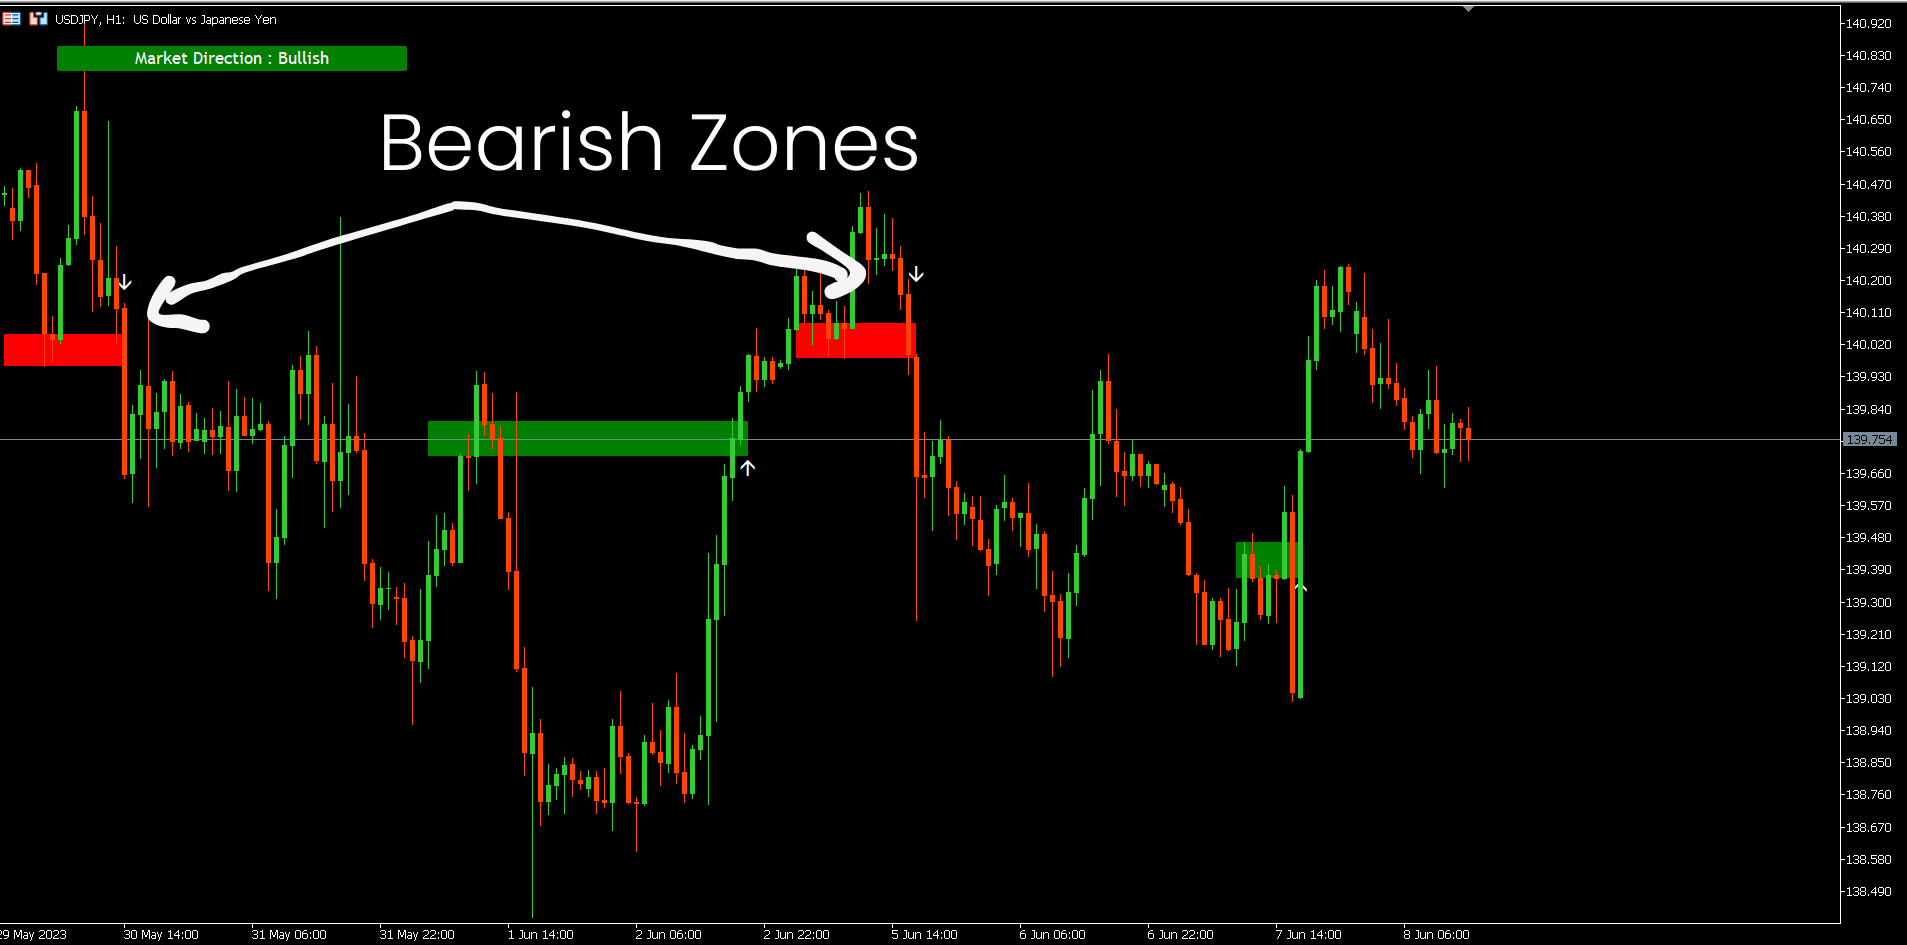
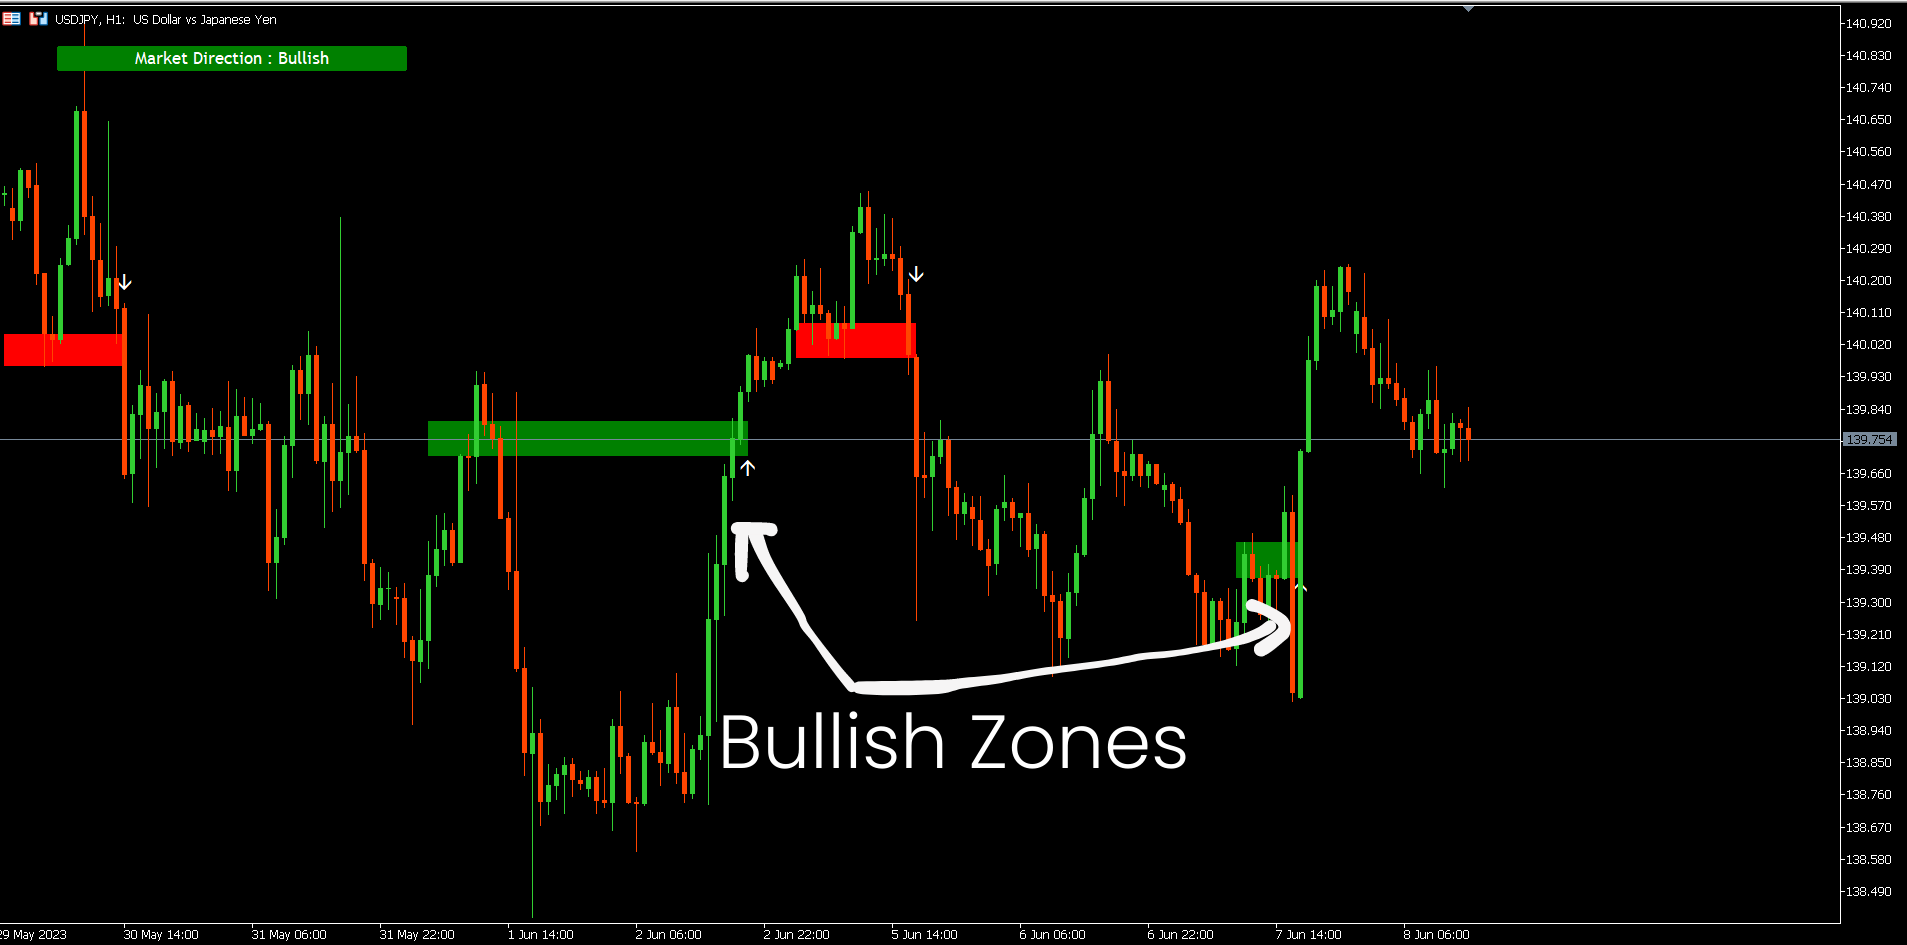
支撑和阻力筛选器是 MetaTrader 的一个级别指标,它在一个指标内提供多种工具。 可用的工具有:
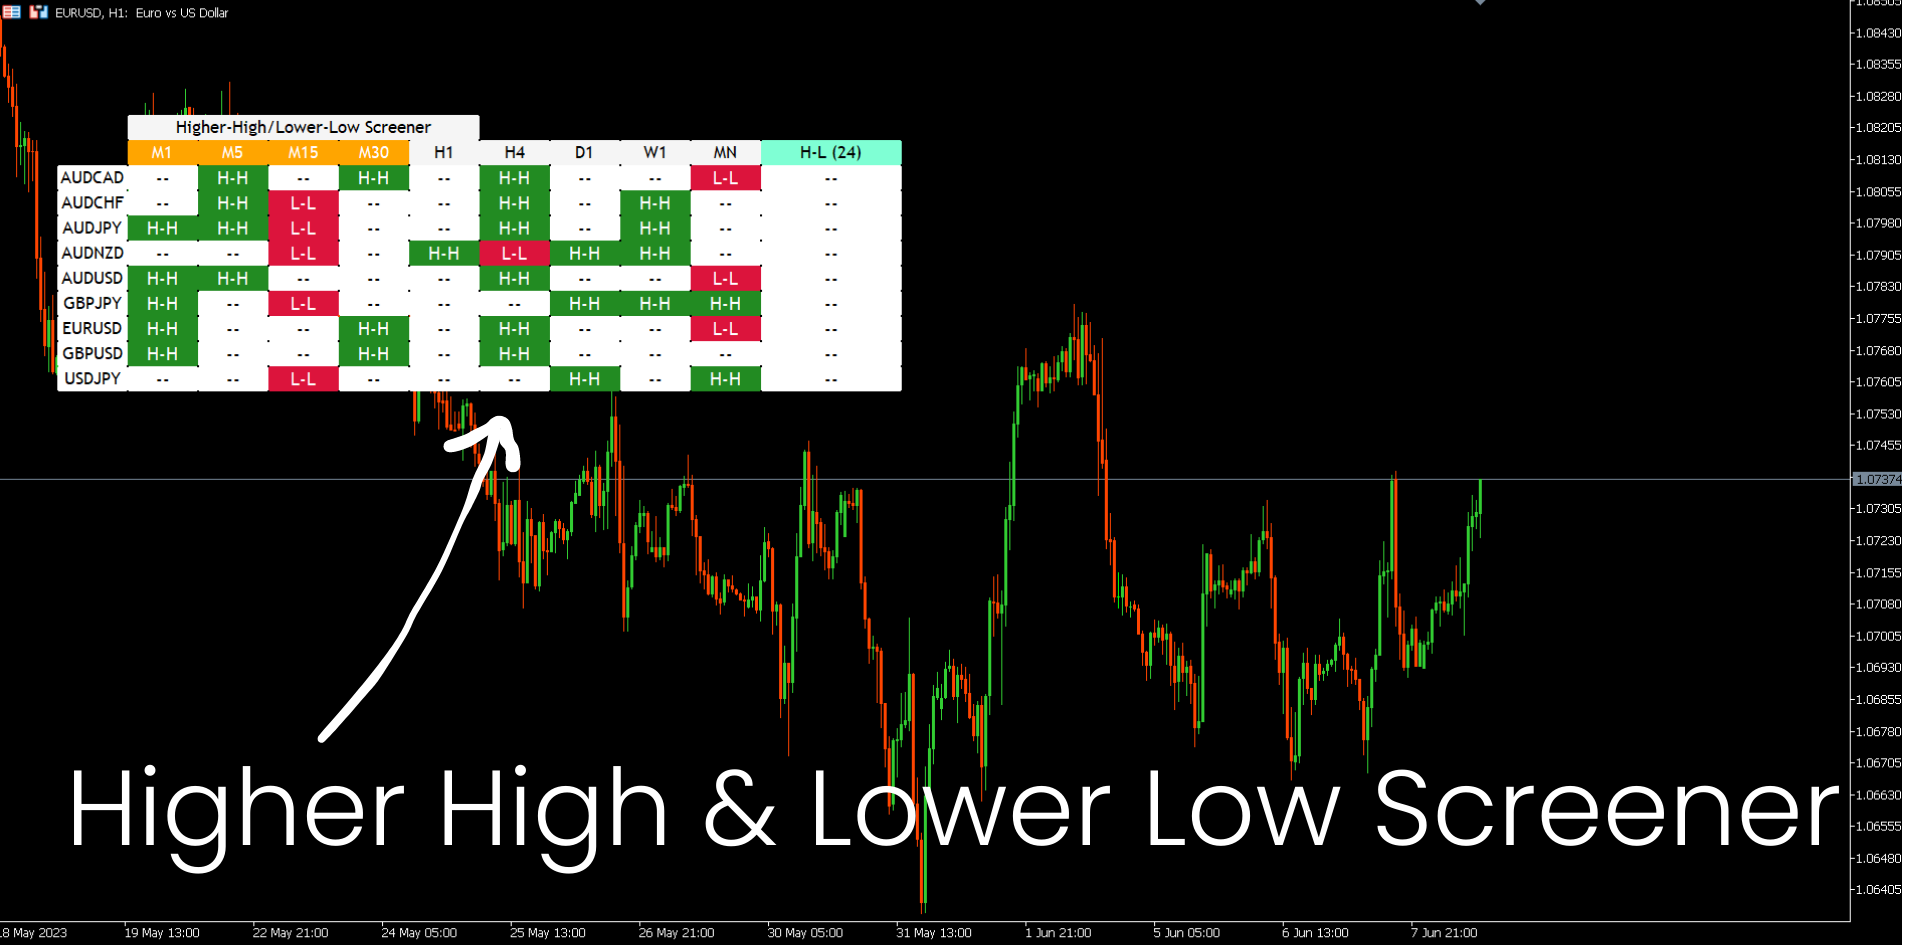
1. 市场结构筛选器。
2. 看涨回调区。
3. 看跌回调区。
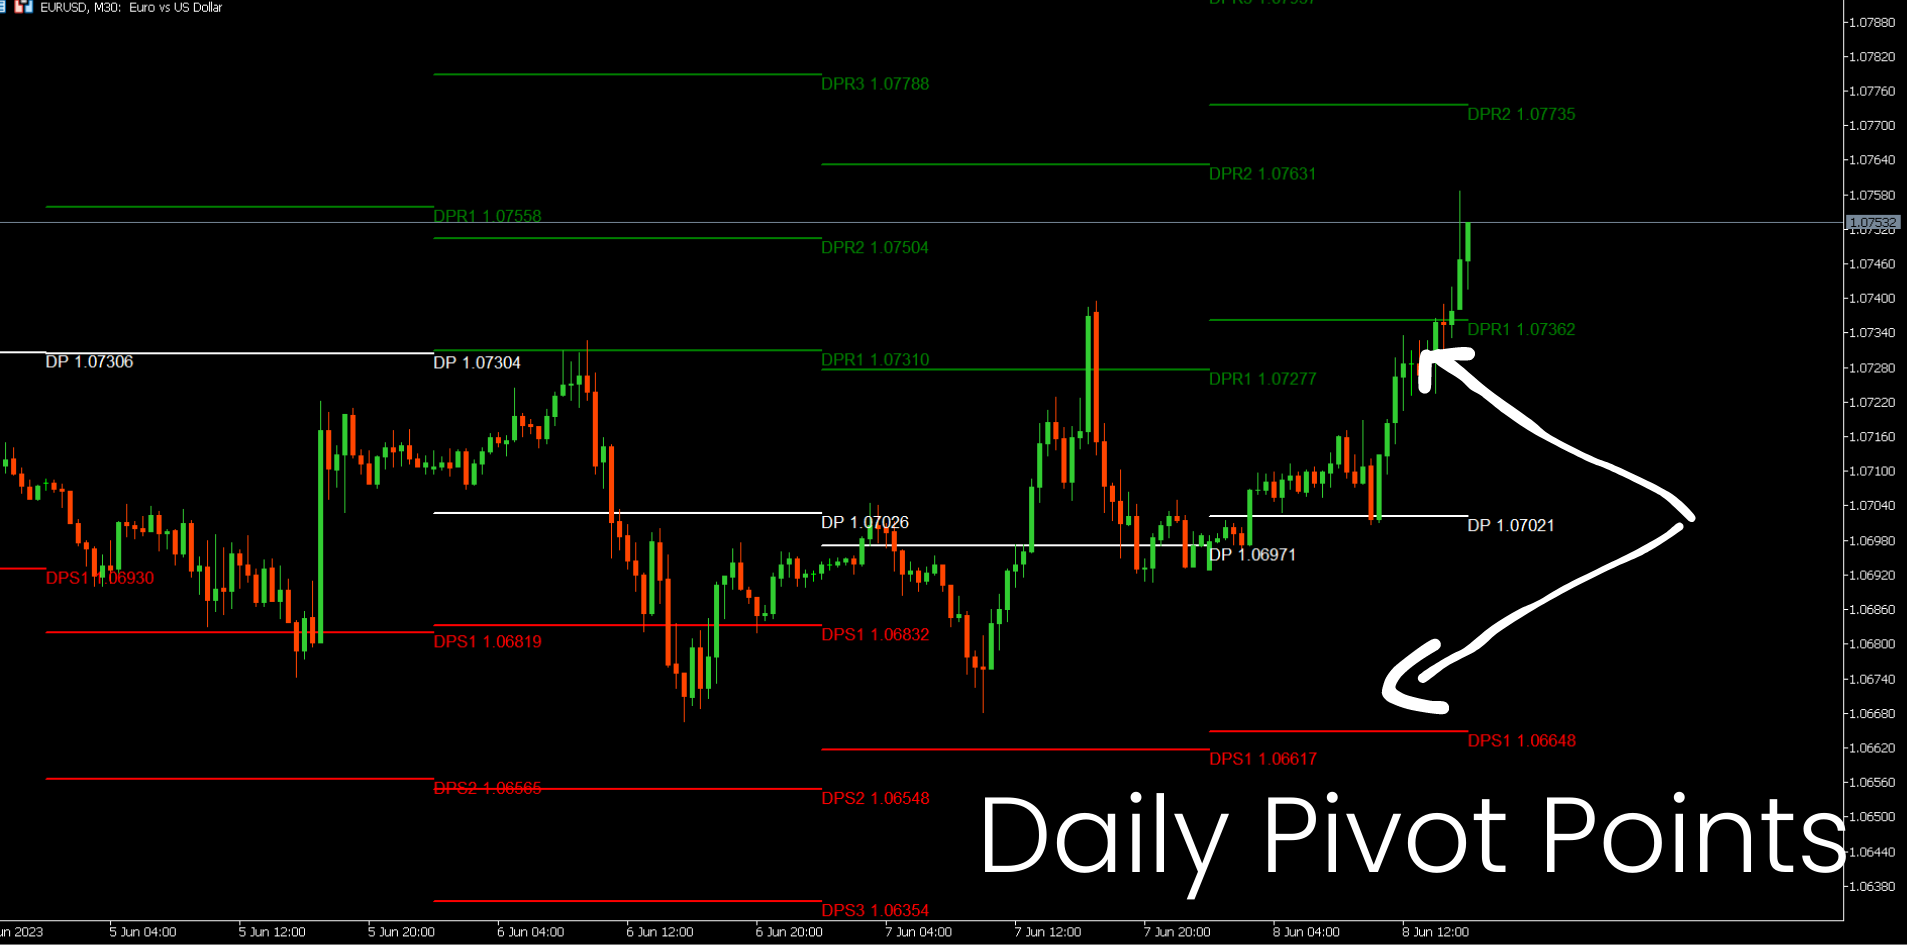
4.每日枢轴点
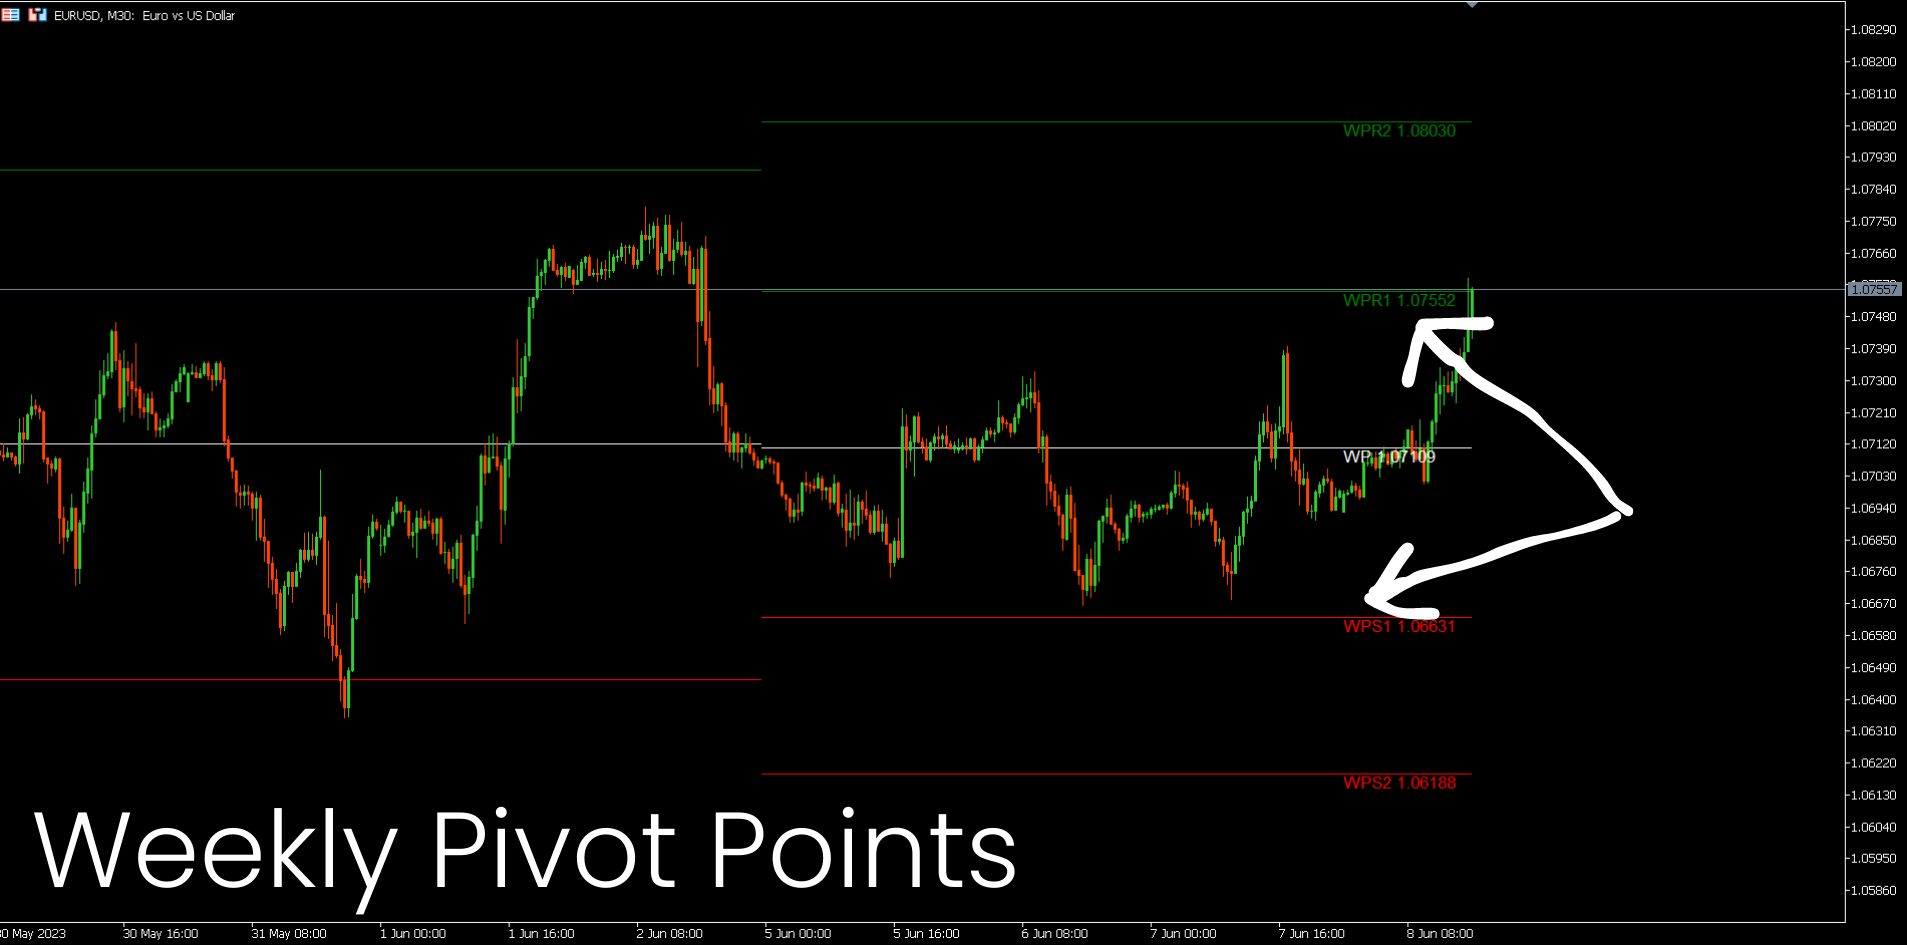
5.每周枢轴点
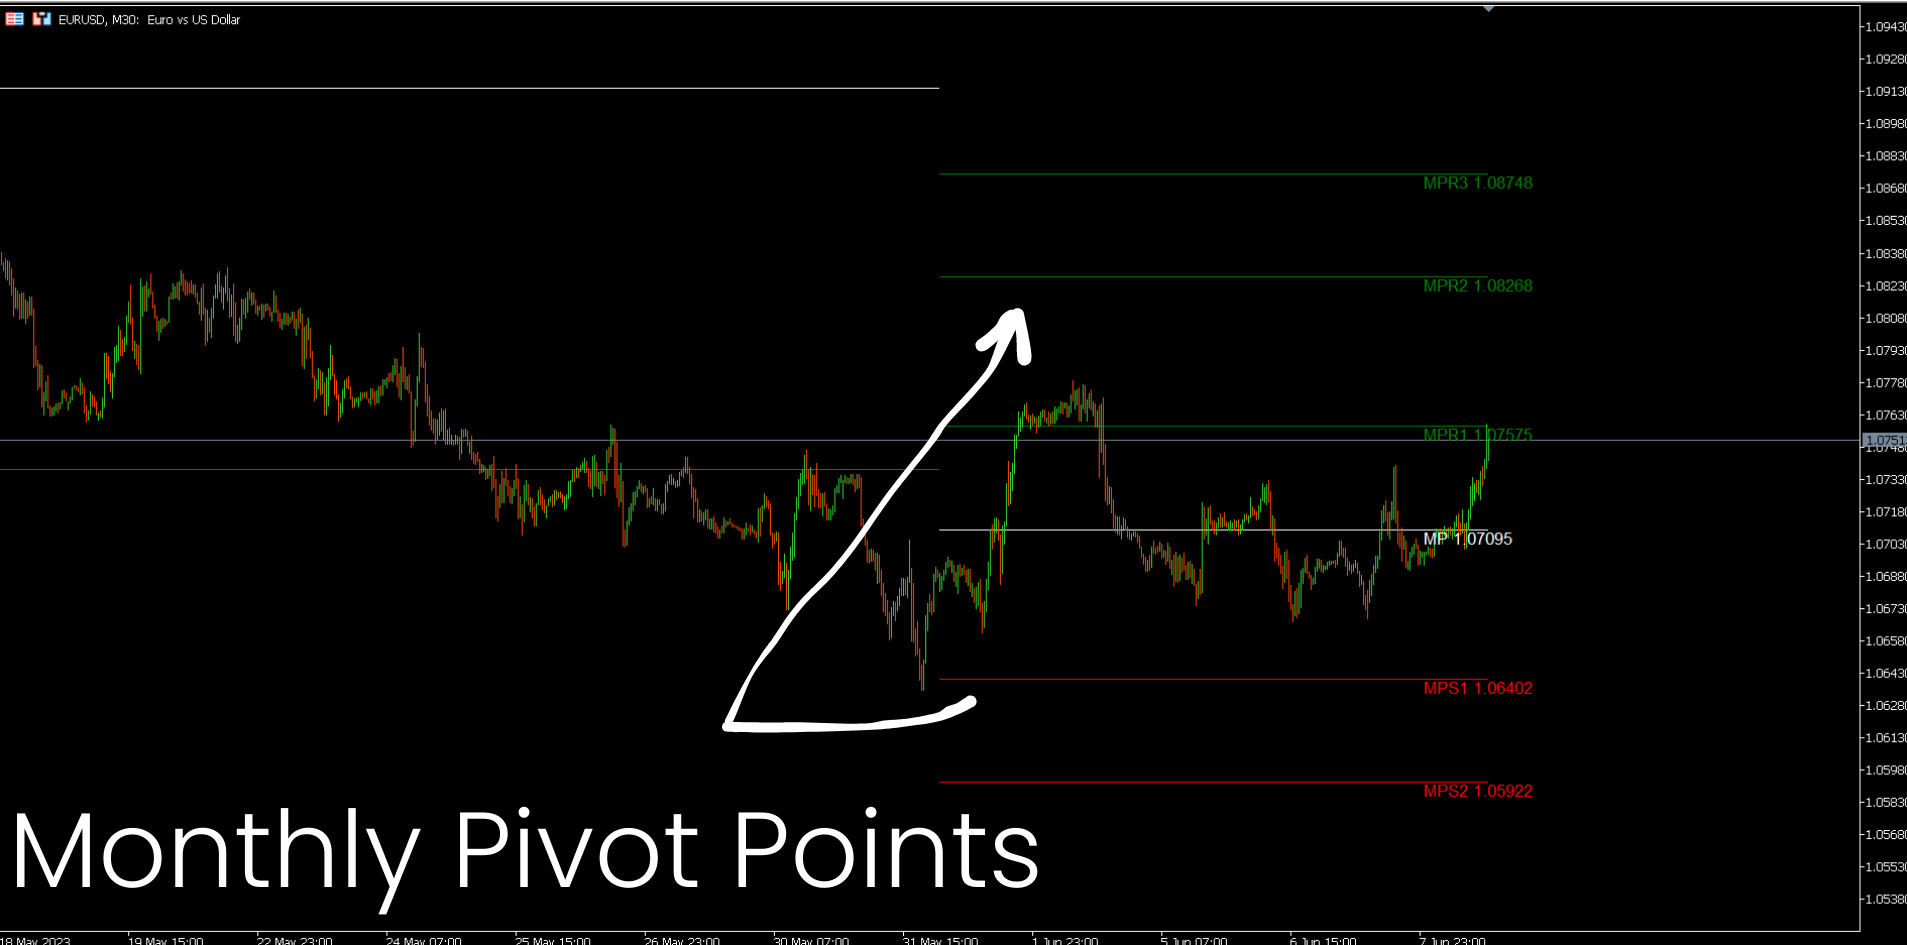
6. 每月枢轴点
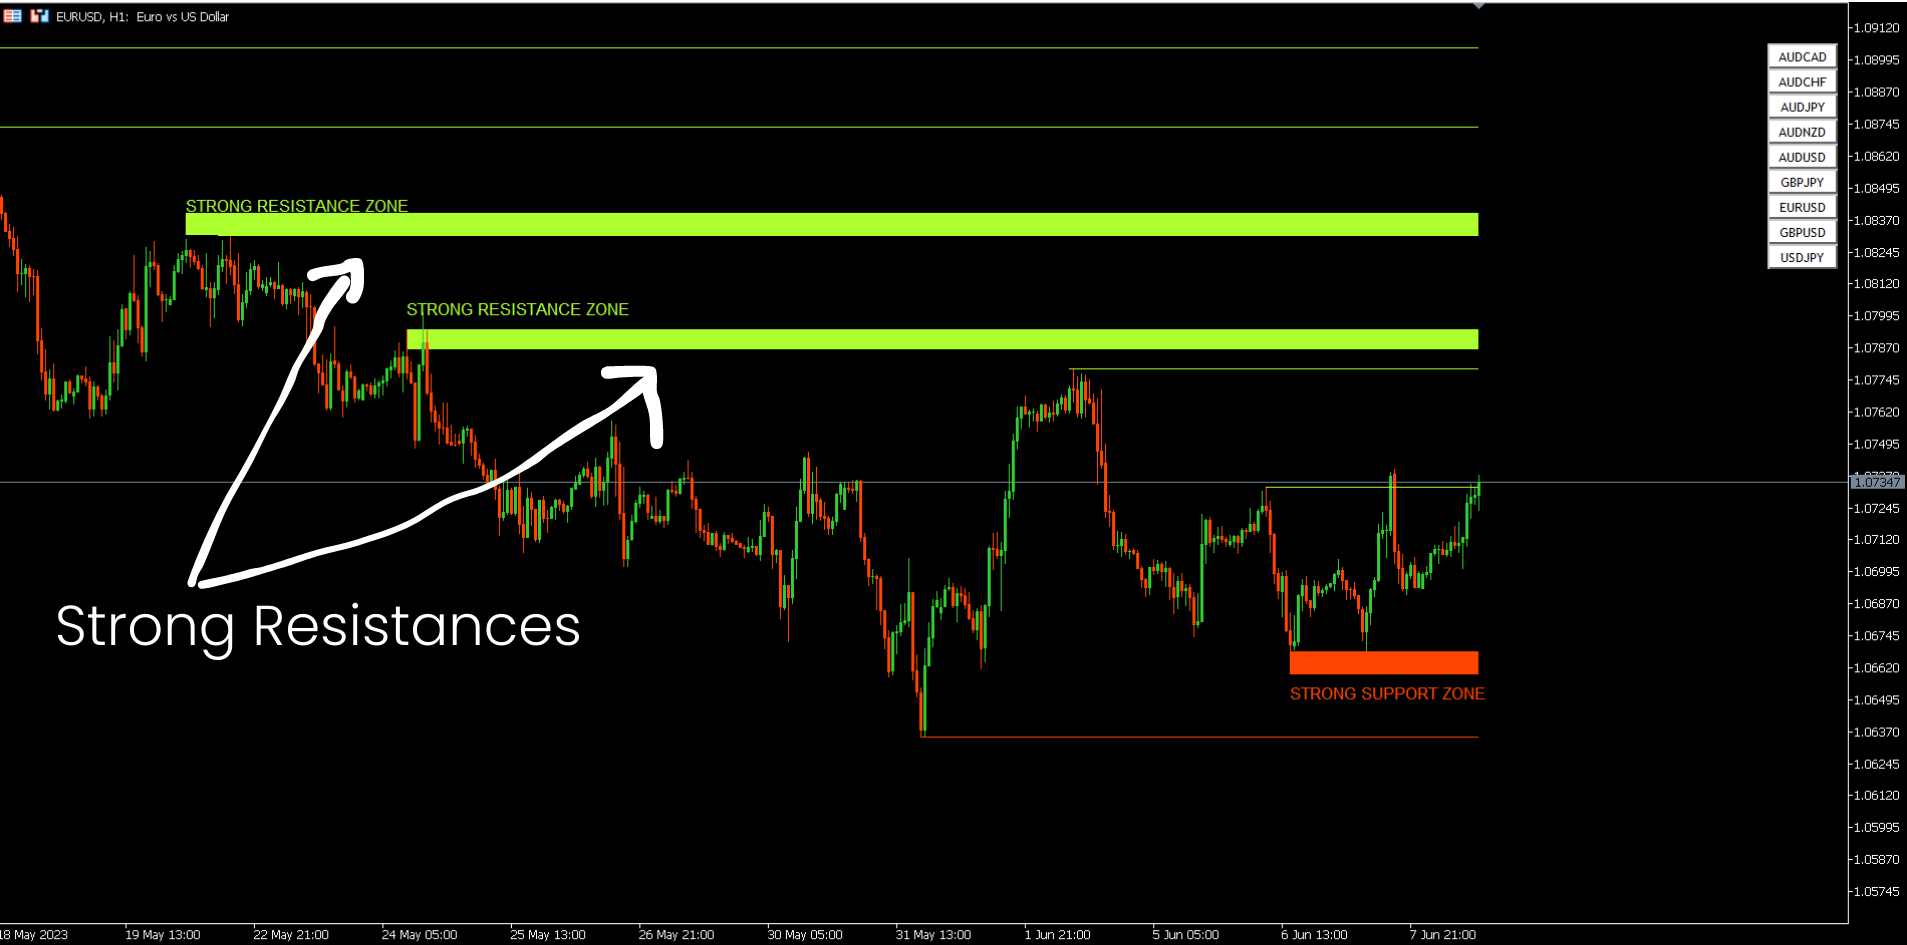
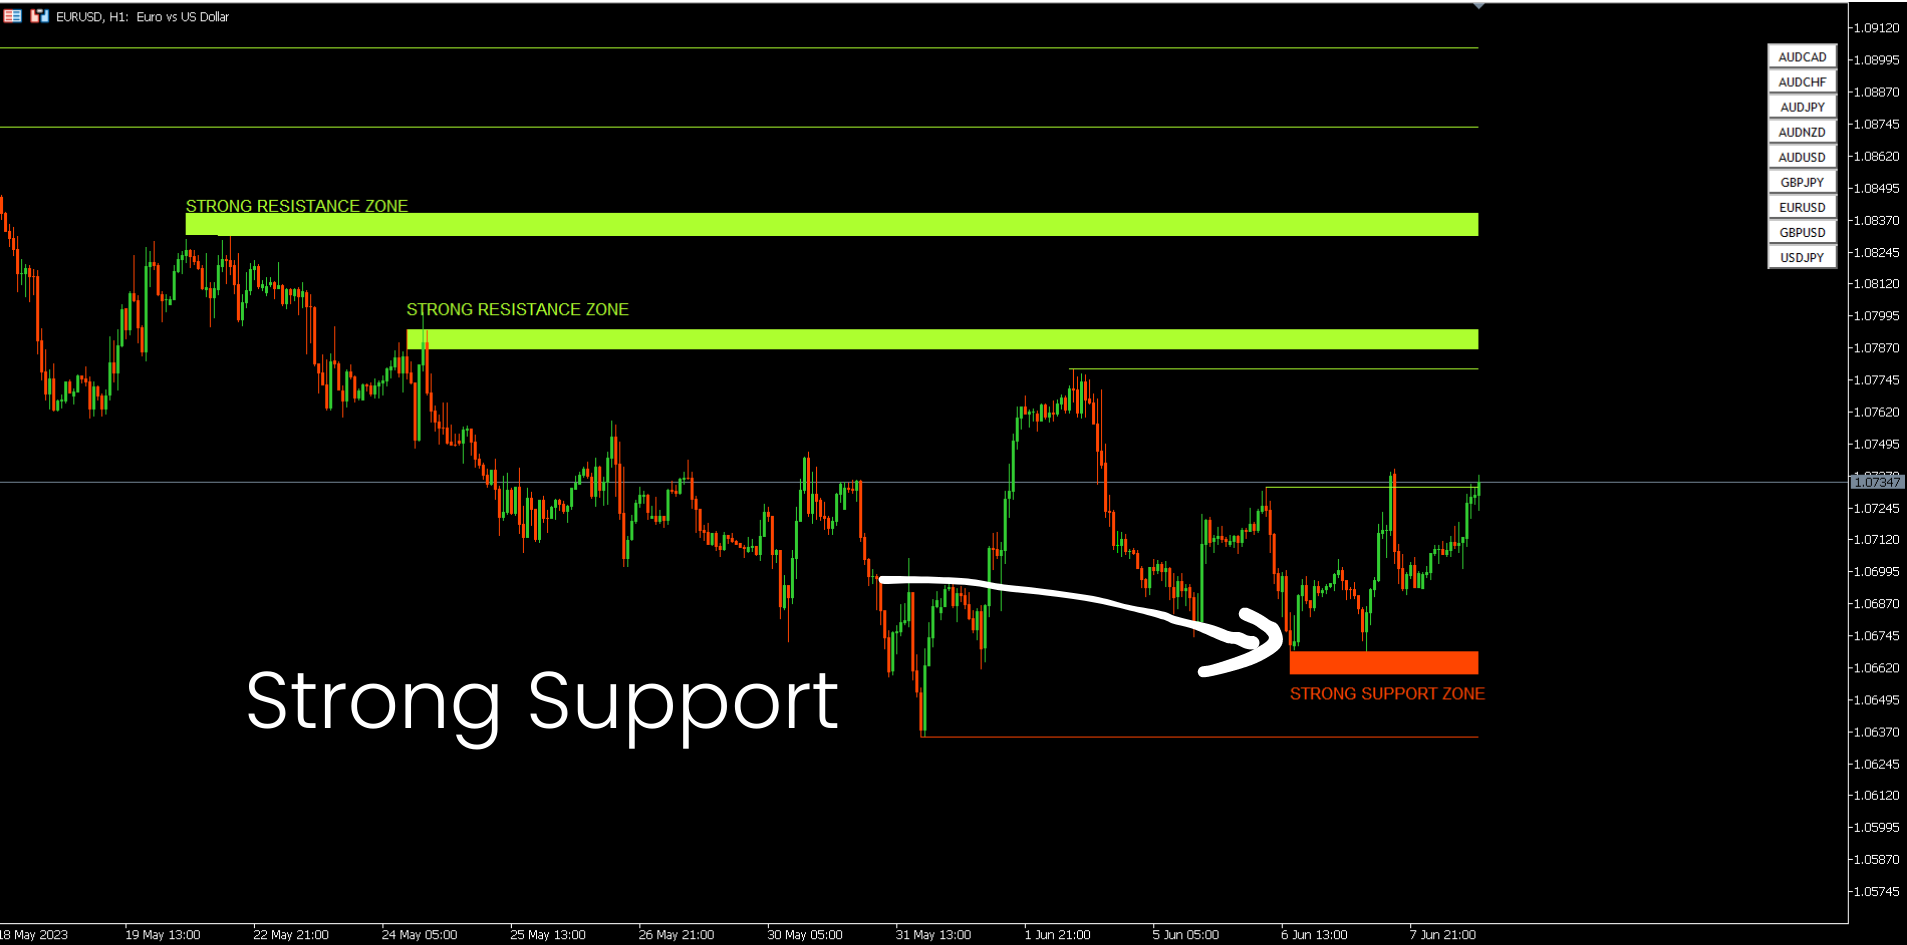
7. 基于谐波形态和成交量的强大支撑和阻力。
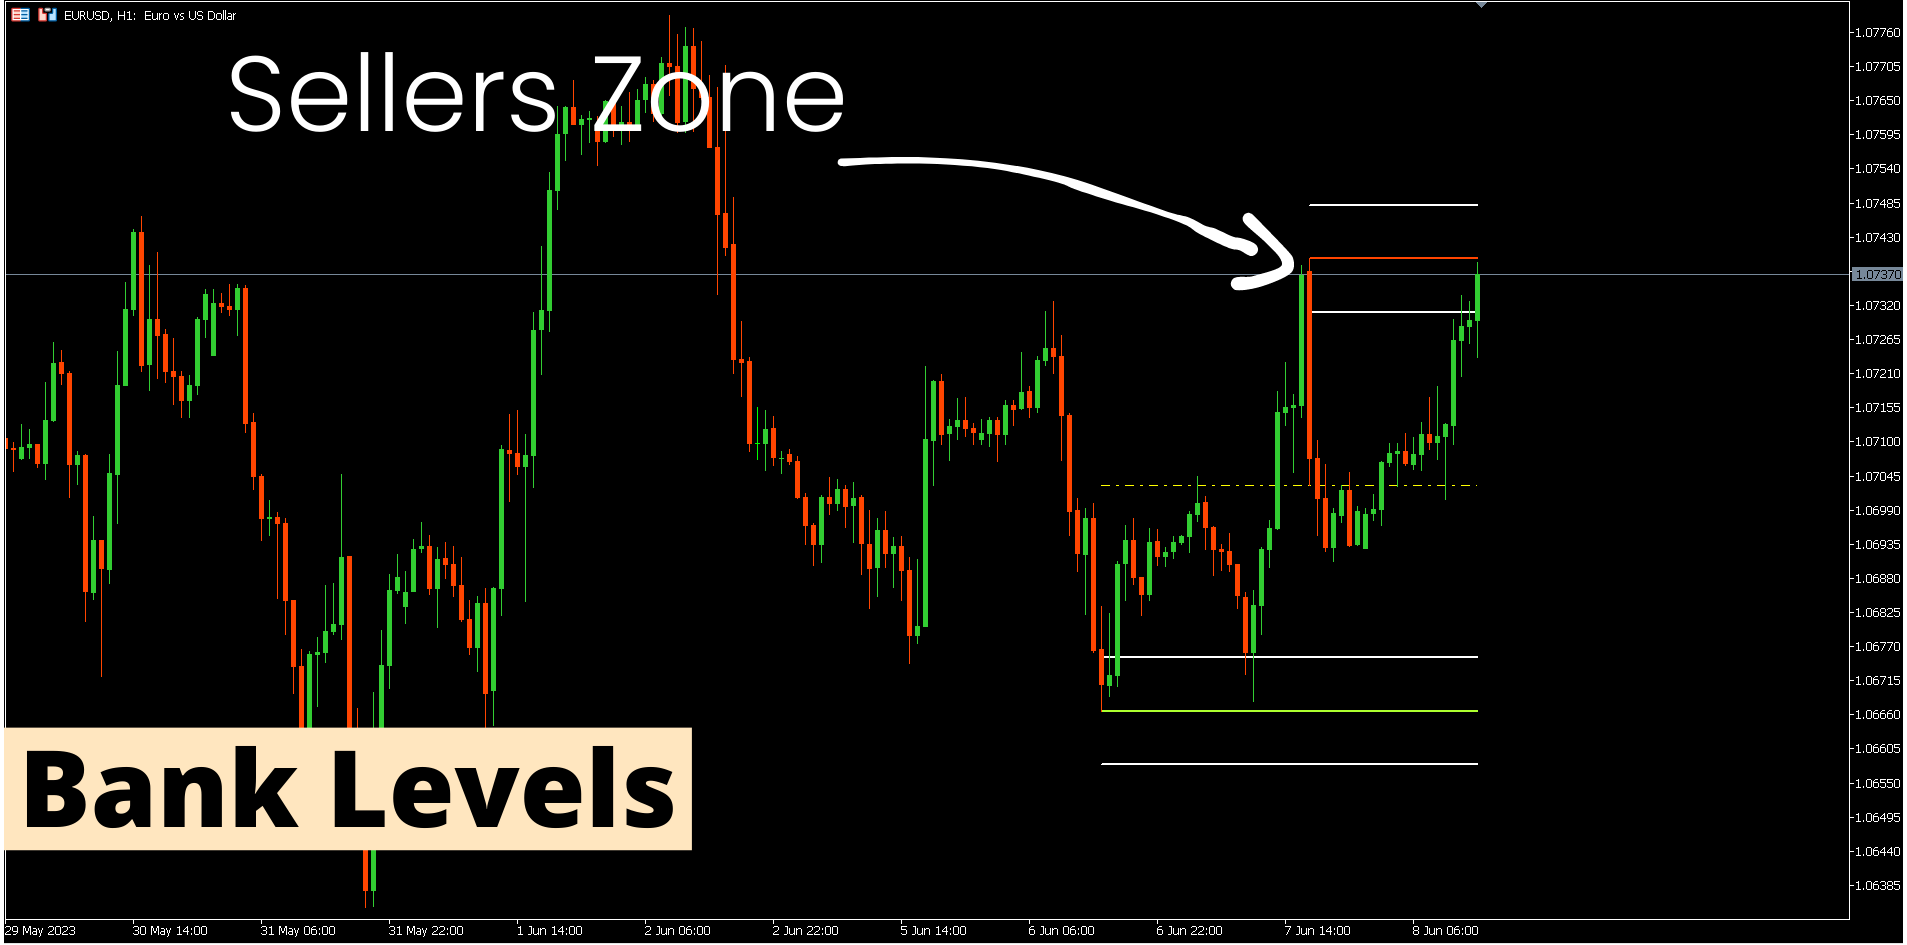
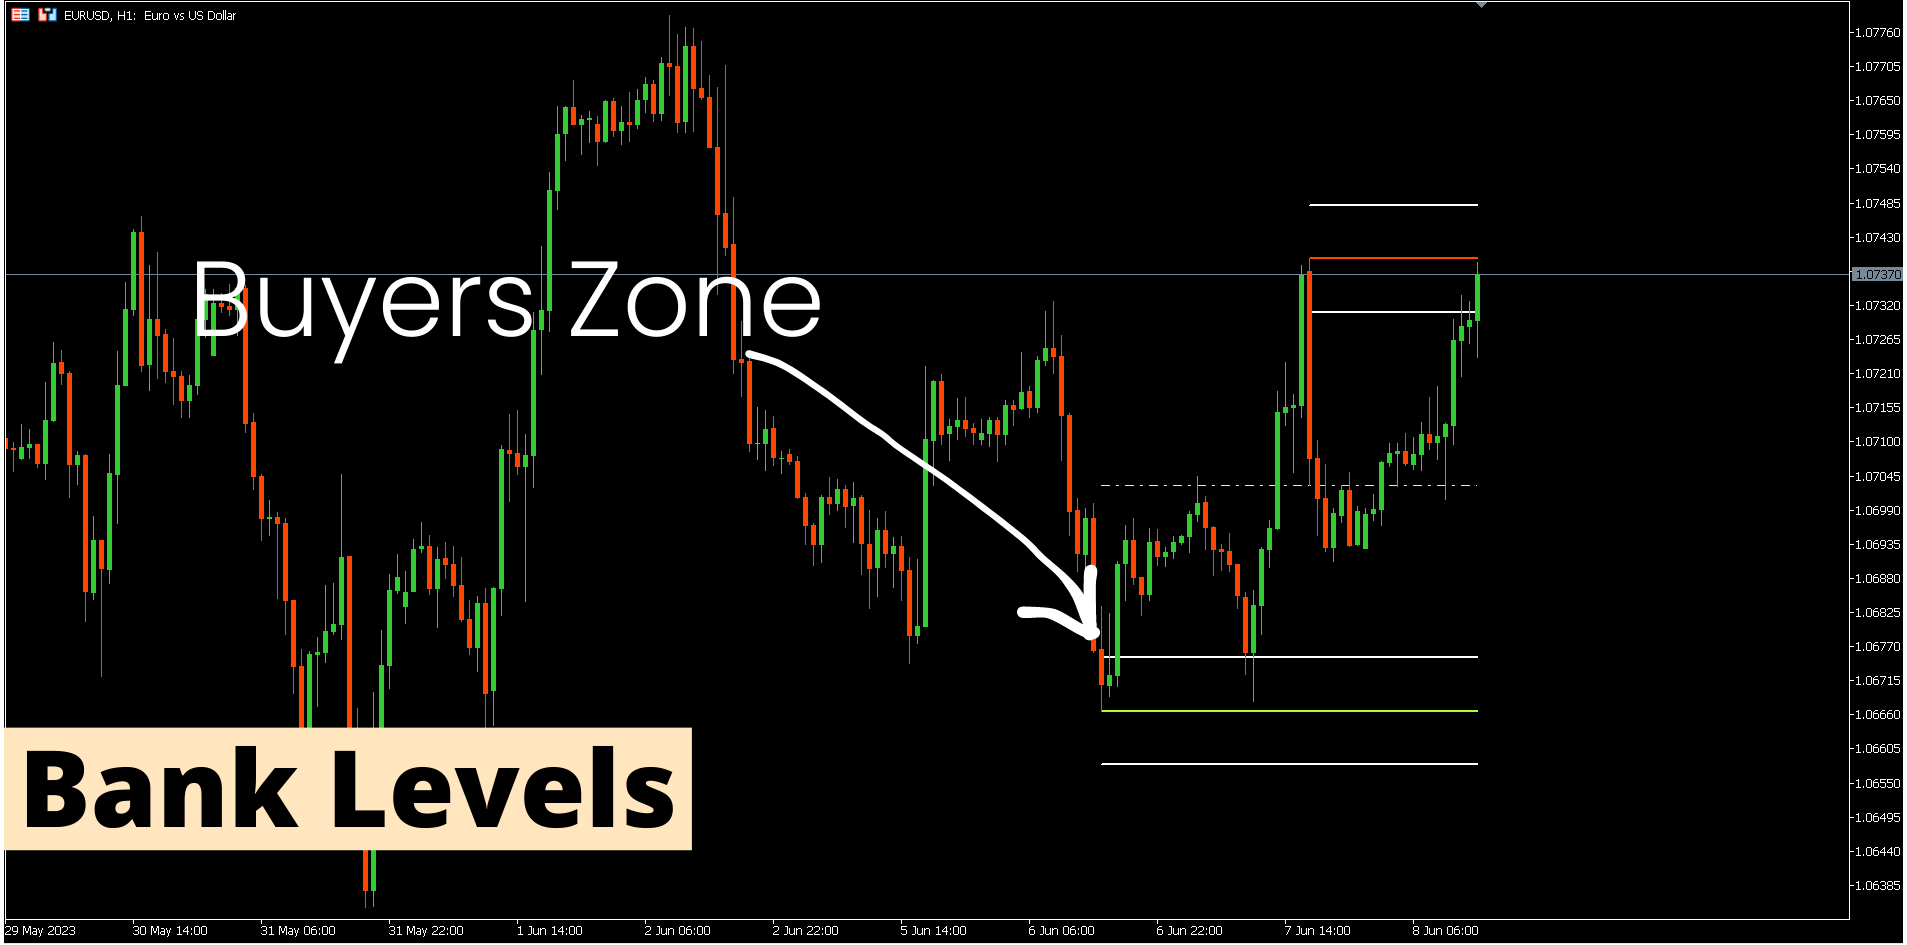
8. 银行级区域。
限时优惠:HV 支撑和阻力指示器仅售 50 美元且终生可用。 (原价 125$)
通过访问我们的 MQL5 博客,您可以找到我们所有带有分析示例的高级指标:单击此处
主要特点
- 基于谐波和音量算法的强大支撑和阻力区域。
- 基于谐波和成交量算法的看涨和看跌回调区域。
- 市场结构筛选器
- 每日、每周和每月的枢轴点。
文档
所有支持和阻力筛选器文档(说明)和策略详细信息均可在我们 MQL5 博客的这篇文章中找到:单击此处。 接触
作者
SAYADI ACHREF,金融科技软件工程师,Finansya 创始人。 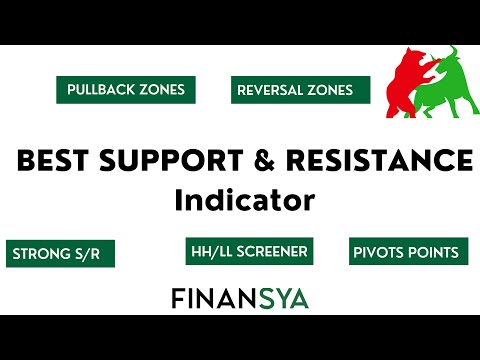


The Best Support and Resistance Indicator on the Market This indicator clearly outperforms every other support and resistance tool I have used in MetaTrader. Support and Resistance Screener Pro MT5 delivers highly accurate and meaningful levels, institutional zones, pivots, structures, and key points that would normally take a lot of time to analyze manually. What I like the most: - Very precise detection of real market zones. - Multi-timeframe and multi-symbol scanning. - Clean and organized visual presentation without noise. - Helps me take faster and better trading decisions. After using it, my market analysis improved immediately. It is a professional and reliable tool with no repainting. I fully recommend it 100%.