Support and Resistance Screener Pro MT5
- 지표
-
STE S.S.COMPANY
 Hello,
my name is Ashraf a fintech Software Engineer.
I create amazing forex indicators and expert advisors for Metatrader 4 and Metatrader 5, the best trading platforms.
Use my service and let me build your trading strategies ( Indicator coding or EA coding ) by click on bellow link - 버전: 13.20
- 업데이트됨: 13 12월 2023
- 활성화: 10
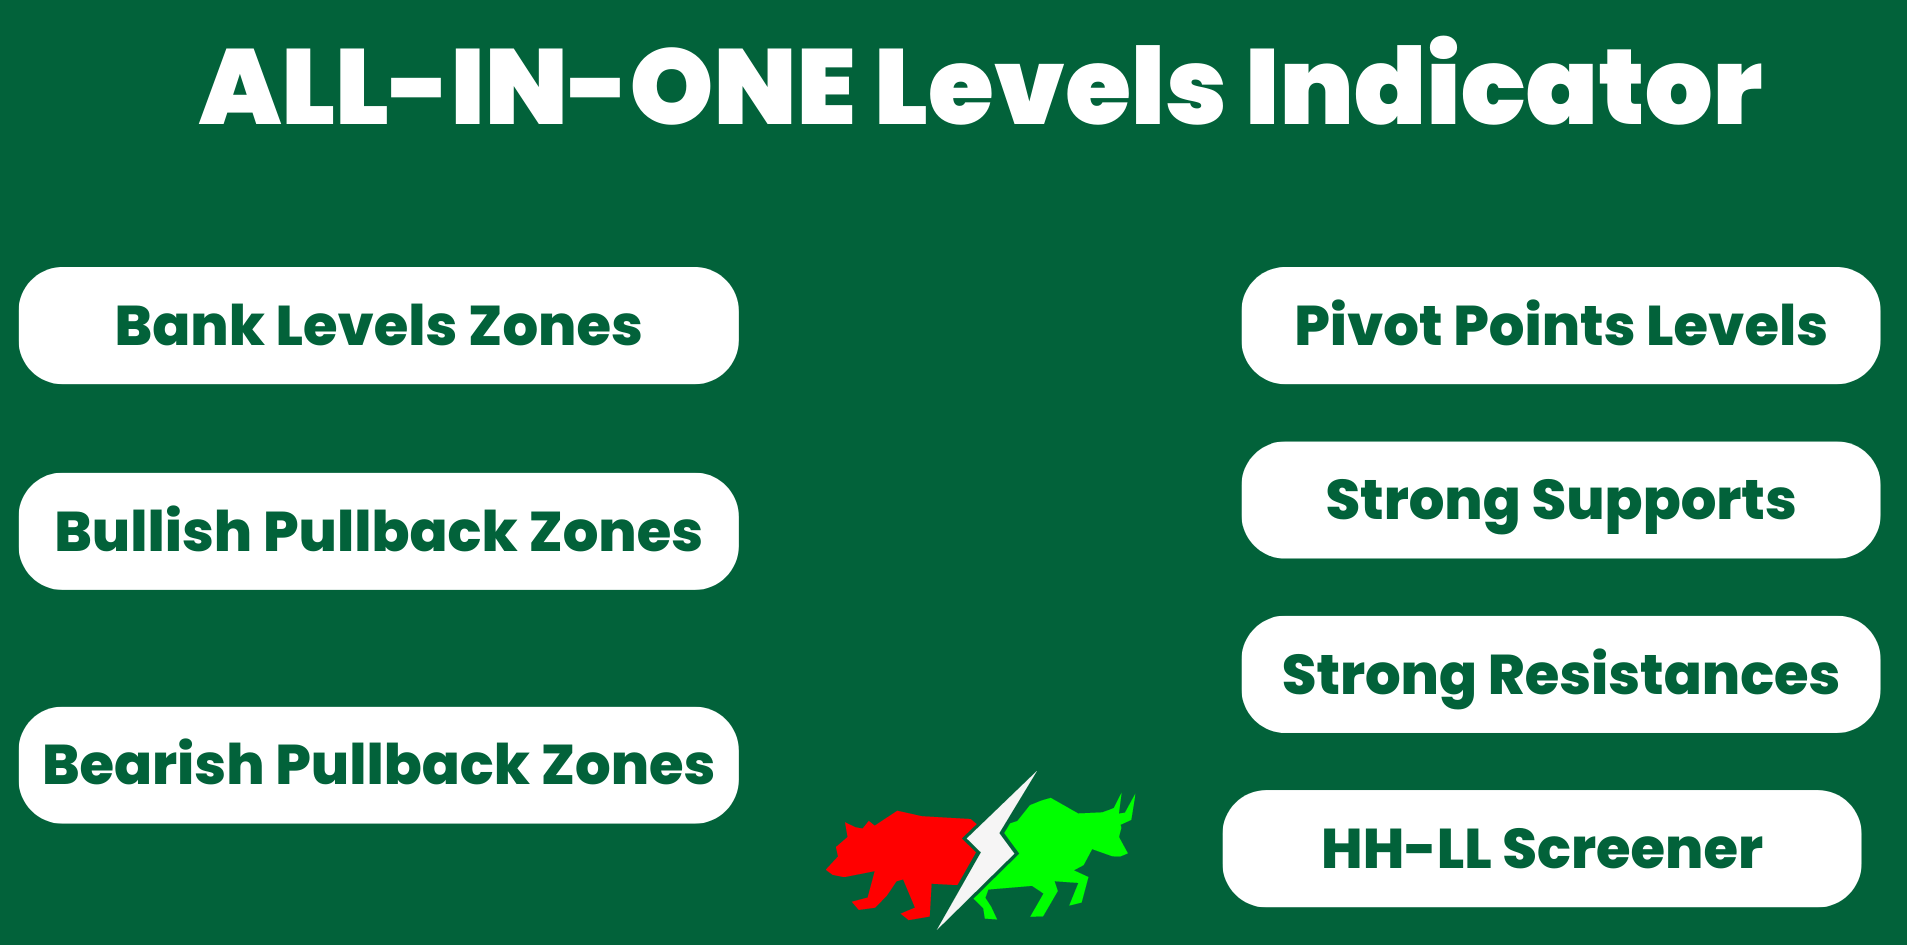
Support And Resistance Screener는 하나의 지표 안에 여러 도구를 제공하는 MetaTrader에 대한 하나의 레벨 지표입니다. 사용 가능한 도구는 다음과 같습니다.
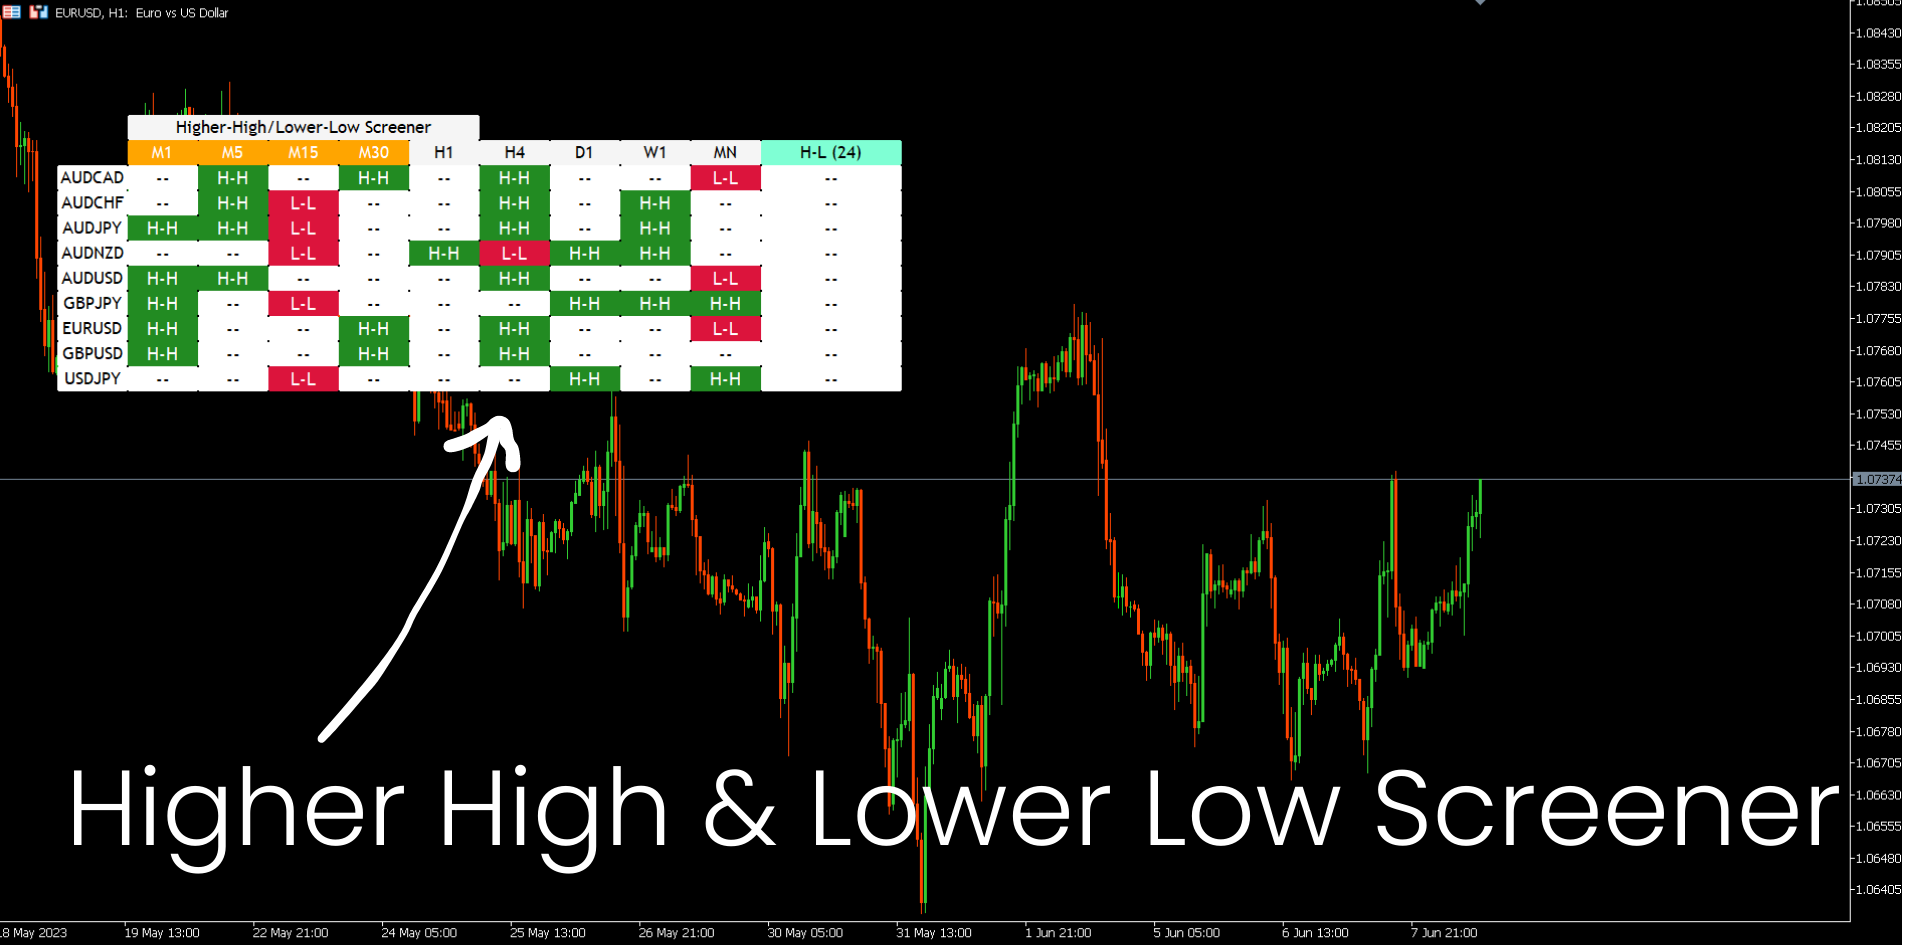
1. 시장 구조 스크리너.
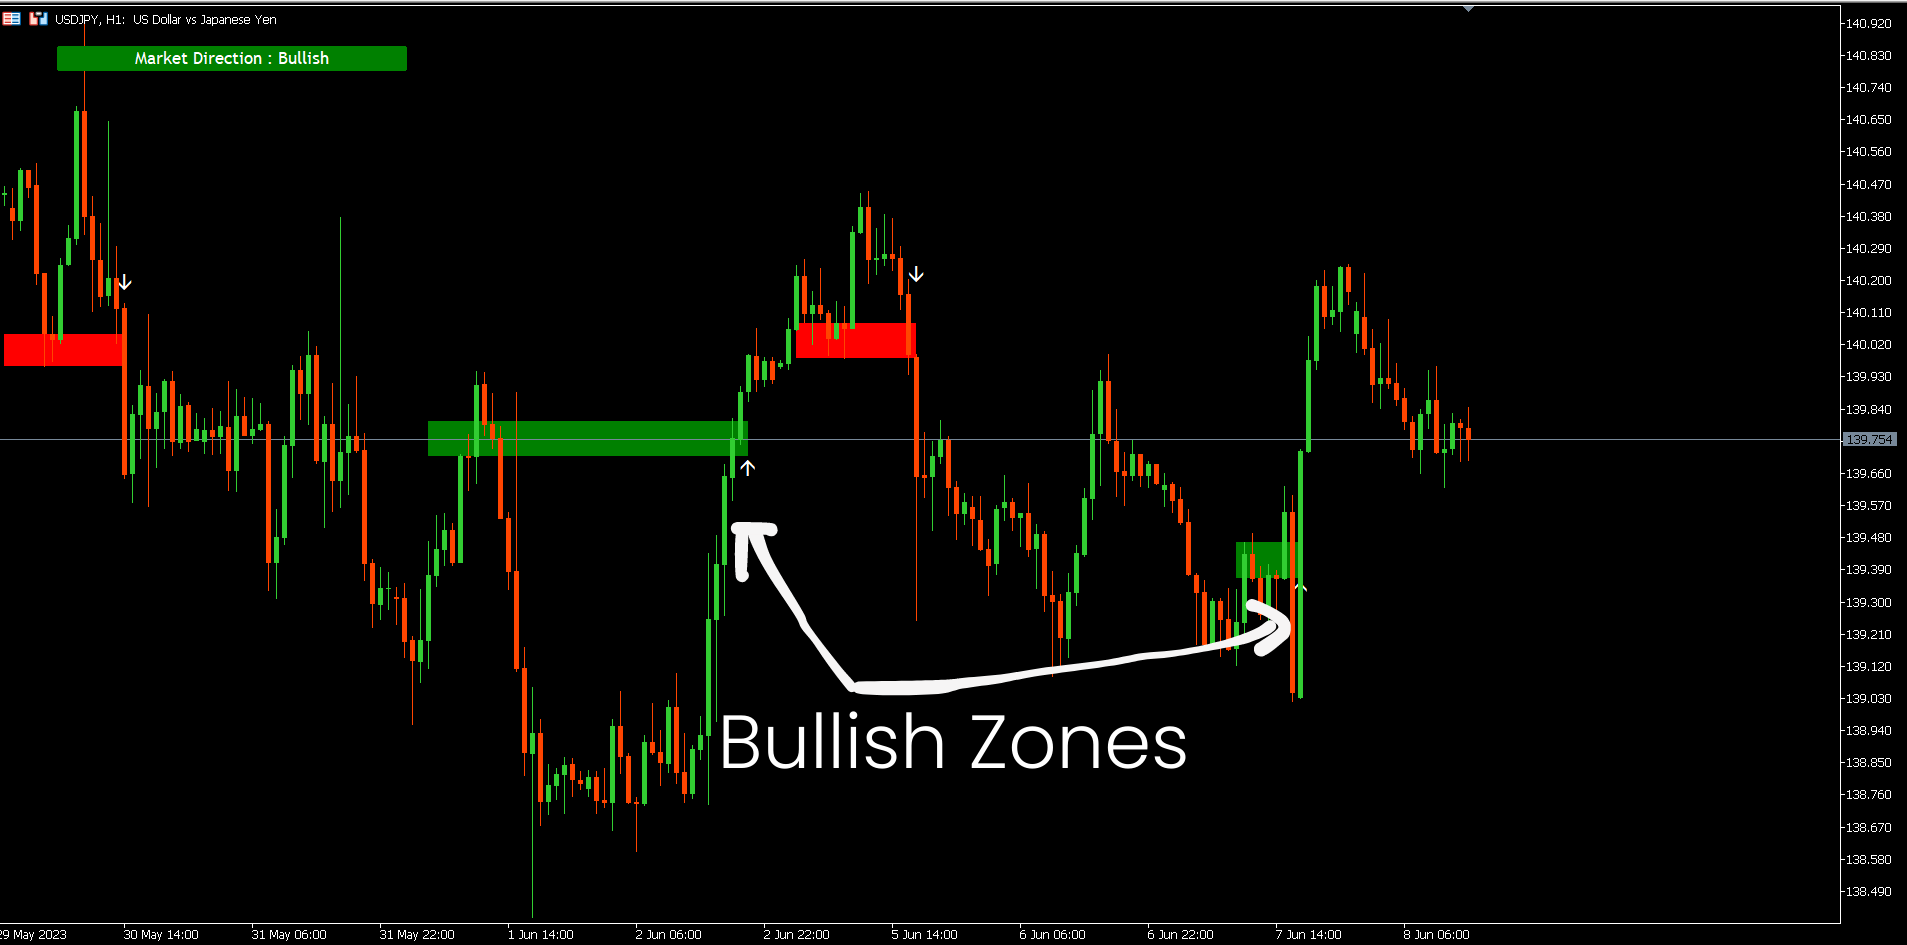
2. 완고한 후퇴 영역.
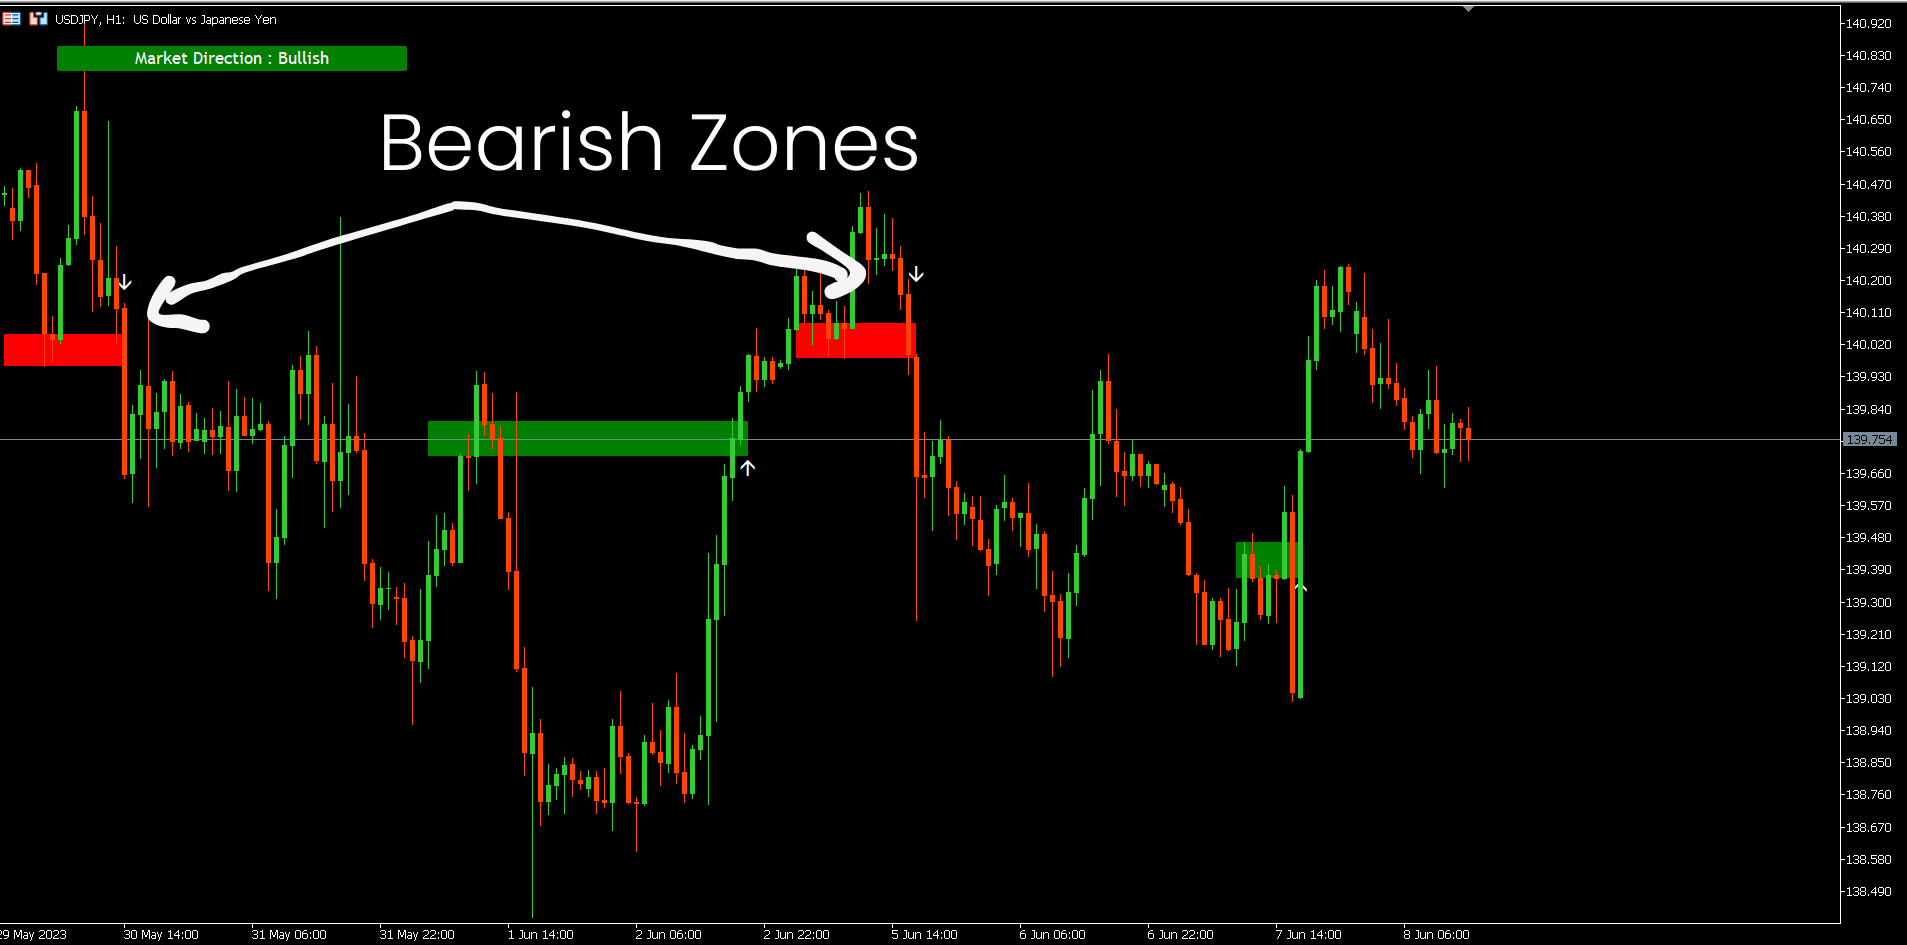
3. 약세 후퇴 영역.
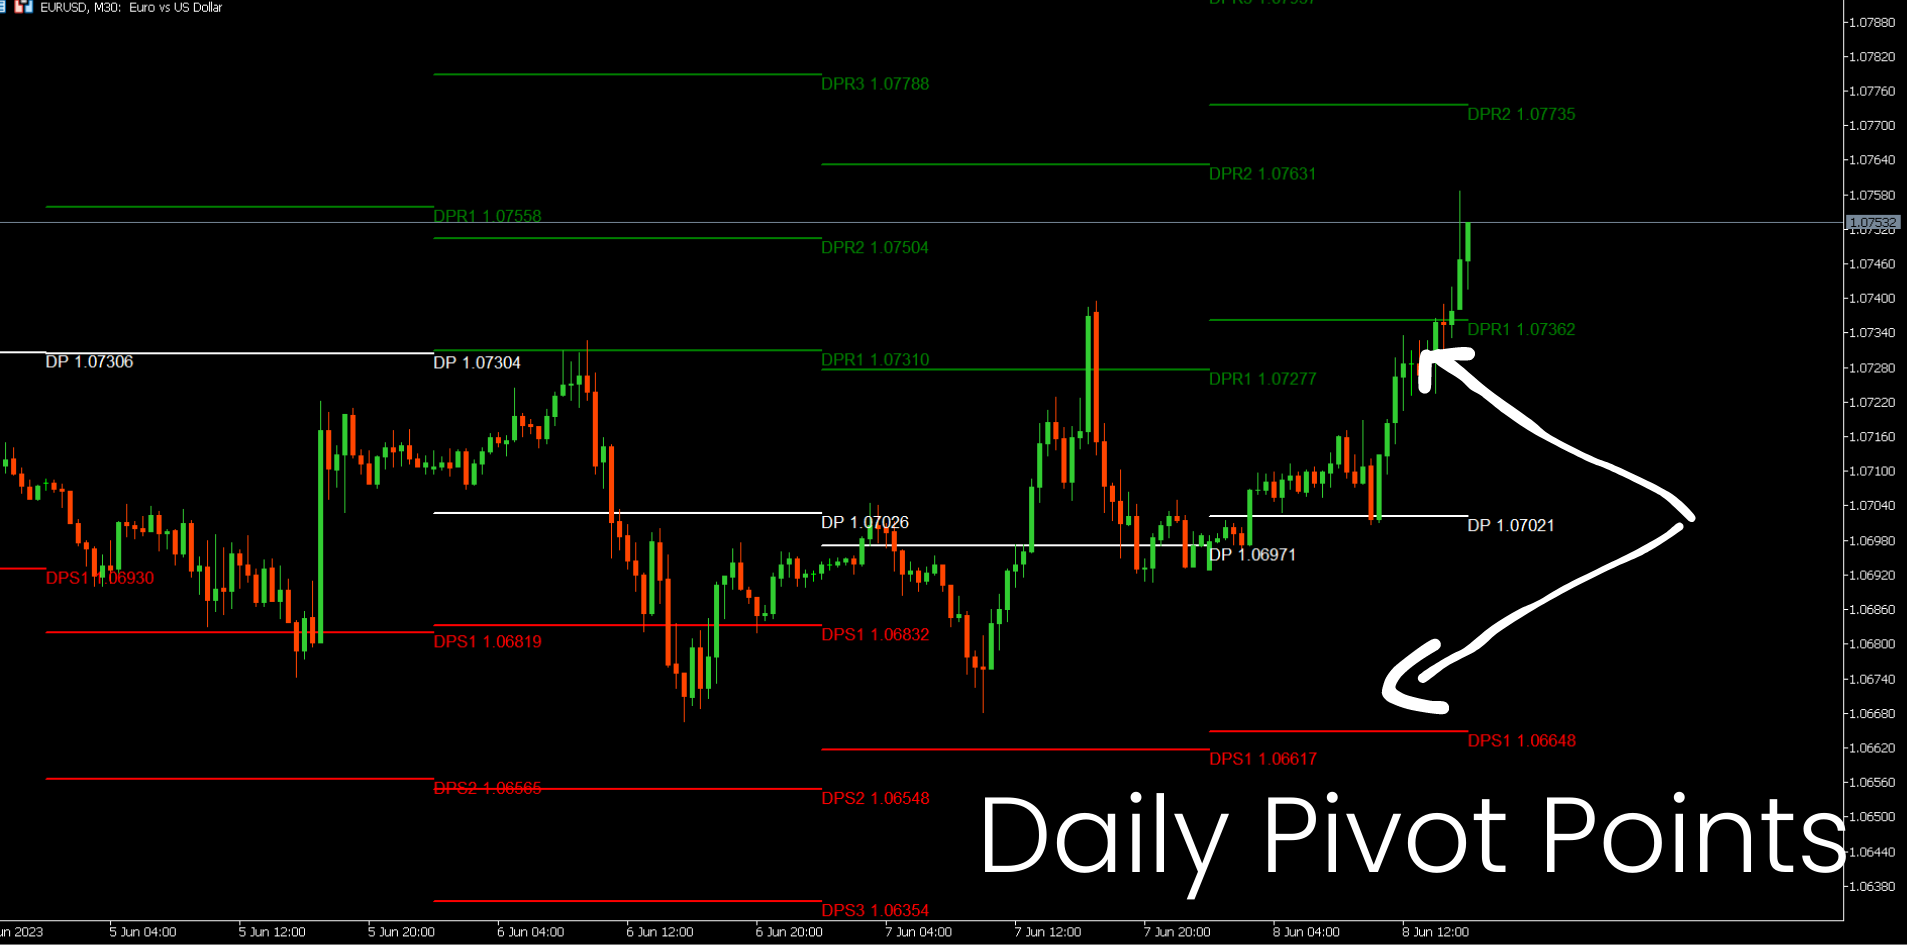
4. 일일 피벗 포인트
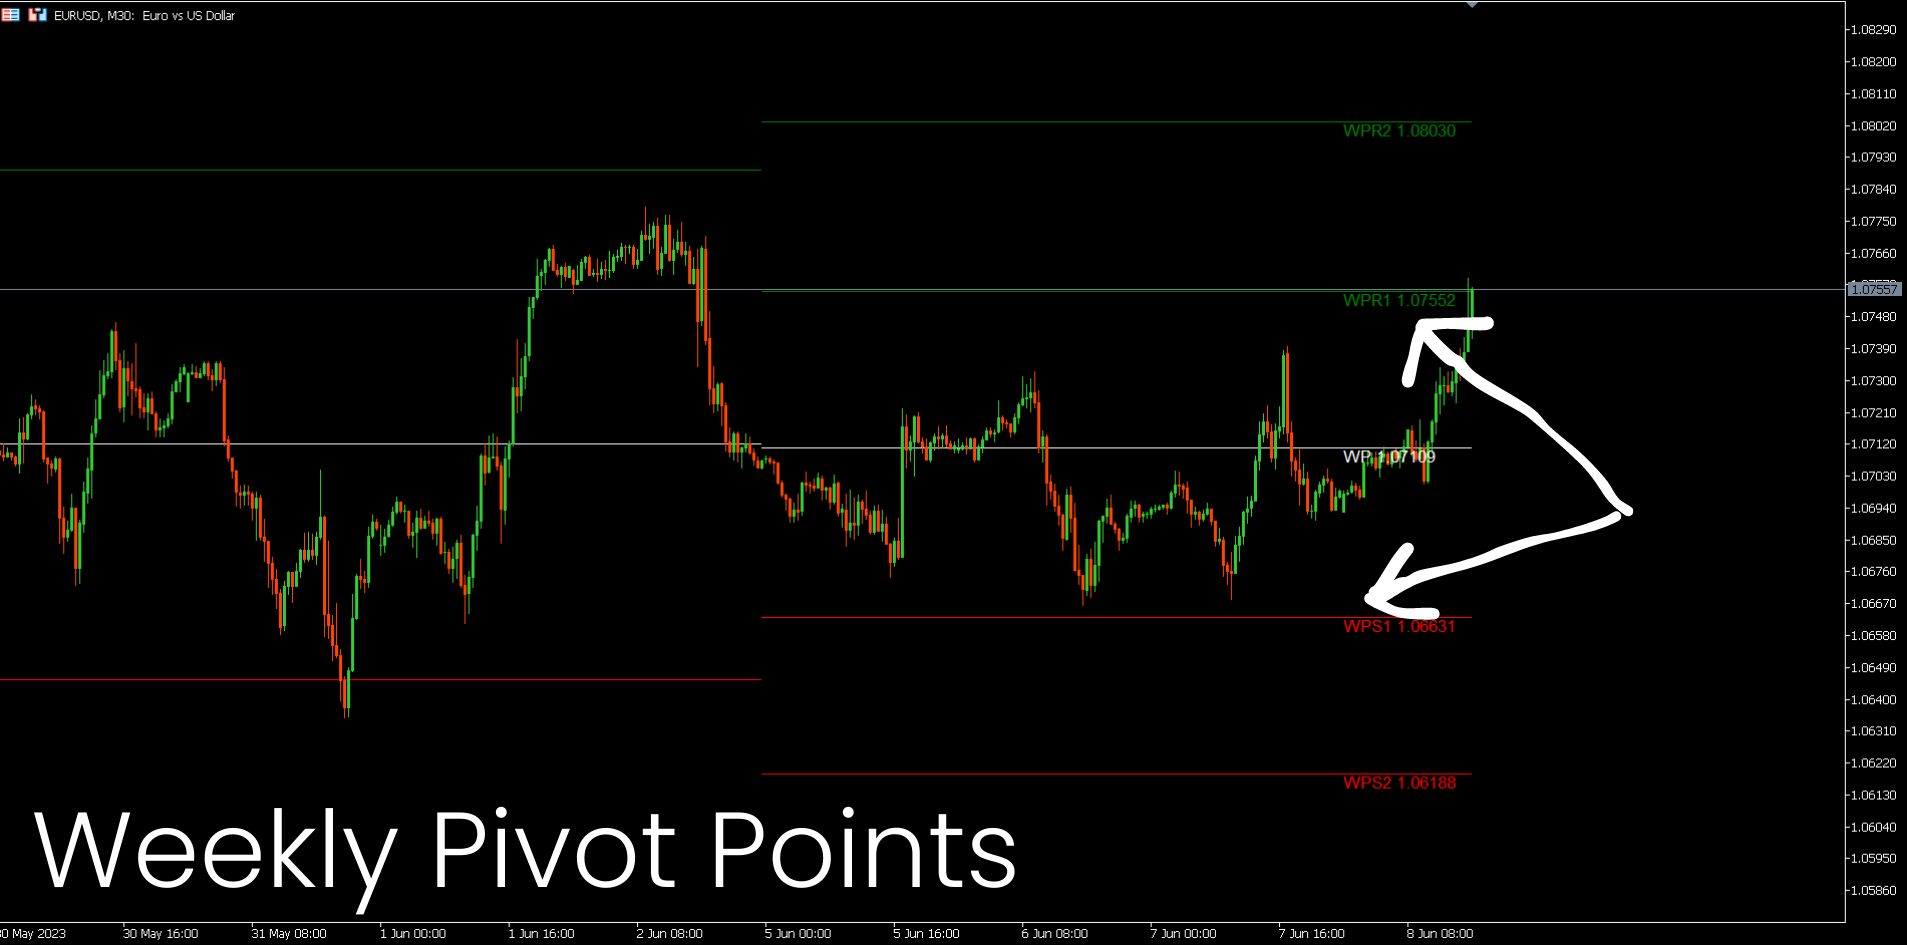
5. 주간 피벗 포인트
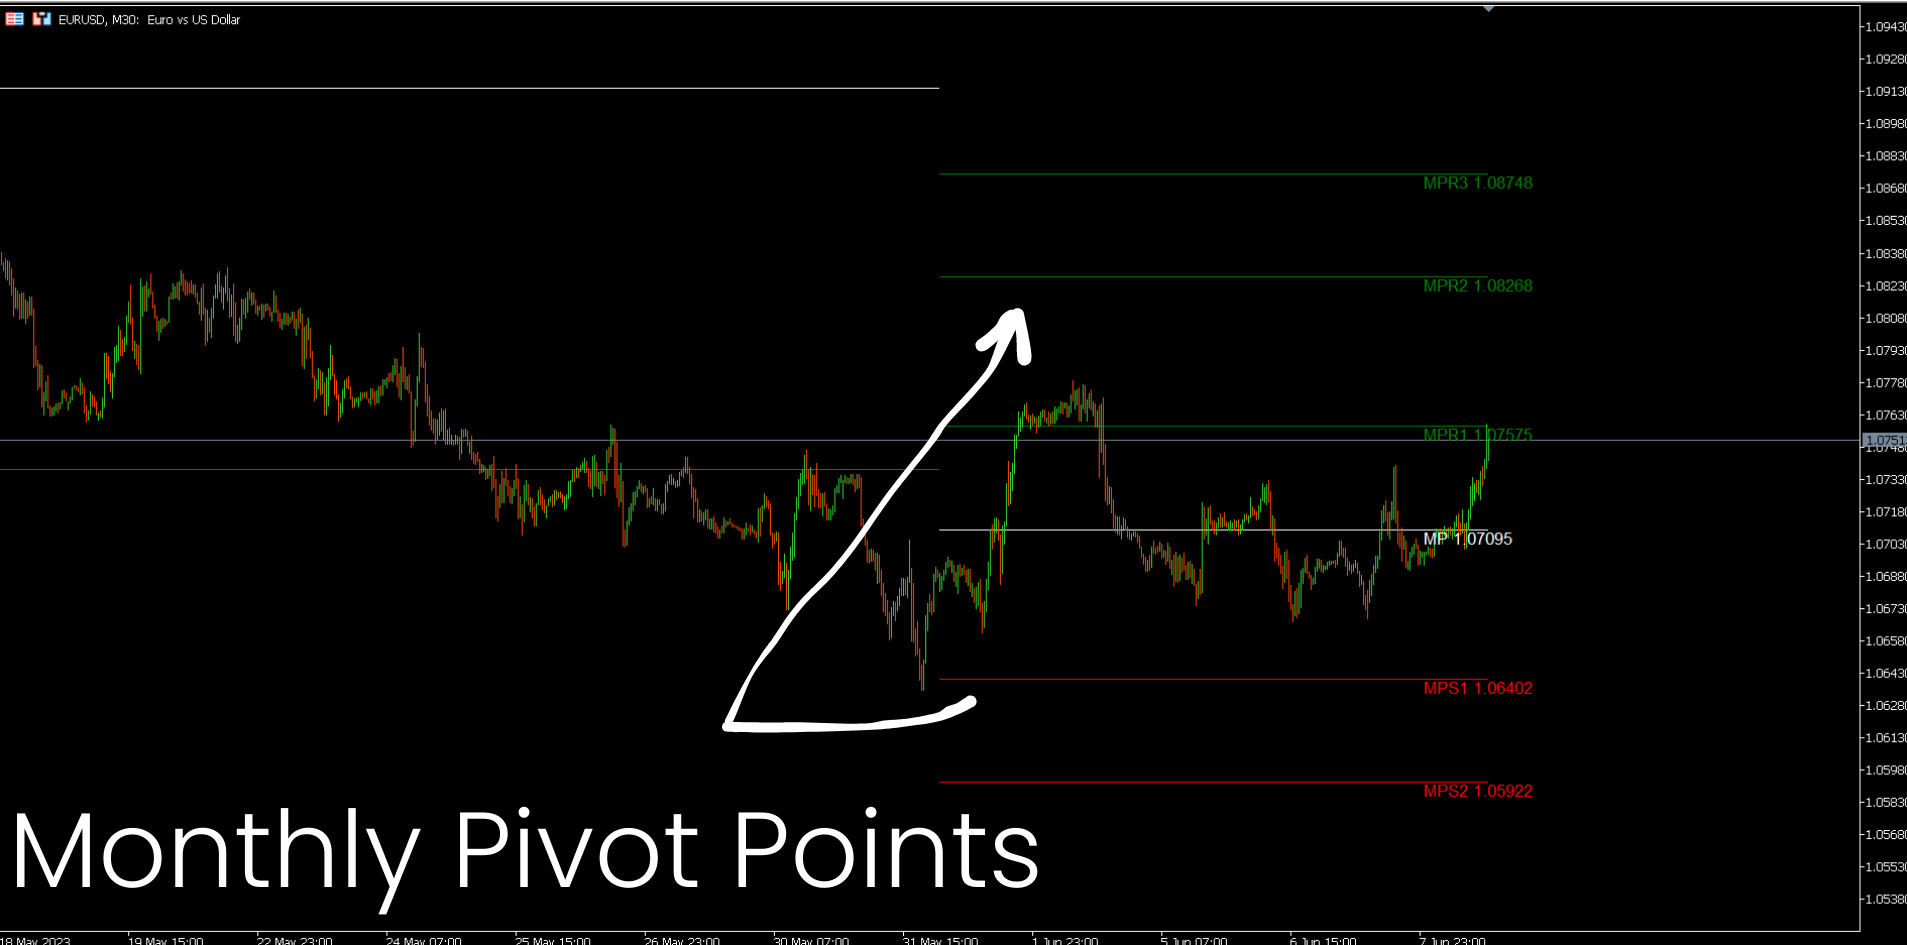
6. 월간 피벗 포인트
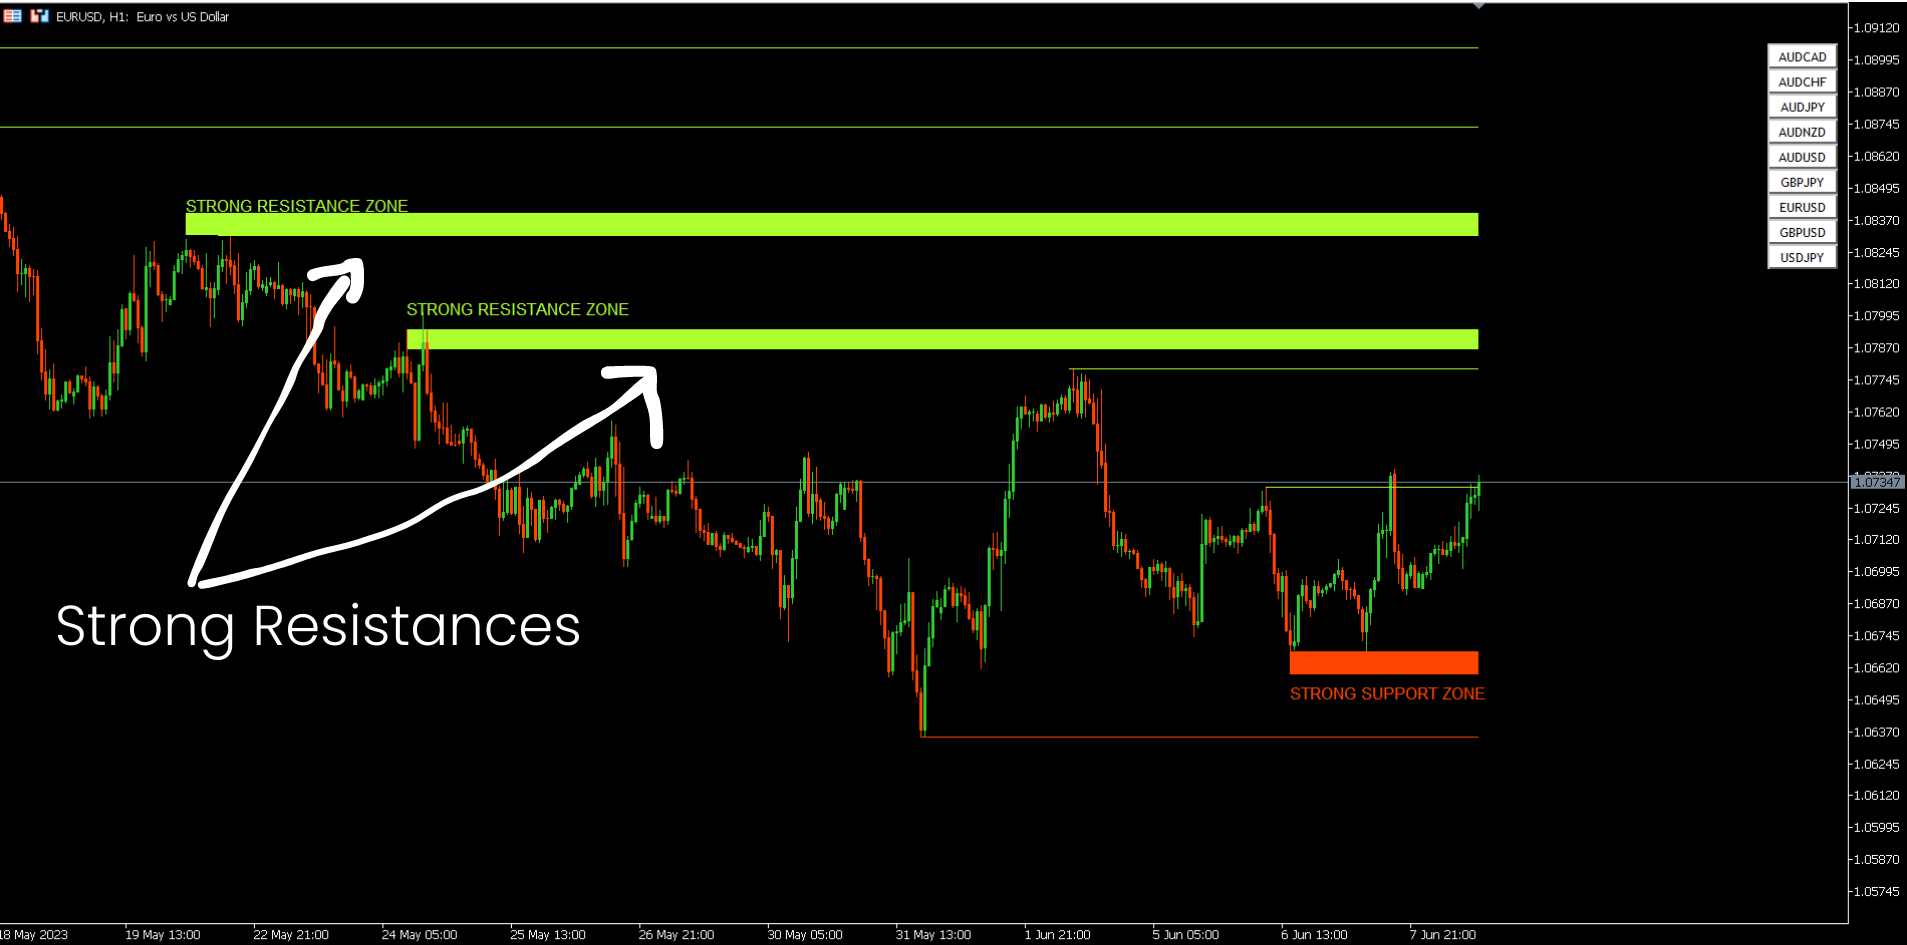
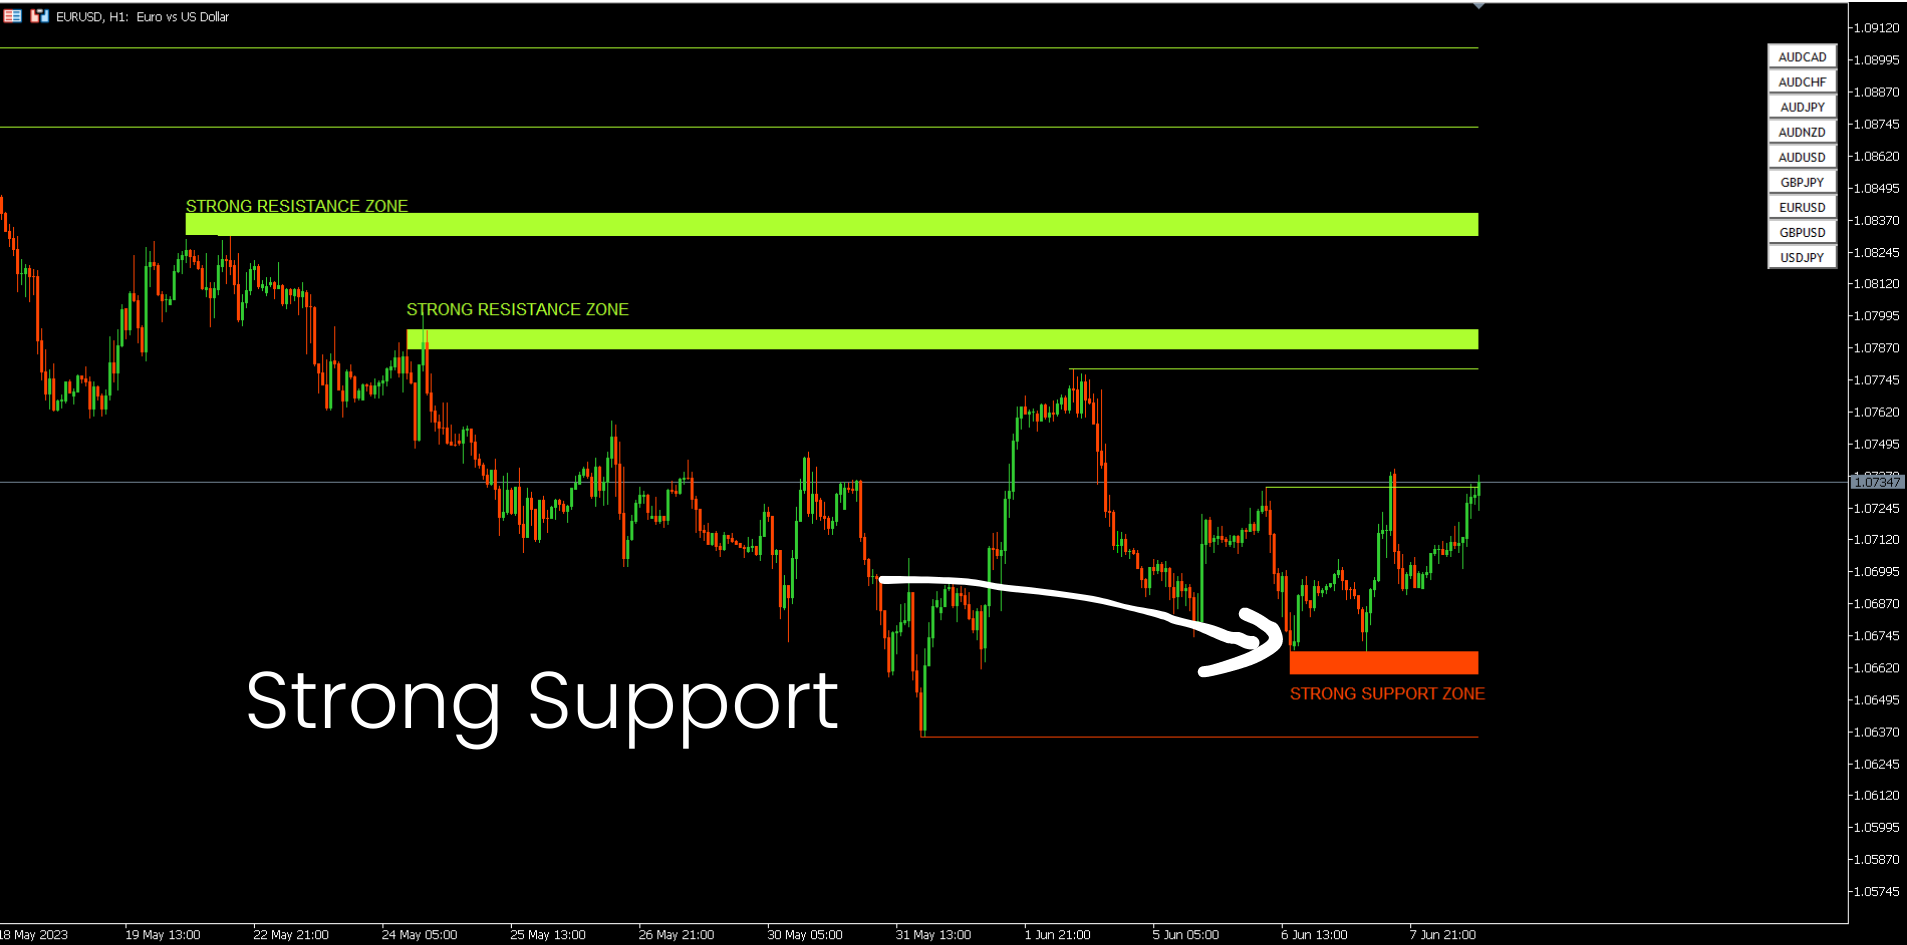
7. 고조파 패턴과 볼륨에 기반한 강력한 지지와 저항.
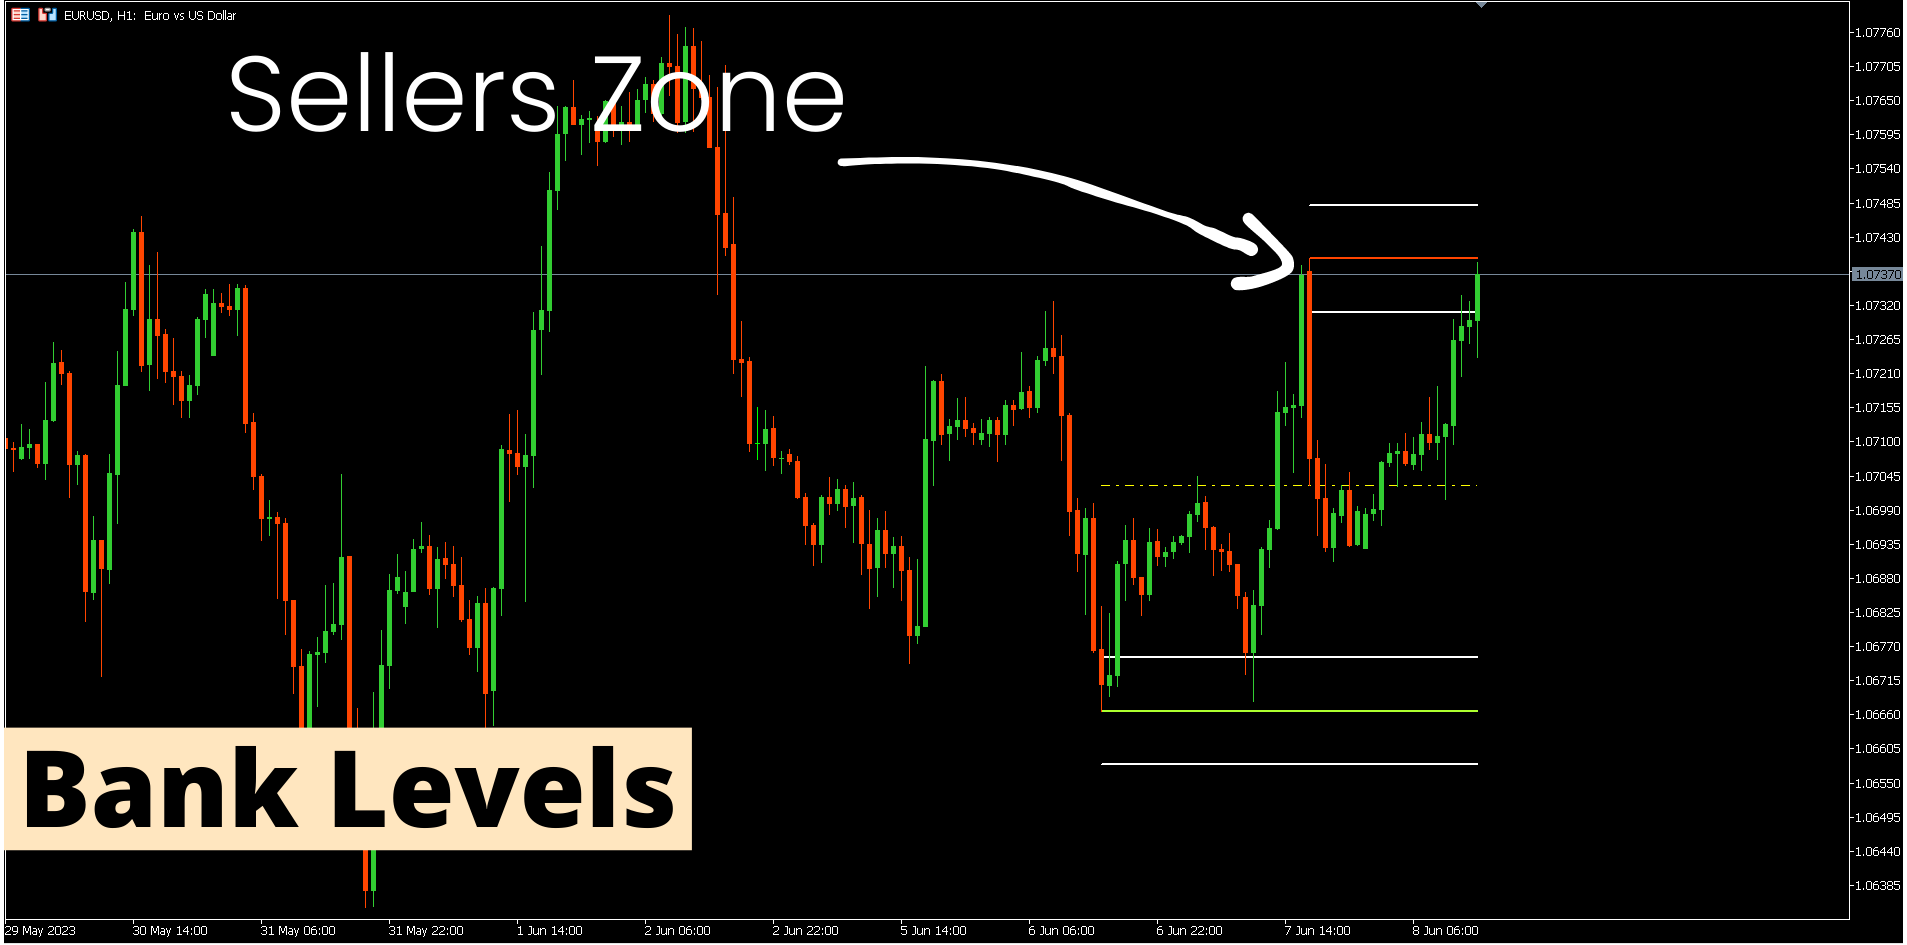
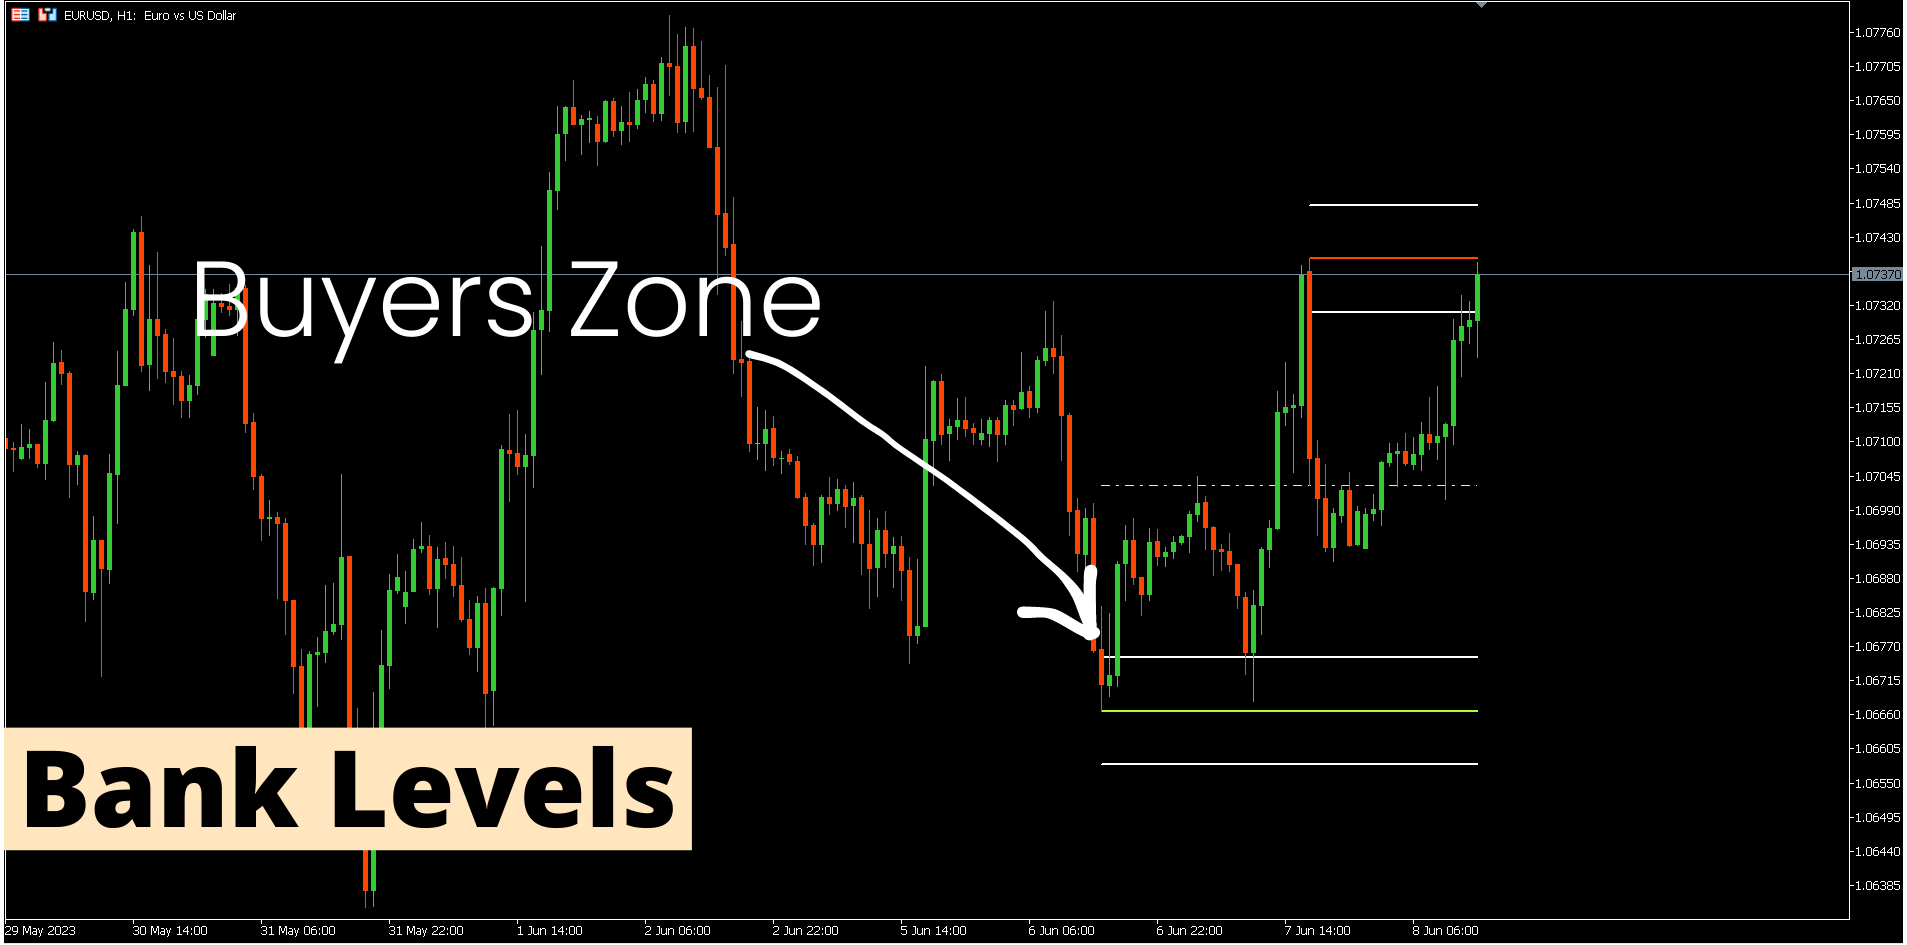
8. 은행 수준 구역.
LIMITED TIME OFFER : HV 지원 및 저항 표시기는 50 $ 및 평생 동안만 사용할 수 있습니다. ( 원래 가격 125$ )
MQL5 블로그에 액세스하면 분석 예제와 함께 모든 프리미엄 지표를 찾을 수 있습니다. 여기를 클릭하십시오.
주요 특징들
- 고조파 및 볼륨 알고리즘을 기반으로 하는 강력한 지원 및 저항 영역.
- Harmonic 및 Volume 알고리즘을 기반으로 한 강세 및 약세 풀백 영역.
- 시장 구조 스크리너
- 일간, 주간 및 월간 피벗 포인트.
실제 거래의 예
여기에서 지원 및 저항 지표의 실제 거래 예를 볼 수 있습니다. 여기를 클릭하십시오.
연락하다
질문이 있거나 도움이 필요하면 비공개 메시지를 통해 저에게 연락하십시오.
작가
SAYADI ACHREF, 핀테크 소프트웨어 엔지니어이자 Finansya의 설립자 


The Best Support and Resistance Indicator on the Market This indicator clearly outperforms every other support and resistance tool I have used in MetaTrader. Support and Resistance Screener Pro MT5 delivers highly accurate and meaningful levels, institutional zones, pivots, structures, and key points that would normally take a lot of time to analyze manually. What I like the most: - Very precise detection of real market zones. - Multi-timeframe and multi-symbol scanning. - Clean and organized visual presentation without noise. - Helps me take faster and better trading decisions. After using it, my market analysis improved immediately. It is a professional and reliable tool with no repainting. I fully recommend it 100%.