Support and Resistance Screener Pro MT5
- Indicateurs
-
STE S.S.COMPANY
 Hello,
my name is Ashraf a fintech Software Engineer.
I create amazing forex indicators and expert advisors for Metatrader 4 and Metatrader 5, the best trading platforms.
Use my service and let me build your trading strategies ( Indicator coding or EA coding ) by click on bellow link - Version: 13.20
- Mise à jour: 13 décembre 2023
- Activations: 10
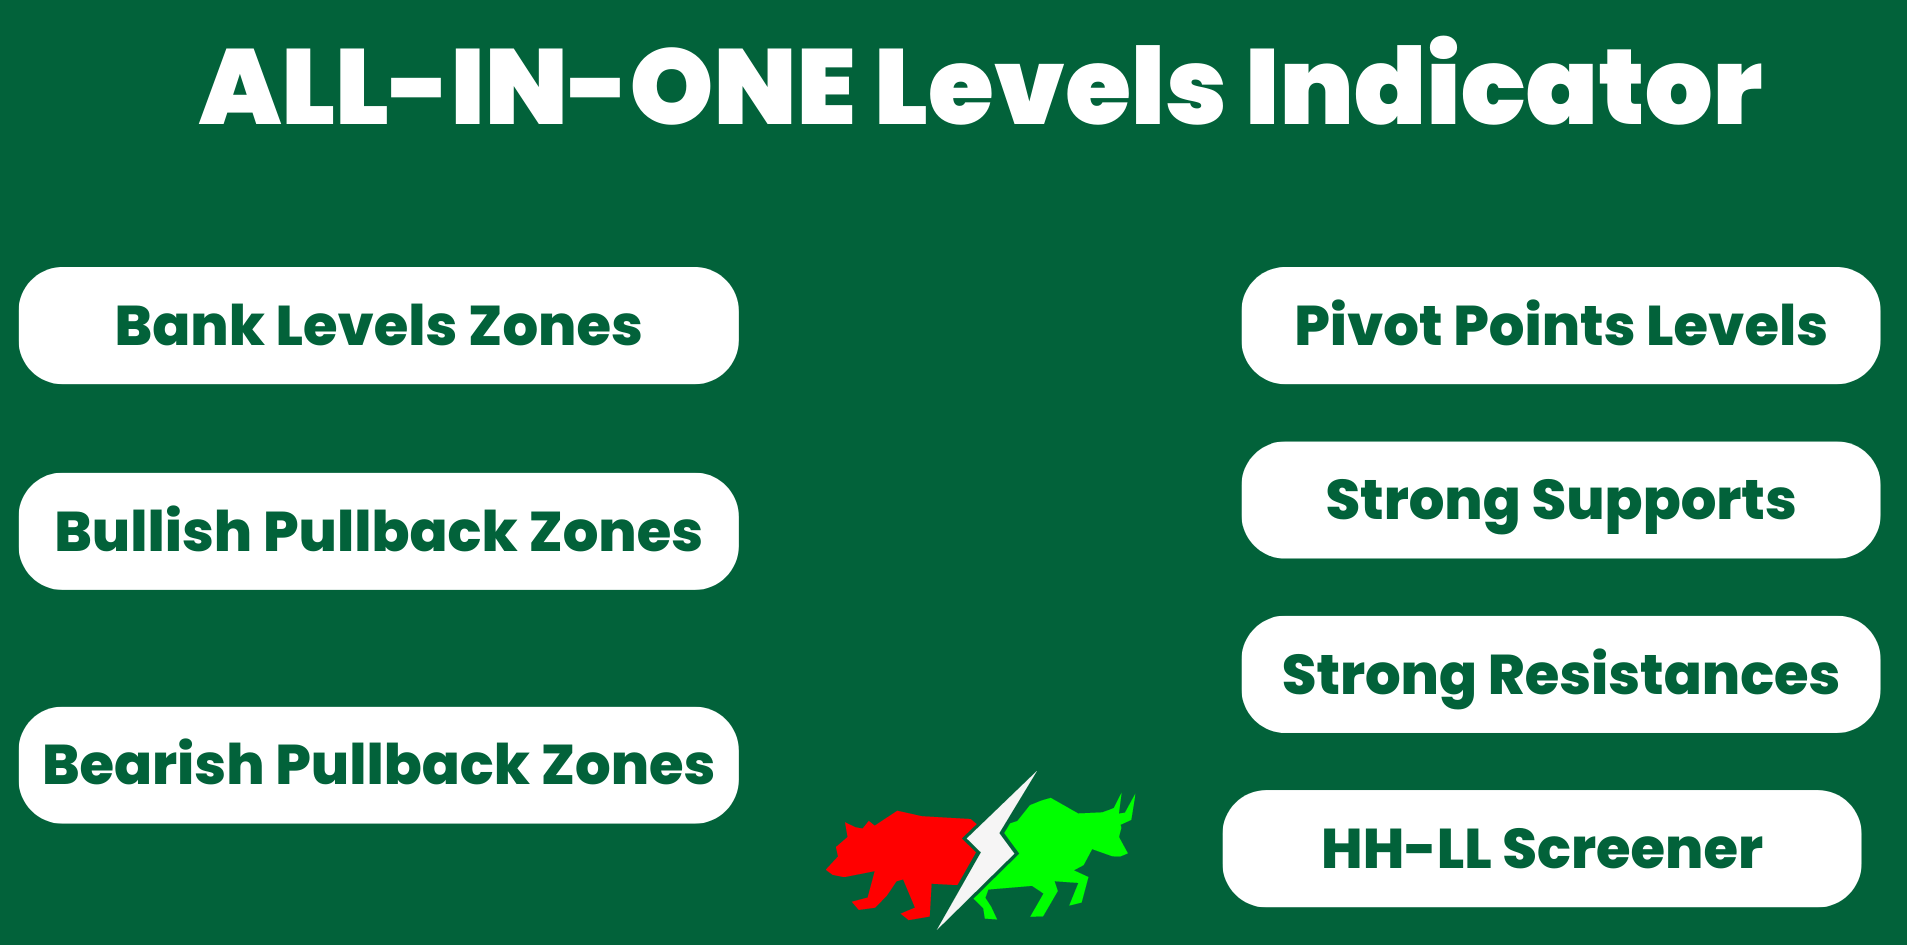
Support And Resistance Screener est dans un indicateur de niveau pour MetaTrader qui fournit plusieurs outils à l'intérieur d'un indicateur. Les outils disponibles sont :
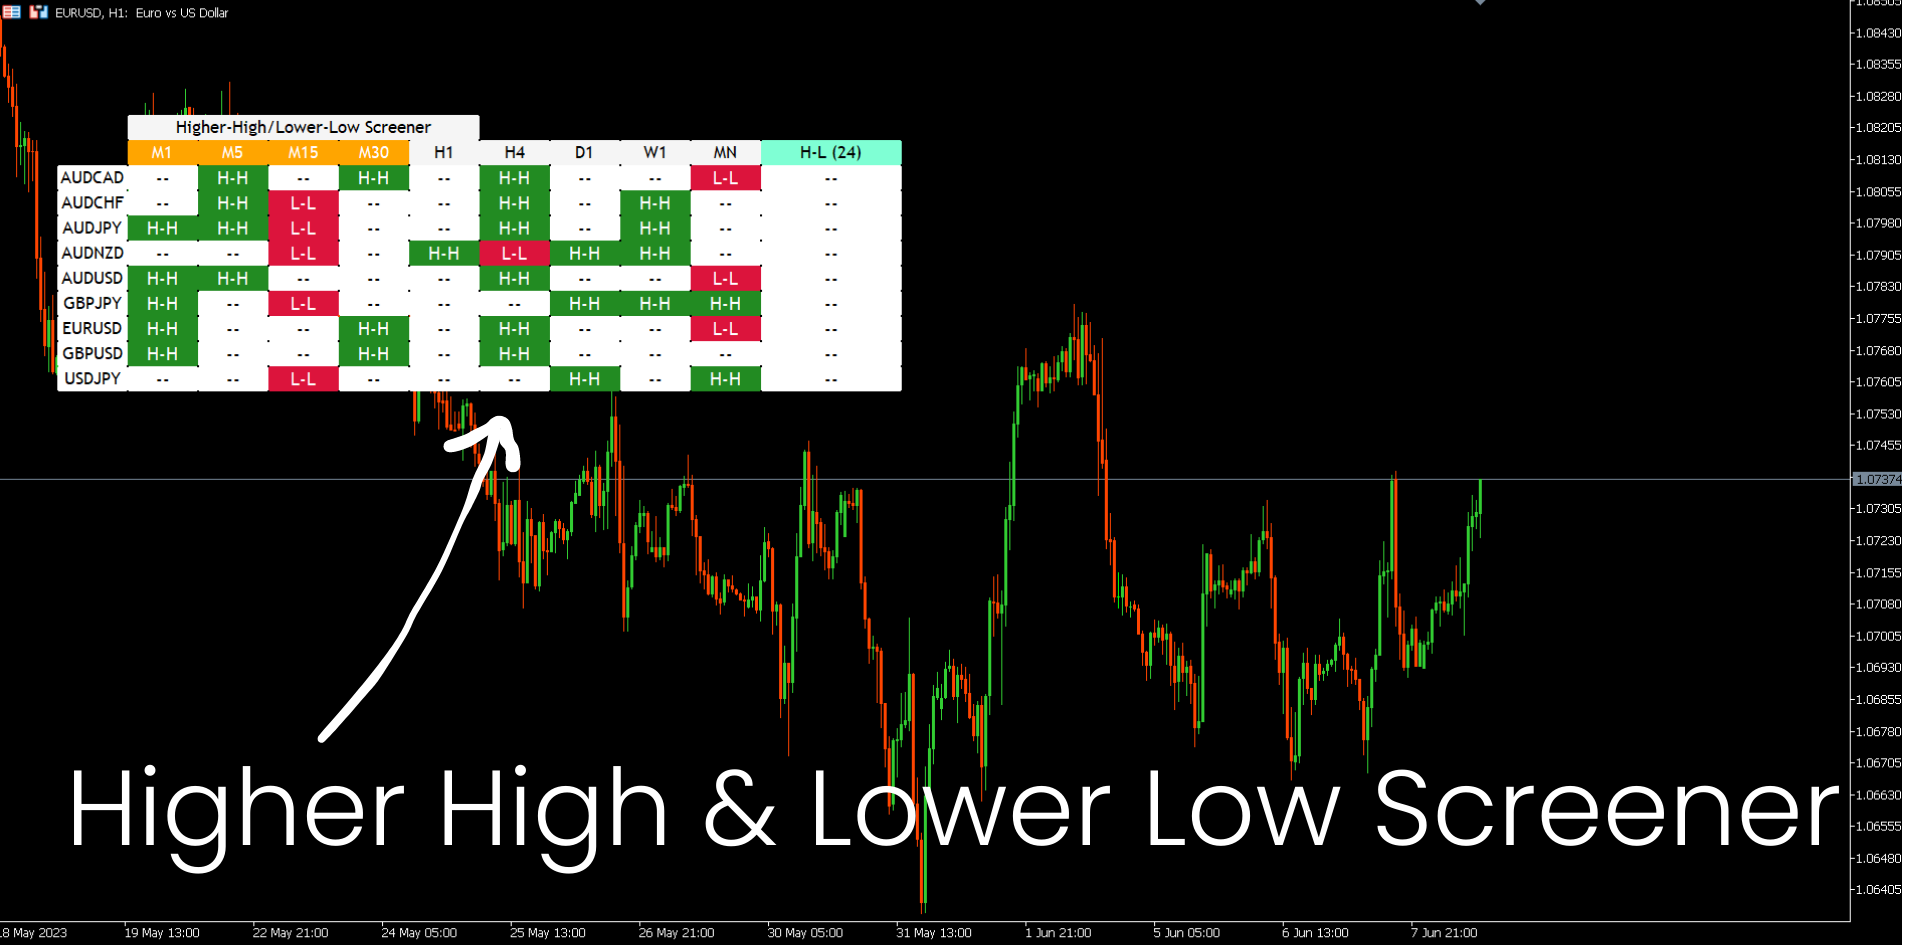
1. Filtre de structure de marché.
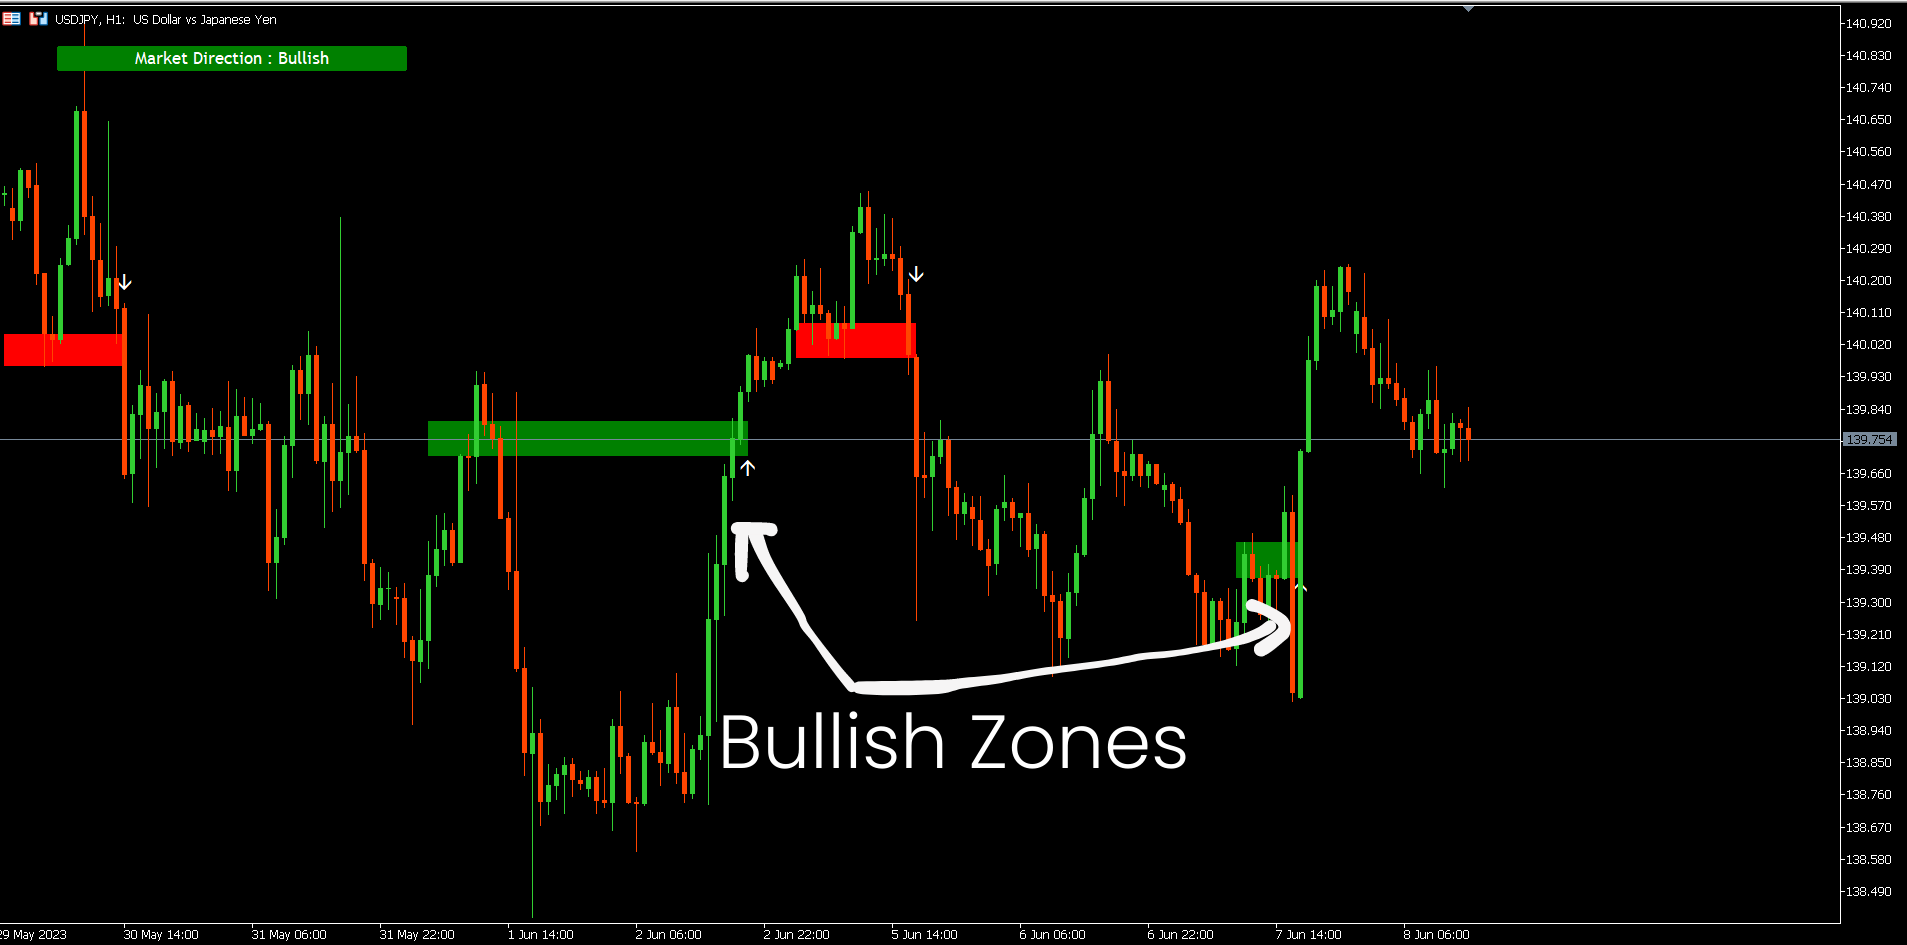
2. Zone de repli haussier.
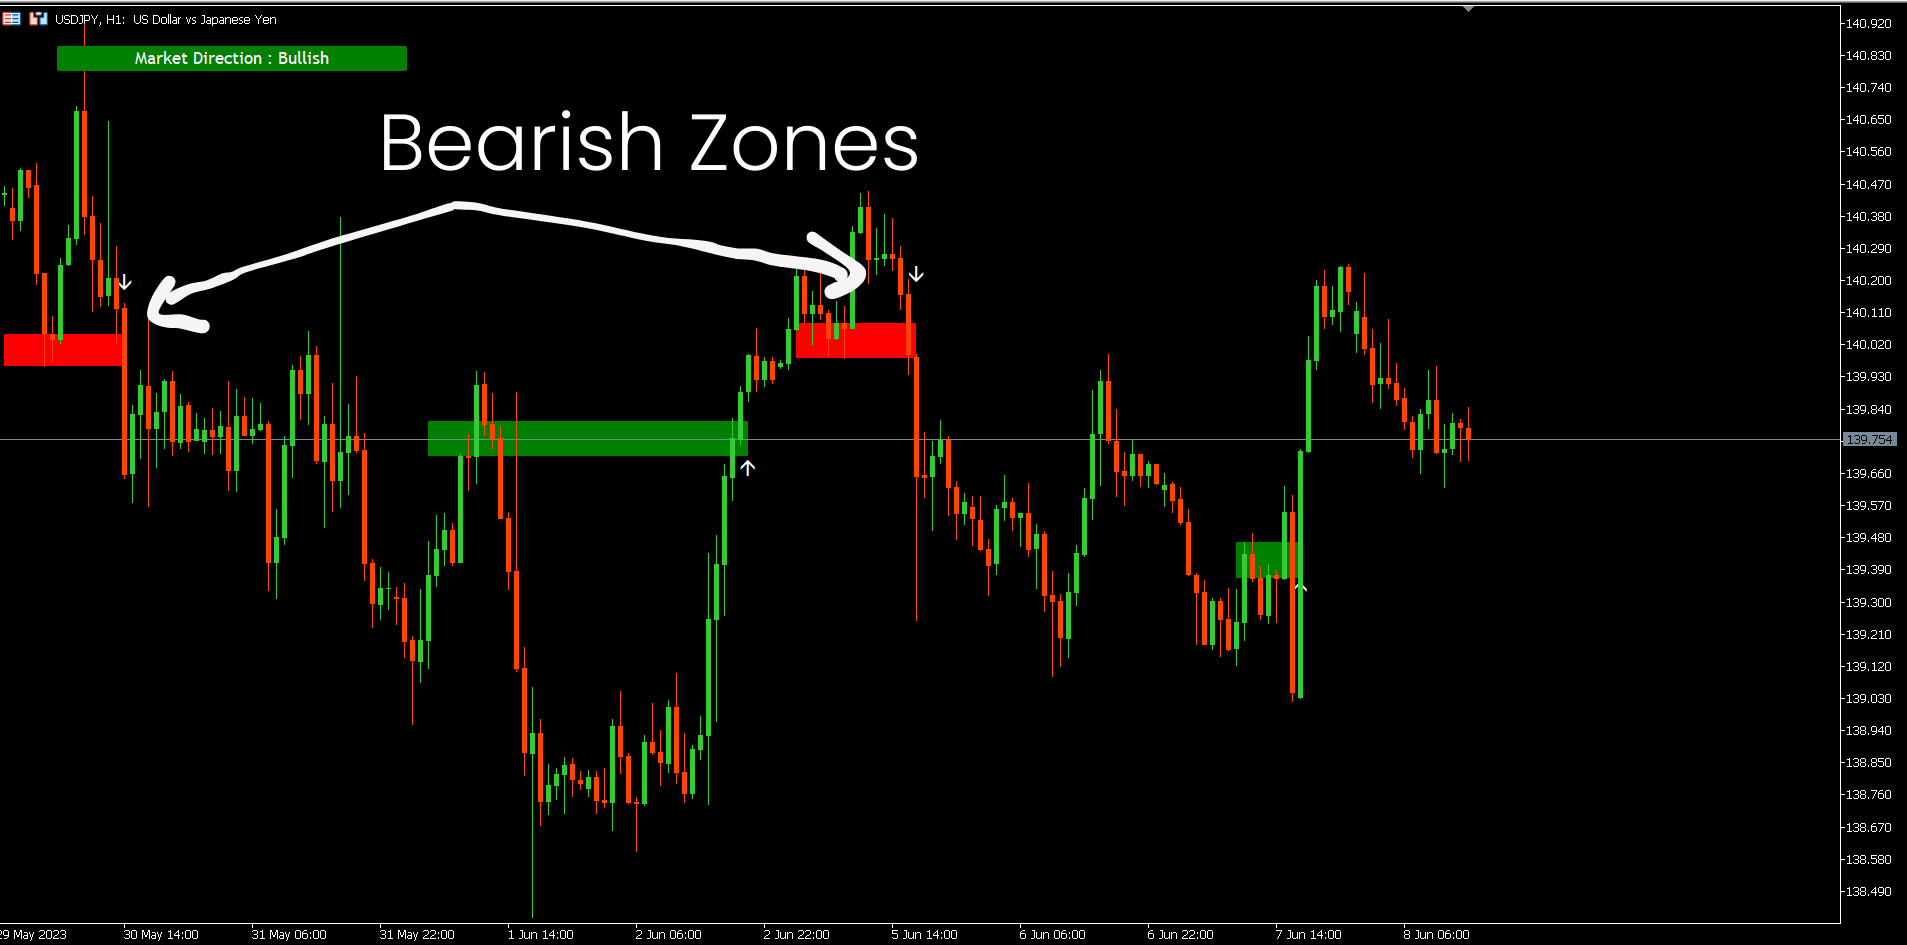
3. Zone de recul baissier.
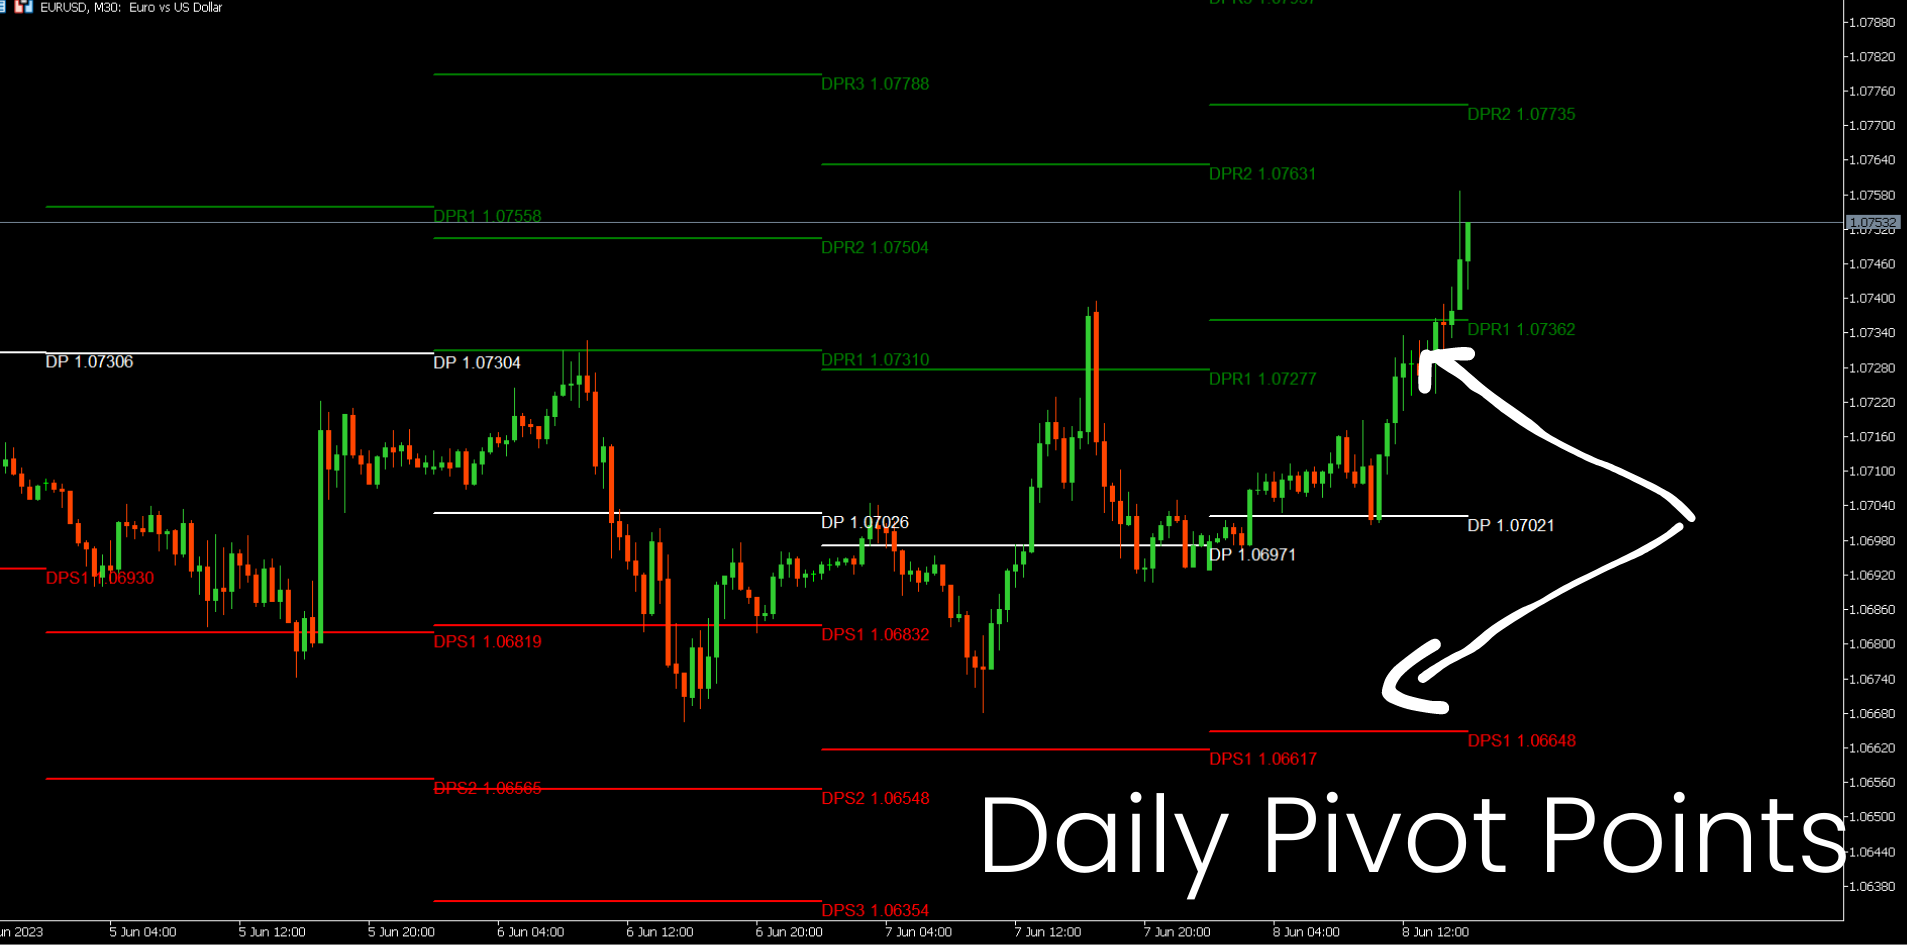
4. Points pivots quotidiens
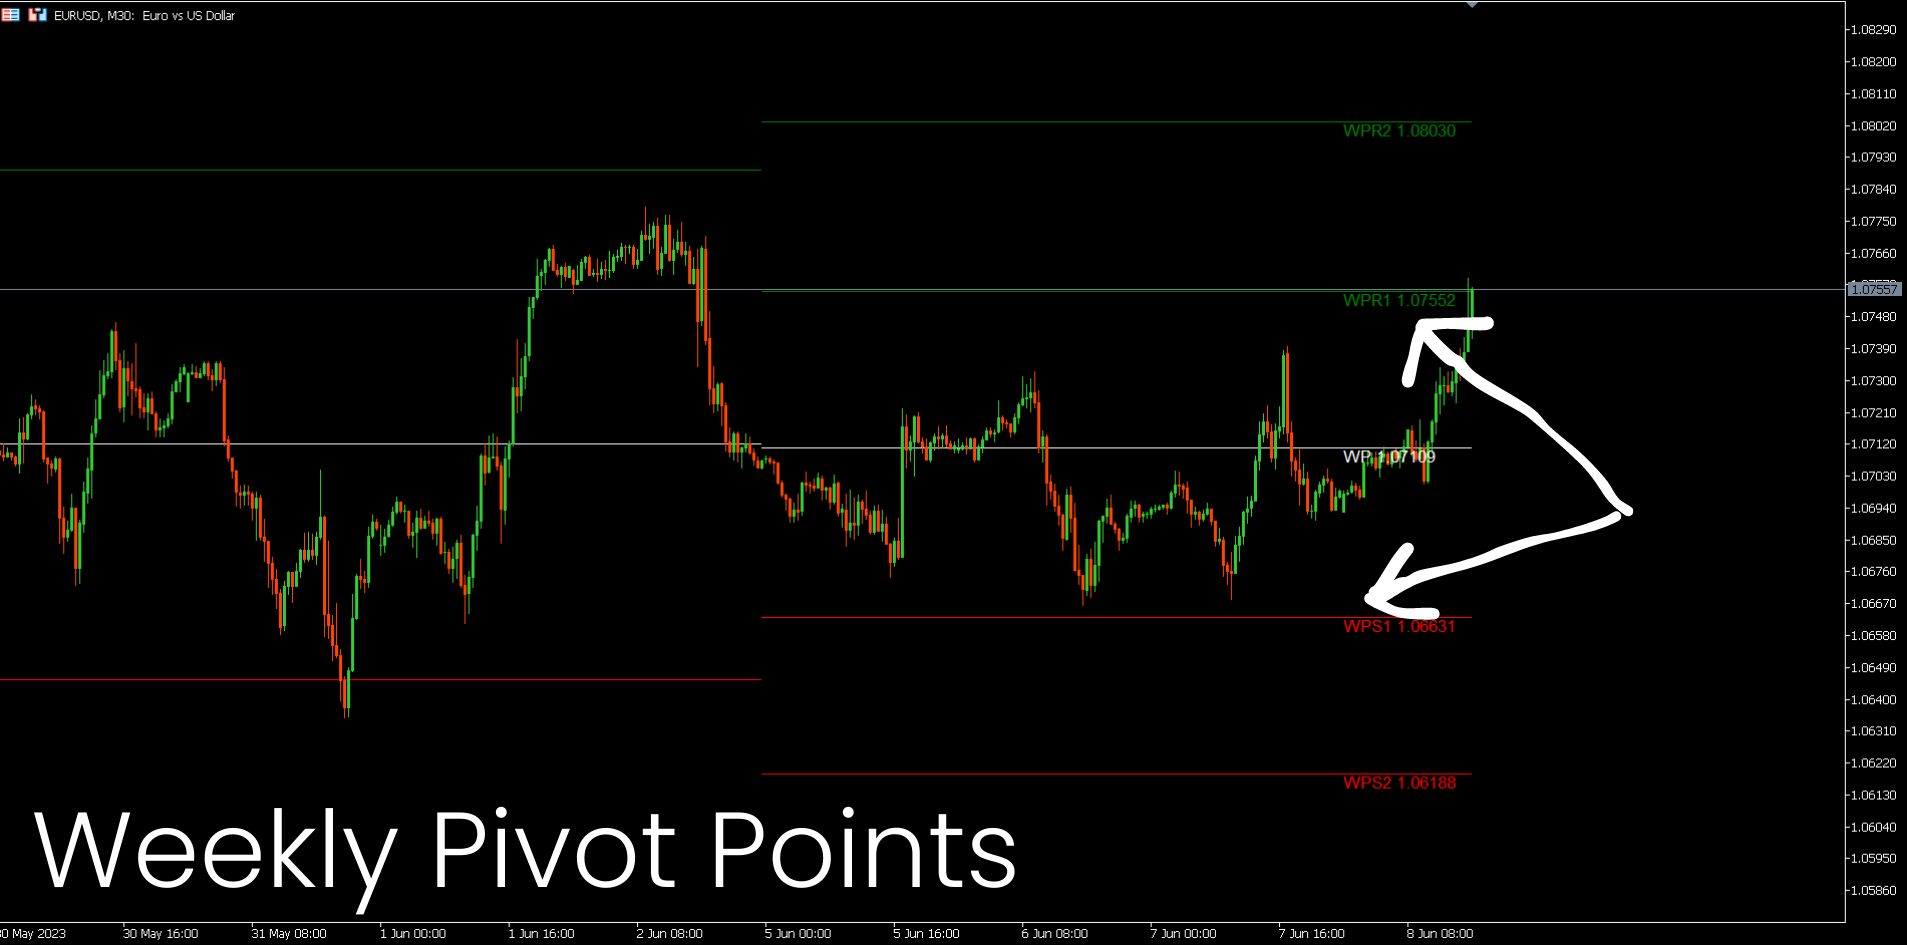
5. points pivots hebdomadaires
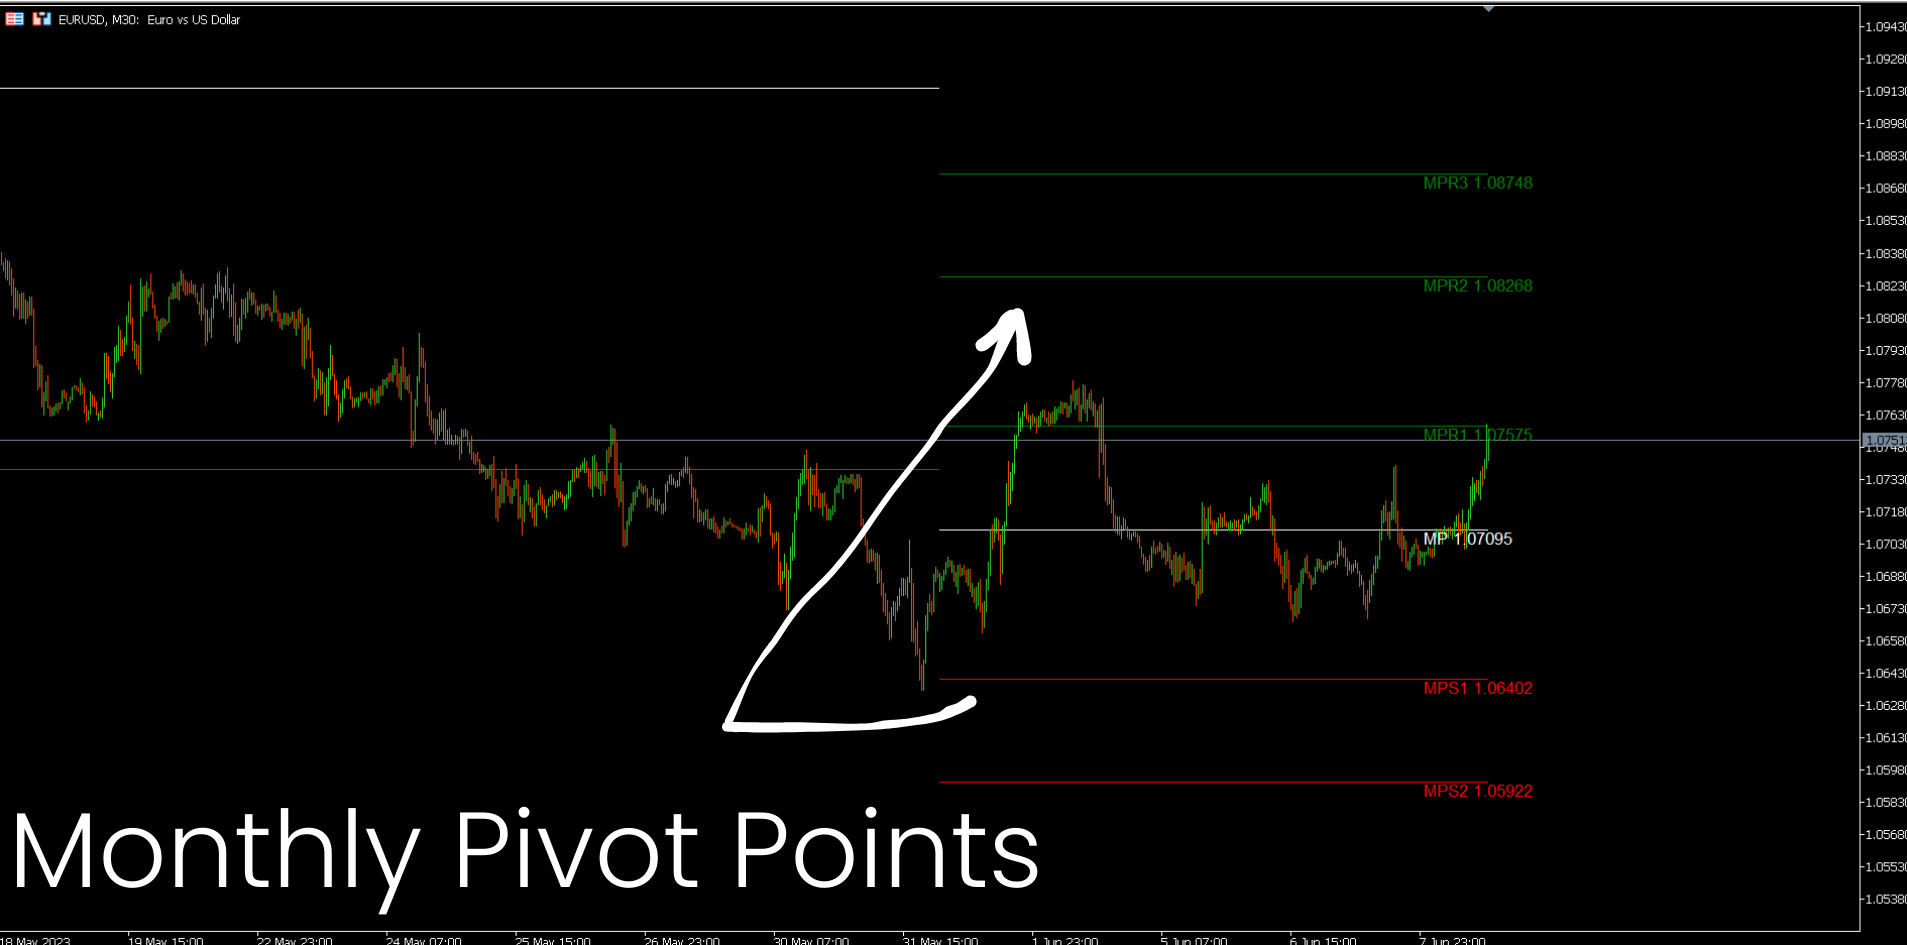
6. Points pivots mensuels
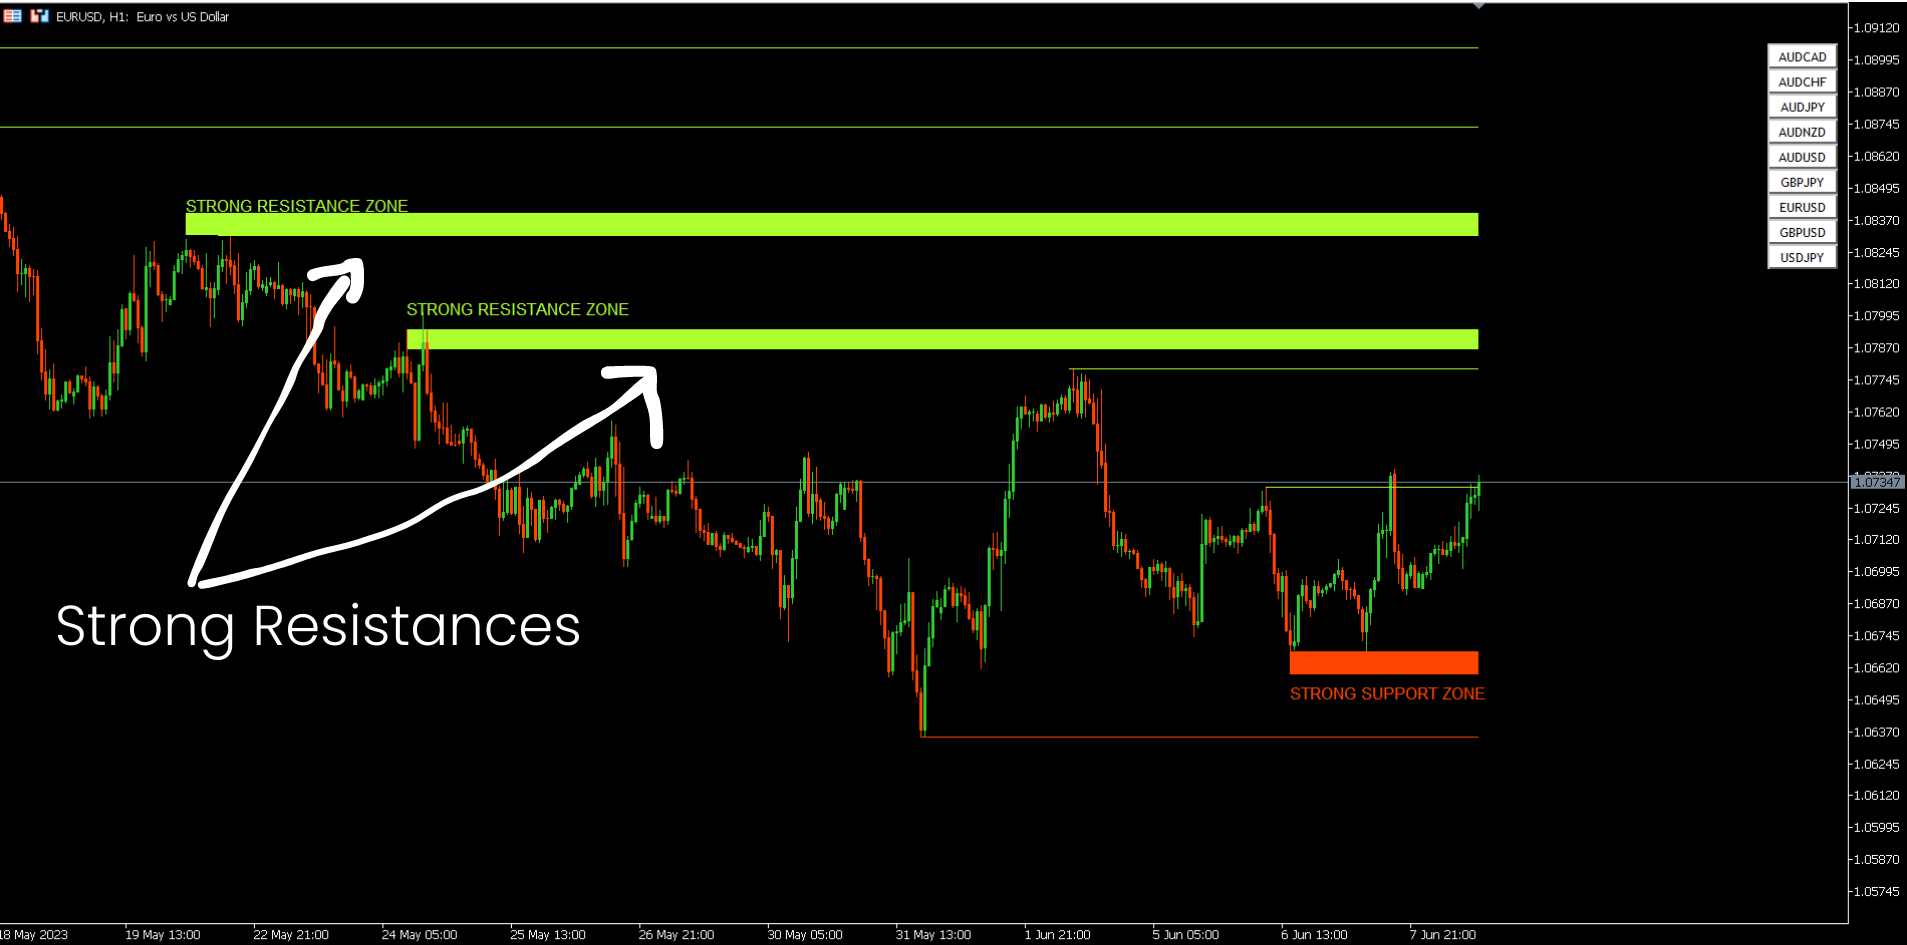
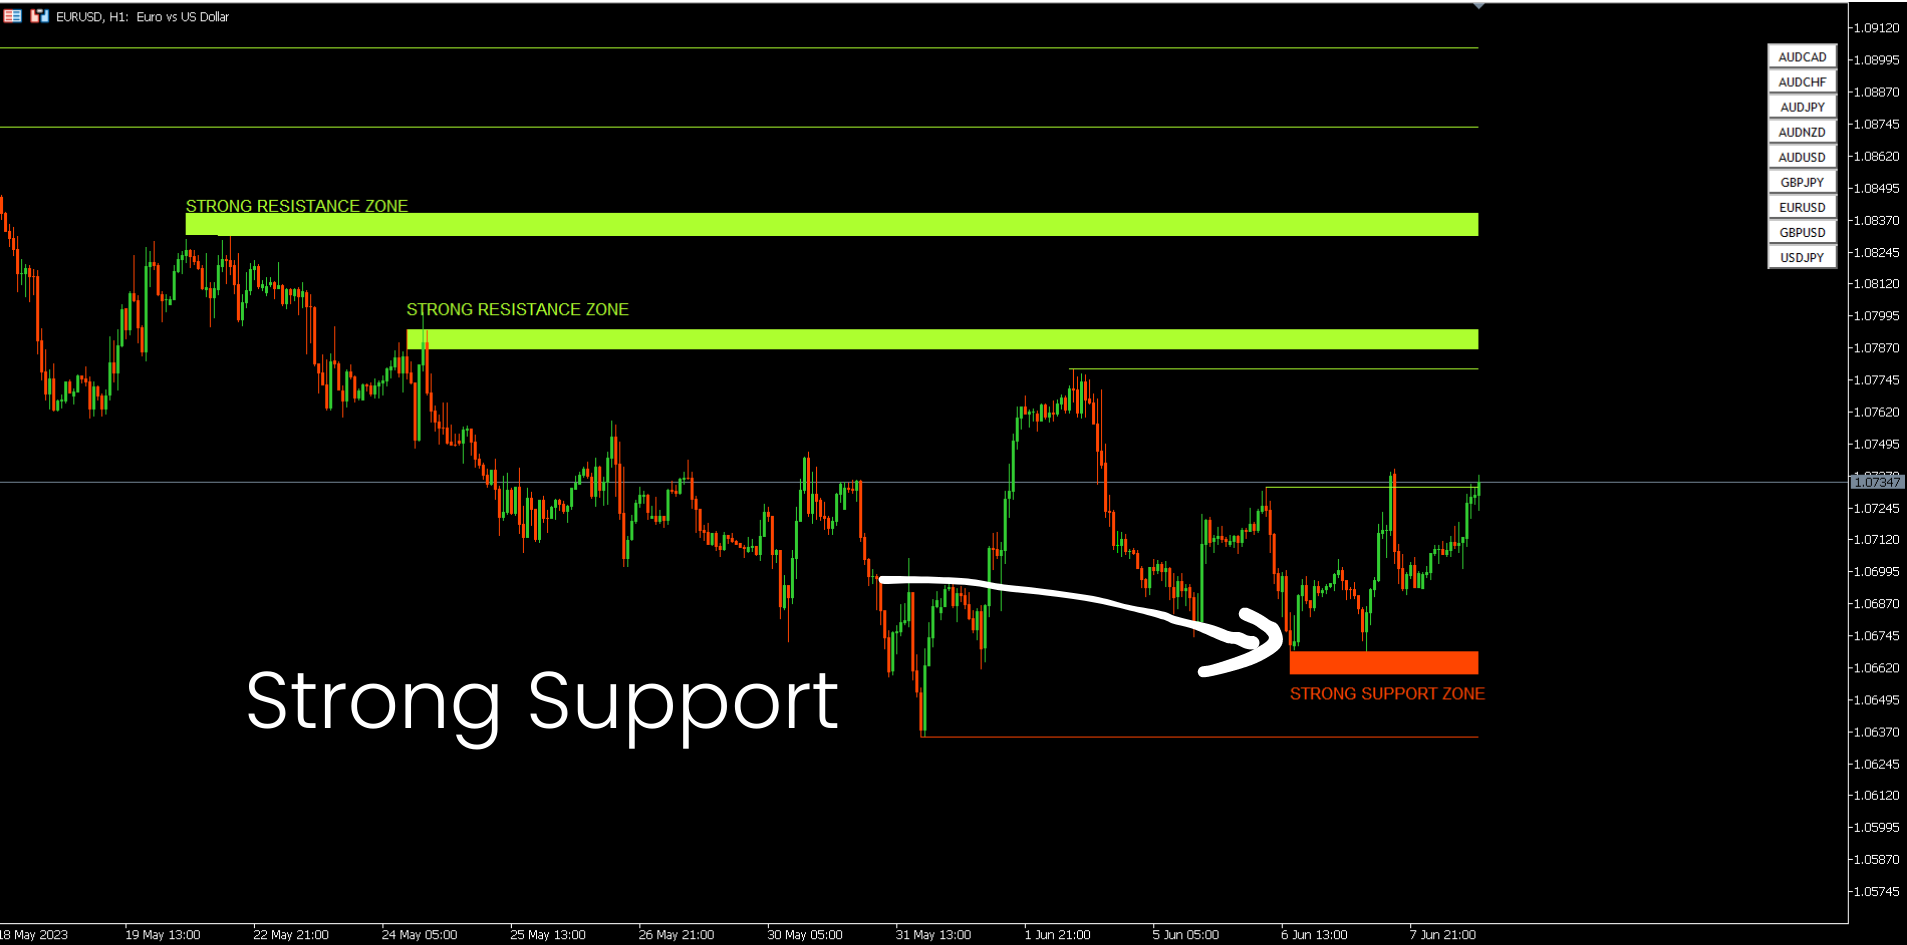
7. Support et résistance forts basés sur le modèle harmonique et le volume.
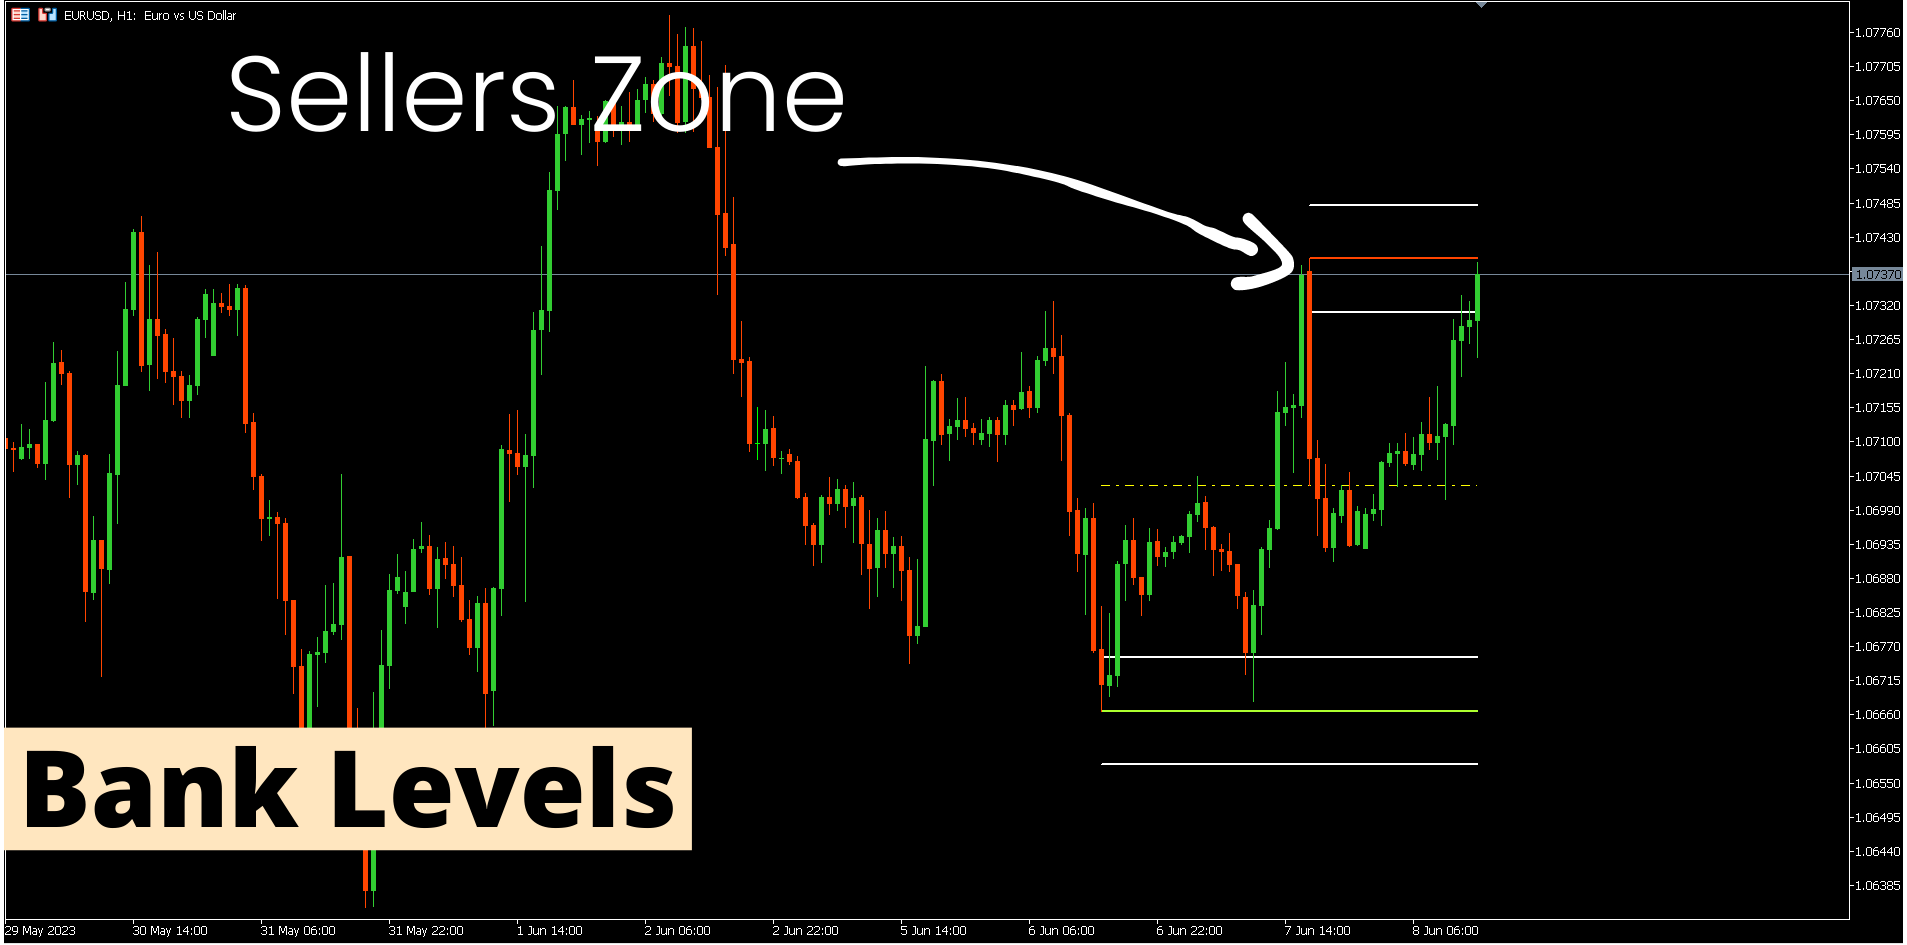
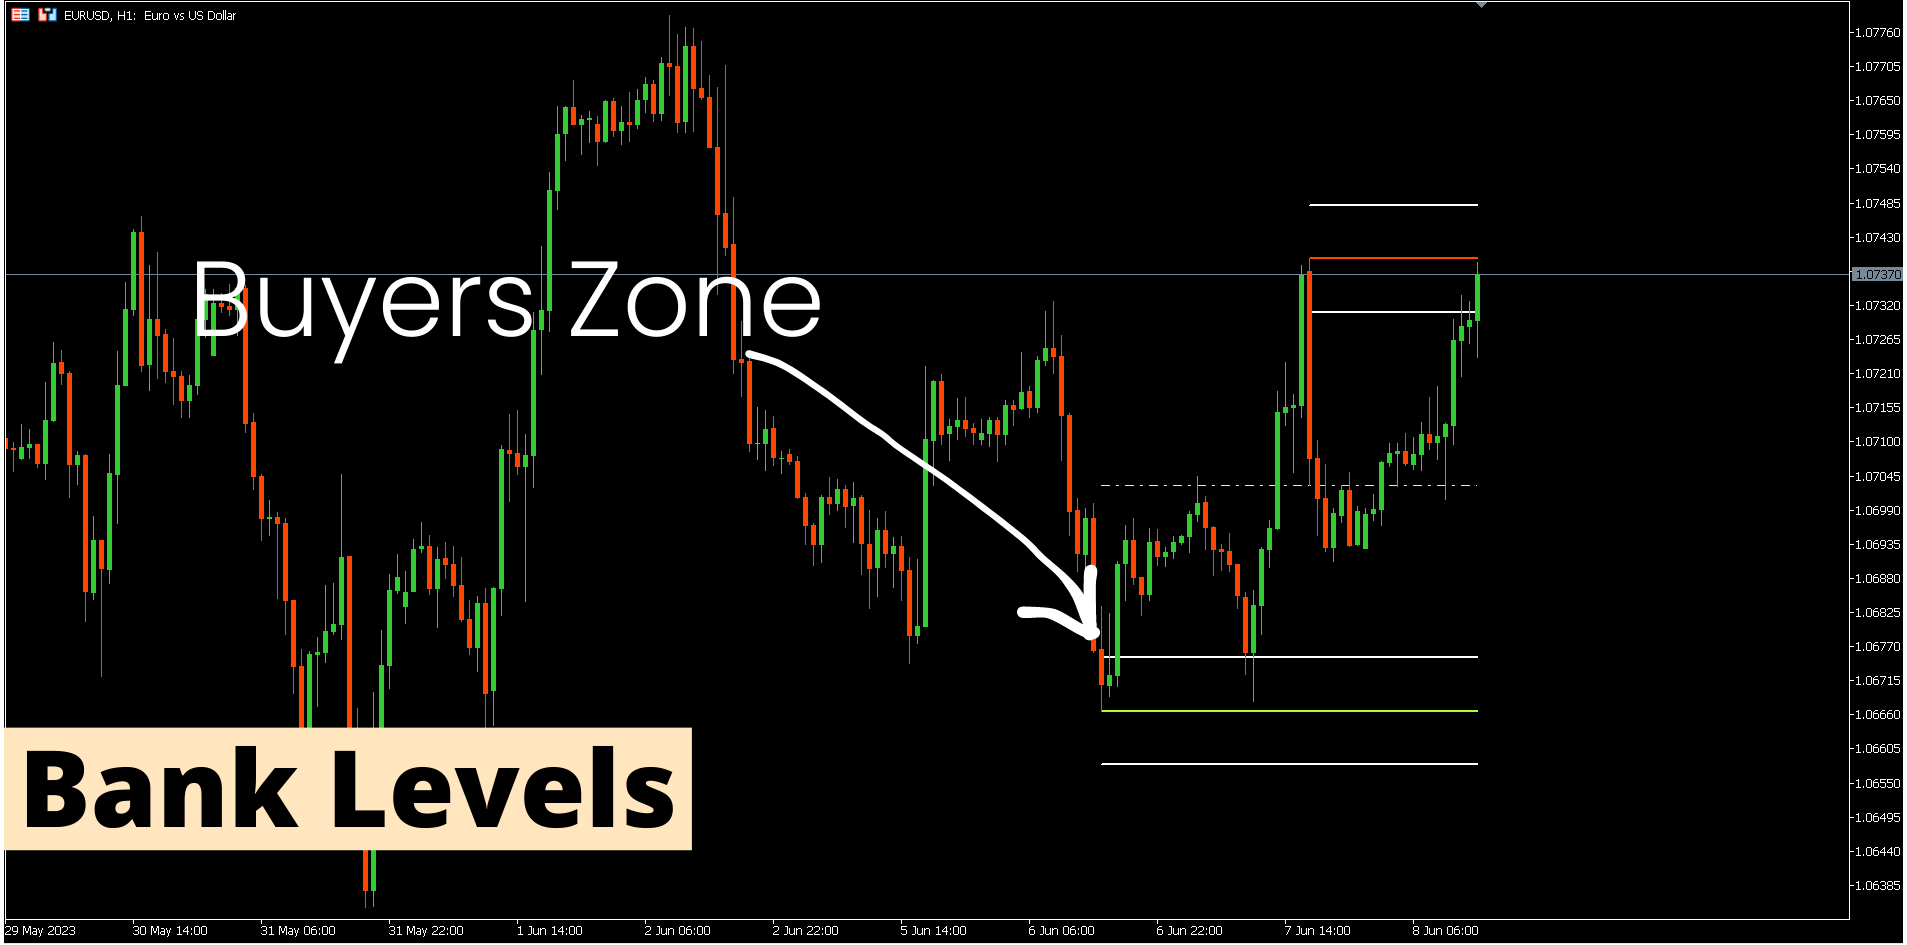
8. Zones au niveau de la banque.
OFFRE D'UNE DURÉE LIMITÉE : L'indicateur de support et de résistance HV est disponible pour seulement 50 $ et à vie. ( Prix d'origine 125$ )
En accédant à notre Blog MQL5, vous pouvez retrouver tous nos indicateurs premium avec des exemples d'analyse : Cliquez Ici
Principales caractéristiques
- Zones de support et de résistance fortes basées sur les algorithmes d'harmonique et de volume.
- Zones de retraits haussiers et baissiers basées sur des algorithmes harmoniques et de volume.
- Analyseur de structure de marché
- Points Pivots quotidiens, hebdomadaires et mensuels.
Documentation
Toutes les documentations de Support et Resistance Screener ( Instructions ) et les détails de la stratégie sont disponibles dans cet article de notre Blog MQL5 : Cliquez ici. Contact
Si vous avez des questions ou si vous avez besoin d'aide, contactez-moi par Message Privé.
Auteur
SAYADI ACHREF , ingénieur logiciel fintech et fondateur de Finansya 


The Best Support and Resistance Indicator on the Market This indicator clearly outperforms every other support and resistance tool I have used in MetaTrader. Support and Resistance Screener Pro MT5 delivers highly accurate and meaningful levels, institutional zones, pivots, structures, and key points that would normally take a lot of time to analyze manually. What I like the most: - Very precise detection of real market zones. - Multi-timeframe and multi-symbol scanning. - Clean and organized visual presentation without noise. - Helps me take faster and better trading decisions. After using it, my market analysis improved immediately. It is a professional and reliable tool with no repainting. I fully recommend it 100%.