Retracement Trend
- 指标
- 版本: 1.0
- 激活: 5
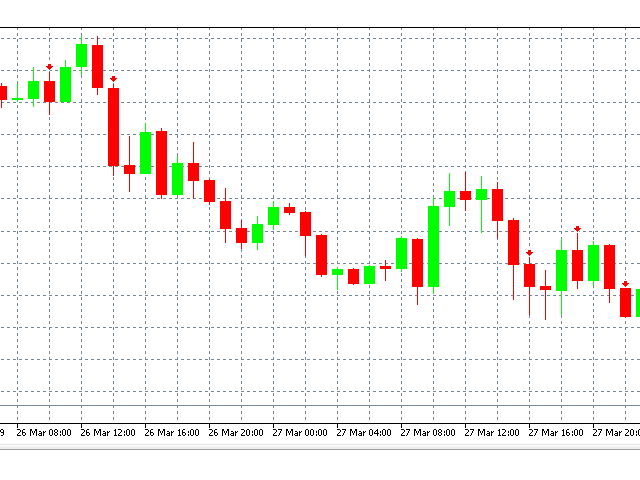
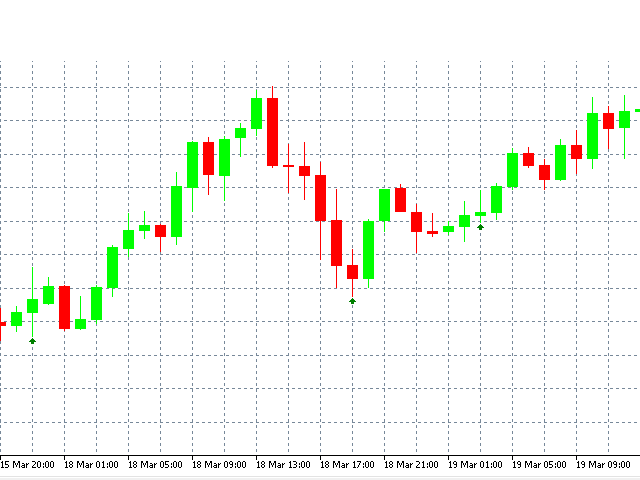
Retracement Trend is based on a priceaction logic and volume of the lasts bars.
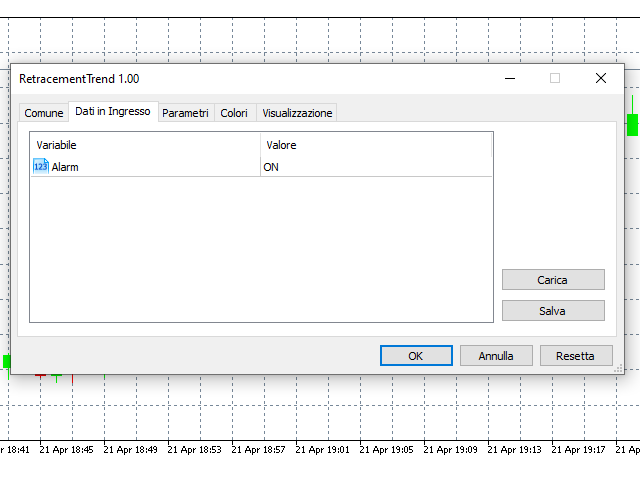
Inputs:
- Alarm ON/OFF: turn on or off alarm on screen.
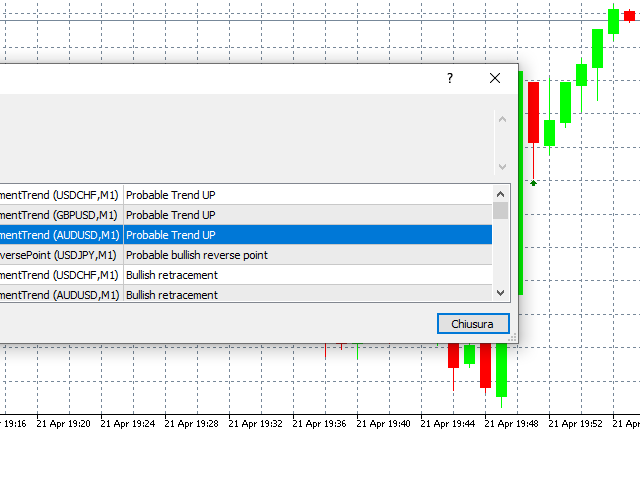
The indicator draws an arrow pointing the direction to follow based on when a specific pattern of bar's volume is found and the price has a specific direction.
Retracement Trend can help you to choose the moment to do your trades in a specific direction, strengthening your trading strategy.