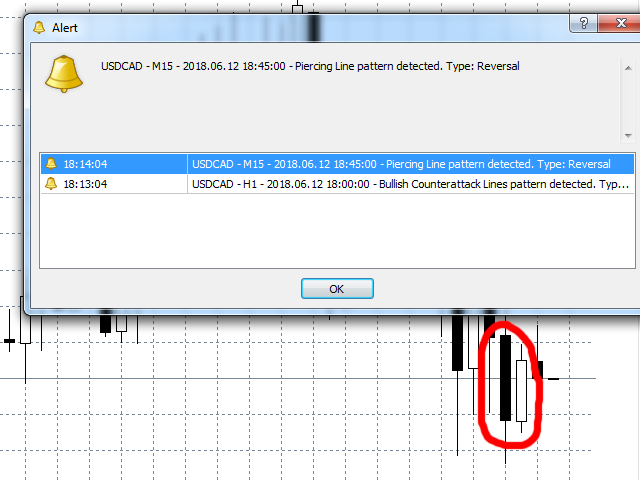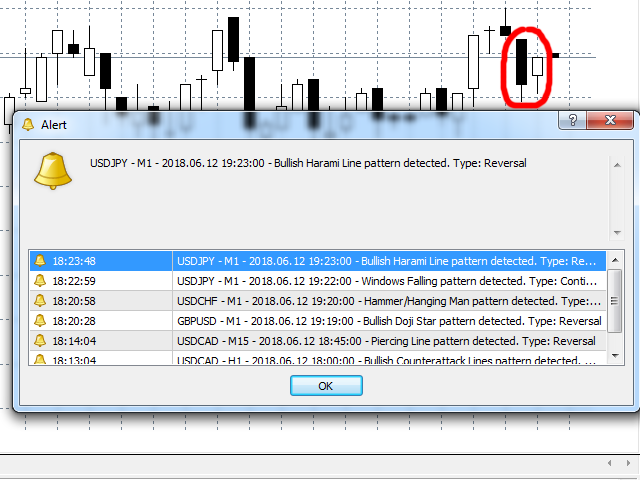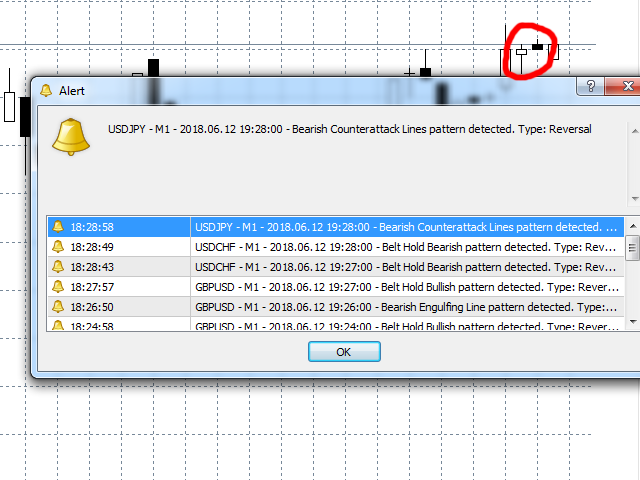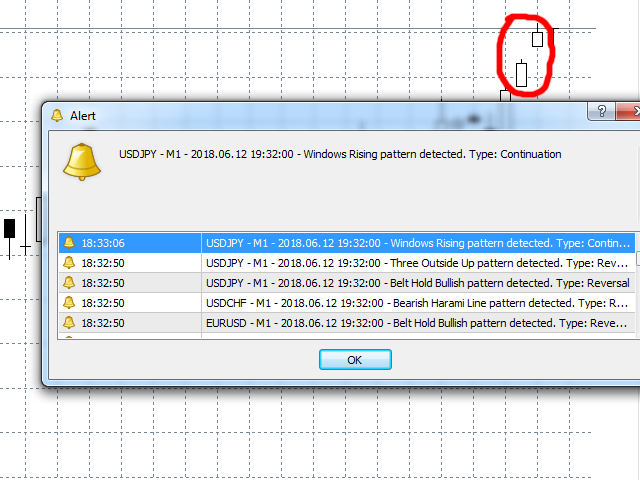
Pattern Finder 2

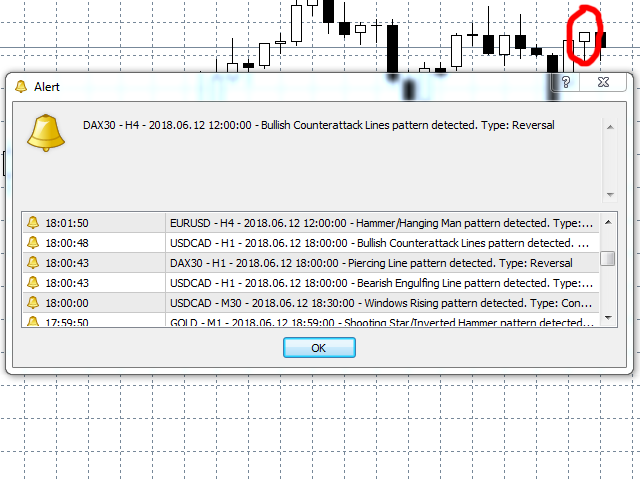
Pattern Finder 2 is a MULTICURRENCY indicator that scans the entire market seeking for up to 62 candlestick patterns in 15 different pairs/currencies all in one chart. It will help you to make the right decision in the right moment.

You can filter the scanning following the trend by a function based on exponential moving average.

You can setup parameters by an interface that appears by clicking the arrow that appear on the upperleft part of the window after you place the indicator.

Parameters are divided in panels:

Options:

Trend filter ON/OFF: verify the actual trend of your currencies and notify a pattern only if it is found in the right trend; for example Evening Star is a pattern that usually indicates an inversion of the trend from bullish to bearish so it will be notified only if the actual trend is bullish.

Trend period: trend is calculated on exponential moving average, this option is an integer type that will set the number of periods for calculation of the ema.

Trend n. bars: is an integer that indicates the count of the consecutive number of bars that has the same trend before an alert is sent. Sensivity: It's an integer number between [-5,5] that define the minumum and maximum lenght of candles characteristic for a pattern to be recognized. For patterns where is important the lenght of the body it define the minimum or maximum body dimension, for pattern where is important the the lenght of the shadows it define the minimum or maximum lenght of the shadows; higher is the number more sensitive is the pattern tracing (smaller body or shadows). Pattern with candles out of the range of sensivity will not be recognized.

Alert Pop Up: enables or disable screen alters.

Send email: enable or disable email alerts.

Push on mobile: enable or disable push notification on mobile.

Patterns: You'll find a list with inversion patterns and a list of continuation pattern; by clicking on the pattern name a window will appear with a graphic explanation of the pattern,the conditions necessary for the pattern to be found, the frequency and the efficiency of the pattern (based on my experience), and a button to turn it on/off. You can also enable or disable all the inversion or continuation pattern by the check near the name.

Currencies: here you can select up to 15 different currencies that are in your market. Click on one of the positions then from the list on the right click on the currenchy you want to assign. The indicator will scan the specified currencies.

Save: You can save the current settings for the next time you'll start pattern finder again.

Load: You can load previous saved settings.

Remember to click the apply button when you modify something otherwise changes will not be applied.

Here is a list of patterns implemented:

Inversion patterns: Dark Cloud Cover Piercing Line Evening Star Morning Star Bullish Belt Hold Line Bearish Belt Hold Line Hammer/Hanging Man Bullish Doji Star Bearish Doji Star Bullish Counter Attack Lines Bearish Counter Attack Lines Bullish Engulfing Line Bearish Engulfing Line Bullish Harami Line Bearish Harami Line Homing Pigeon Discending Hawk Identical Three Crows Three White Soldiers Shooting Star/Inverted Hammer Bullish Stick Sandwich Bearish Stick Sandwich Three Inside Up Three Inside Down Three Outside Up Three Outside Down Above The Stomach Below The Stomach Bullish Three Doji Stars Bearish Three Doji Stars Three Stars North Three Stars South Ladder Top Ladder Bottom Bullish Breakaway Bearish Breakaway

Continuation patterns: Doji Gapping Up Doji Gapping Down Upside Gap Three Methods Downside Gap Three Methods Bullish Separating Lines Bearish Separating Lines Windows Rising Windows Falling Thrusting Line During Uptrend Thrusting Line During Downtrend Upside Tasuki Gap Downside Tasuki Gap Bullish Side By Side White Lines Bearish Side By Side White Lines Uptrend Windows Downtrend Windows Bullish Three Line Strike Bearish Three Line Strike Rising Three Methods Falling Three Methods Upside In Neck Method Downside In Neck Method Bullish Mat Hold Bearish Mat Hold High Price Gapping Play Low Price Gapping Play

We recommend to save configuration (by using the save button) for later use.

推荐产品
//////////////////////////////////// // /////////////////////////////////////////// ///////////////////////////////// Go My Way是趋势方向或价格走势的超精确指标。 该指标是在其他十二个指标的基础上计算的,并且具有非常复杂的机制。 //////////////////////////////////// // ////////////////////////////////////////// ///////////////////////////////// 设置非常简单,但是强烈建议保留它们不变,这在大多数情况下都适用于所有时间范围。 使用此指标,您将始终准确地知道价格走势的方向。 该指标的读数已通过特殊的数学公式精心过滤,以同时滤除噪声并具有最小的延迟。 //////////////////////////////////// // ////////////////////////////////////////// ////////////
Fibrillar
Vitalii Zakharuk
It is very easy to use the Fibrillar indicator, since the simplest is to look at the chart and act according to the indications of the colored arrows. The algorithm takes into account the measurement of prices, and this method also focuses on measuring each of the price drops (H / C, H / O, LC, LO) - which gives more detailed information, but also more averaged. When calculating this indicator, logarithmic gains are first calculated at the closing price, which allows you to filter out the tren
https://c.mql5.com/31/761/best-trend-indicator-logo-200x200-8493.png 该指标用一条红绿相见的实线来反映市场价格的万千变化。 绿线表明市场价格处于上 升期间 , 红线表明市场价格处于下跌期间。 实线颜色 的改变预示着市场已经发生变化行情极有可能会出现逆转!   建议您在日K线图上使用该指标。该指标不适合您做超短线交易! 众所周知,趋势线是技术分析家们用来绘制的某一证券 (股票) 或商品期货过去价格走势的线。目的是用来预测未来的价格变化。这条 趋势 线是通过联结某一特定时期内证券或商品期货上升或下跌的最高或最低价格点而形成的。它可以预测该证券或商品期货是处于上升的趋势还是处于下跌的趋势。但是,您一定要认识到每一个指标都有是有缺陷的,这个世界上没有任何一个指标可以精准的预测到市场未来的发展方向。因此,我建议您在使用这个指标的时候结合其他的技术分指标,以此获得更好 的 效果 。
BW Indicators
Sergei Gurov
A tool for creating Bill Williams indicators Our tool provides the ability to set Bill Williams indicators on a chart with a mouse click. - The Awesome Oscillator (AO) indicator helps to assess the driving force of the trend. - Alligator indicator — determines the current state of the trend and possible entry and exit points. - Fractals indicator — helps to identify significant levels  - Accelerator Oscillator (AC) indicator — shows the change in trend acceleration. - Market Facilitation Index
FREE
VibeFox Price Action — 内置入场标记的 20 种价格行为扫描器 VibeFox Price Action 是面向 MetaTrader 5 的实时价格行为扫描器。它在每根收盘 K 线上监测约二十种经典的蜡烛图与 K 线形态——pin bar、内包与外包 K 线、吞没、fakey、多 K 线反转、星线、镊子、区间收缩、衰竭以及突破——并在形态形成的那一刻直接在价格图表上标记出来。每种形态都是独立的开关,整个界面汇集到一个现代化的交互面板中,配有两行图标按钮。你无需自己逐根 K 线扫描,只需打开你交易的形态,让指标为你标出它们。 指标的工作原理 在每根新 K 线上,指标对近期价格历史运行一组检测器。每个检测器都是用蜡烛图几何表达的纯价格行为规则——实体大小、影线长度、相邻 K 线之间的关系,以及在短回溯窗口内的区间。当某根 K 线满足某条规则时,该形态便会在图表上以正确方向放置入场标记(Buy 标记在 K 线下方,Sell 标记在 K 线上方),并可选地附带一个标注形态名称的简短文字标签。 三个检测设置决定了规则的行为方式。 Bars 限制扫描多少历史(数值越小,在繁
CandelTimer MT5
Kambiz Shahriarynasab
300 downloads without review ? !!!! If continued. I will not share any product for free. :( Small and very simple timer next to the current price to show the end time of the current candle Very useful and important for scalpers and those who work on price action.   We assure you that we welcome any suggestions to improve this indicator and make the necessary changes to improve this indicator. You can contact us via Instagram, Telegram, WhatsApp, email or here. We are ready to answer you.
Trade Area
Jinsong Zhang
Most time the market is in a small oscillation amplitude. The Trade Area indicator helps users to recognize that time. There are 5 lines in this indicator: Area_high, Area_middle, Area_Low, SL_high and SL_low. Recommendations: When price is between Area_high and Area_Low, it's time to trade. Buy at Area_Low level and sell at Area_high level. The SL_high and SL_low lines are the levels for Stop Loss. Change the Deviations parameter to adjust SL_high and SL_low.
This is the ADX Dashboard MT5. This dashboard will scan multiple timeframes in MT5 platform, from M1 chart to D1 chart. It will send the buy/sell signals by alert on the platform or sending notification to your phone or message you via a email. The buy signal is the cross over of DI+ and DI- The sell signal is the cross under of DI+ and DI-. The up trend color will be displayed when DI+ is greater than DI- The down trend color will be displayed when DI+ is less than DI- The value of ADX value wi
Pips On Candles
Giuseppe Nittoli
Pips on Candles shows the number of pips involved in each candle on the chart. It is possible to set 3 different ranges for counting on each single candle via the RangeType parameter: With "HighLow" you count the pips present between the minimum and the maximum. The number is shown under each candlestick on the chart. With "OpenClose" you count the pips present between the opening and closing price of the candle. The number is shown under each candlestick on the chart. With "HighDistAndLowDist"
A technical Indicator Providing Price Convergence Signals along with value for experienced and professional traders. Easy to comprehend, Easy to understand.  This is a helping tool provides best signals. This indicator is designed based on the fundamentals of trade. A very good indicator you can customized its color. A best tool to find trade direction. An adaptive indicator. It constantly adapts to the trade.
Session Indicator — Forex Trading Sessions Visualizer Overview Session Indicator   is a professional MT5 indicator that displays the four major forex trading sessions (Sydney, Tokyo, London, New York) as colored horizontal bands on your chart. Never miss a trading session again! Free Product   |   Works on Any Broker   |   Auto-Detects Timezone Features Auto-Detects Broker GMT Offset Works automatically on any MT5 broker (XM, IC Markets, FXCM, etc.) No manual timezone configuration needed Label
FREE
Japanese Candlestick Indicator
Alexander Denisovich Jegorov
Simple Japanese candlestick indicator Contains 3 patterns: - bearish engulfing - bullish engulfing - doji Only contains these 3 because after rigorous testing and trading (data) these seem to be the most efficient. Also contains: - alerts if enabled  When japanese candlestick is detected it is colored with relevant color depending on bias, and also shows label next to it. Labels: - BEG = Bearish engulfing - BE = Bullish engulfing - DO = Doji
Smart Money Concepts Pro: MTF FVG & POI Scanner Stop staring at the charts for hours. The SMC Pro Scanner is an institutional-grade, multi-timeframe indicator designed to automatically detect the most high-probability Smart Money Concepts (SMC) setups on your chart. Whether you trade Forex, Gold, Crypto, or Indices, this tool eliminates chart noise and strictly highlights valid liquidity sweeps, Change of Character (CHoCH), Order Blocks (OB), and Fair Value Gaps (FVG) across multiple timeframes
Upper and Lower Reversal - 早期预测反转时刻的系统。允许您在价格变动通道的上限和下限的边界处找到价格转折点。 指示器永远不会重新着色或改变信号箭头的位置。红色箭头是买入信号,蓝色箭头是卖出信号。 适应任何时间范围和交易工具 该指标不会重新绘制,仅在蜡烛收盘时起作用。 信号警报有多种类型 该指标易于使用,只有 2 个外部可配置参数: Channel Length - 调整构建信号的价格通道的长度。 Signal Normalization - 改变信号箭头的质量水平,参数越高 - 错误信号越少(对于 BTC、黄金和高波动性工具,变化几个数量级) Alerts play sound / Alerts display message / Alerts send notification / Send email - 当输入信号箭头出现时使用通知。 Sound for signals - 信号箭头的声音文件。
Quantum Scalp Momentum is a four-in-one confluence indicator for MetaTrader 5 scalping. It overlays EMA9 and VWAP on the chart, monitors volume spikes and Stochastic momentum internally, and prints a BUY or SELL arrow only when all four components agree. Features Four-factor confluence: EMA9 for micro-trend direction, VWAP for fair value, a volume-spike check for participation, and Stochastic for momentum timing. Single clear signal: arrows fire only on full agreement of the four components, whi
GDS Renko Entry Helper
Andrey Goida
1 (1)
GDS Renko Entry Helper - Free Renko Price Interaction Indicator for MetaTrader 5 GDS Renko Entry Helper is a free Renko price interaction indicator for MetaTrader 5. It helps traders highlight important areas where price reacts, slows down, returns to a zone or changes behavior around support and resistance. The tool is designed for manual Renko analysis. It does not generate buy or sell signals and does not tell the trader when to enter the market. Its purpose is to help focus attention on area
FREE
Gold Targets 5
Sergei Linskii
黃金目標是最好的趨勢指標。 此指標獨特的演算法分析資產價格的變動,同時考慮技術和數學分析因素,確定最有利可圖的入場點,以箭頭和價格水平(買入入場/賣出入場)的形式發出信號打開訂單。 該指標也立即顯示止損價格水準和獲利的五個價格水準。 注意: 此指示器非常易於使用。 一鍵將指標安裝在圖表上,並根據其訊號和價格水平進行交易。在圖表上,無論指標安裝在哪個時間範圍內,趨勢狀態都會從四個時間框架(M30 H1 H4 D1)顯示。 此指標的優點: 1. 指示器產生的訊號精度高。 2. 指示燈訊號不重繪。 當價格穿過每條線時,它會發出聲音通知(警報和訊息)。 3.您可以在任何經紀商的MetaTrader 5交易平台上進行交易。 4. 您可以交易任何資產(貨幣、金屬、加密貨幣、股票、指數等)。 5.您可以在任何時間範圍進行交易(M15-M30剝頭皮和日內交易/H1中期交易/H4-D1長期交易)。 6. 可以在指標設定中變更各個參數(顏色、大小等),以便每個交易者可以輕鬆自訂指標。 7. 此指標可作為獨立的交易系統。 8. 圖表也顯示計時器,直到目前時間範圍的蠟燭/柱關閉。 注意:入場的準確
Engulfing Candlestick Bulkowski The engulfing candlestick is a well-known candle pattern composed of two candles. This indicator for showing engulfing candlestick that describe by Thomas Bulkowski. If you need for MetaTrader 4 version, please visit here: https://www.mql5.com/en/market/product/34193 Feature Highlights Show bullish engulfing and bearish engulfing. Customizable "Up Symbol". Customizable "Down Symbol". Customizable symbol distance from candlestick. Customizable "Down Color". Custo
PZ Mean Reversion MT5
PZ TRADING SLU
3 (2)
采用专业和量化方法进行均值回归交易的独特指标。它利用了价格以可预测和可衡量的方式转移并返回均值这一事实,这允许明确的进入和退出规则大大优于非量化交易策略。 [ Installation Guide | Update Guide | Troubleshooting | FAQ | All Products ] 清晰的交易信号 非常容易交易 可定制的颜色和尺寸 实现性能统计 优于大多数交易策略 显示合适的止损和止盈水平 它实现了电子邮件/声音/视觉警报 这个怎么运作 该指标从更高的时间范围测量完全可定制的移动平均线的标准偏差,并使用趋势跟踪方法精确地找到交易。交易是通过深入当前图表的价格行为发现的,并在价格返回到平均价格区间时关闭,根据您选择的更高时间范围计算。由于其编码方式,该指标将远离高波动性和强劲趋势市场,并且仅在可预测的情况下进行交易,在可接受的波动性与方向性比率范围内,回归均值是可行的。 指标剖析 绿线是更高时间范围内的移动平均线(也就是平均值) 虚线区域是移动平均线周围的典型价格区间 蓝线是看涨交易的突破价格 红线是看跌交易的突破价格 交易是针对均值进行的,并在典型的价格
OBVCD Pro
Narayanan Mohanan Mohanan Krishnan
OBVCD Pro: 量化成交量波动指标 描述: 由拥有 18 年市场经验的量化程序员开发,OBVCD Pro 是一款专为技术分析设计的动量振荡器。它结合了能量潮指标 (OBV) 的属性与指数平滑异同移动平均线 (MACD) 的逻辑,并利用 1.618 斐波那契比率的波动通道。 标准振荡器通常仅依赖于价格。OBVCD Pro 从累积成交量流中计算汇聚与背离。通过应用 5 状态数学过滤器,它帮助交易者跨越各种资产类别和时间框架,将其成交量累积、派发和动量枯竭进行可视化。 5 状态动量逻辑 颜色编码的直方图评估相对于波动带的成交量动量斜率,显示当前市场状态: 强牛市 (石灰绿): 成交量突破上轨,且动量正在扩大。 弱牛市 (淡绿): 成交量在上轨上方,但动量正在减弱。 震荡 (灰色): MACD 在波动带内移动 (区间盘整)。 强熊市 (红色): 成交量跌破下轨,且负动量正在扩大。 弱熊市 (橙色): 成交量在下轨下方,但卖压正在减小。 跨资产应用 OBVCD Pro 旨在适应不同的市场环境: 金属 (XAUUSD / XAGUSD): 在价格突破前识别成交量累积阶段。 能源 (USOIL
Hello This Indicator will draw Green (Up) and Red (Down) small arrows from Multi TimeFrames based in ( MACD ) to help you to take decision to buy or sell or waiting If there 4 green arrows in same vertical line that's mean (Up) and If there 4 Red arrows in same vertical line that's mean (Down)  and the options contain (Alert , Mobile and Mail Notifications). Please watch our video for more details https://youtu.be/MVzDbFYPw1M and these is EA for it https://www.mql5.com/en/market/product/59092 G
Индикатор для отображения свеч размером меньше одной минуты, вплоть до размера в одну секунду, для детализированного просмотра графика . Имеется ряд необходимых настроек для удобной визуализации. Настройка размера хранения истории ценовых данных транслируемых инструментов. Размер видимых свеч. Настройка отображения неподвижности на курсах графика. Возможность отображения на различных торговых инструментах.  Удачной всем торговли.
Range Bar Pro
Antonio Molinaro
Range Bar Pro Indicator for MetaTrader 5 Visualize market trends, levels and other features with Range Bar Pro, an innovative indicator that draws a unique, standalone candle on the right side of any MT5 chart. This single candle is generated from an analysis of price over a specified range, providing you with a powerful snapshot of the market. Key Features: Single-Candle Visualization: Gain quick insights with a single, specially derived candle that reflects comprehensive price movement over a
TheStrat Candles MT5
Robert Gerald Wood
This indicator will draw a label above or below each candle based on   Rob Smith's   The Strat   as they develop over time on your chart. As price evolves, a candle can switch between three states. When the candle first opens, if it sits completely within the previous candles high and low, then it will start as a Type 1. As time moves on, if it breaks either the high or low of the previous candle, it will be come a type 2, and should the price action be volatile and directionless, it may then
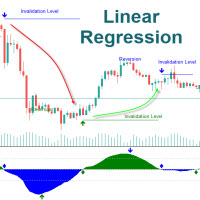
The Linear Regression Oscillator (LRO) is a technical indicator based on linear regression analysis, commonly used in financial markets to assess the momentum and direction of price trends. It measures the distance between the current price and the value predicted by a linear regression line, which is essentially the best-fit line over a specified period. Here’s a breakdown of how it works and its components: Key Components of the Linear Regression Oscillator Linear Regression Line (Best-Fit Lin
RBreaker
Zhong Long Wu
RBreaker Gold Indicators 是黄金期货一种短线日内交易策略,它结合了趋势跟踪和日内反转两种交易方式,既能捕捉趋势行情的利润,又能在行情反转时及时止盈并顺势反手。 该策略曾连续15年被美国《Futures Truth》杂志评选为前十大最赚钱的交易策略之一,具有很长的生命周期,至今仍在国内外普遍使用与研究。 本指标结合了2026年期货黄金的走势,依据14日ATR指标,分别定义了突破系数A,观察系数B,反转系数R更合理的数值,非常不错的指标,已实现年稳定盈利,值得推荐~ 以上指标适合高波动品种,参数适合期货黄金,股指期货等,如果需要其他品种行情,需要单独设定 突破系数A,观察系数B,反转系数R,进行回测才能使用。 欢迎指标售后有问题可以加+V:504282029
ElohimTrade Ultimate Confluence Pro — 全球最强大的多时间框共振指标 用 ElohimTrade Ultimate Confluence Pro 解锁您的交易潜能 —— 为追求精准、可靠与深度分析的交易者精心打造的技术分析巅峰工具。 这个尖端指标巧妙融合了多种领先技术指标的力量 —— EMA、RSI、MACD、布林带、随机指标(Stochastic)和 ADX —— 并在三个关键时间框(例如 M15、H1、H4)同时进行分析,生成清晰明确的共振得分,有效过滤市场噪音,捕捉最具盈利潜力的机会。 为什么要凭感觉交易,当您可以: 利用多时间框协同优势: 同时分析 M15、H1 和 H4 图表,以极高的准确度确认趋势和反转信号。 提升信号质量: 通过智能打分系统,结合多指标及多时间框确认,显著减少虚假信号。 实时推送提醒,领先一步: 接收即时视觉、声音提醒和手机推送通知,不错过任何重要交易时机。 可视化市场情绪: 在图表上显示的简洁交互面板,实时展示每个时间框的买入/卖出得分,不影响图表清晰度。 导出信号,深度分析: 将所有信号导出为 CSV 文件,方便外
Divergence Notification
Edson Cavalca Junior
This indicator plots in the candles the divergence found in the selected indicator and can also send a notification by email and / or to the cell phone. Works on all TIMEFRAMES. Meet Our Products   He identifies the divergences in the indicators: Relative Strength Index (RSI); Moving Average Convergence and Divergence (MACD); Volume Balance (OBV) and;. iStochastic Stochastic Oscillator  (STOCHASTIC). It is possible to choose the amplitude for checking the divergence and the indicator has to b
Antique Trend
Nadiya Mirosh
The Antique Trend Indicator is a revolutionary trend trading and filtering solution with all the important features of a trend tool built into one tool! The Antique Trend indicator is good for any trader, suitable for any trader both for Forex and binary options. There is no need to configure anything, everything has been perfected by time and experience, it works great during flats and trends. The Antique Trend indicator is a tool for technical analysis of financial markets, reflecting curren
Prime Edge
Artem Koliada
追踪机构资金的确切足迹。 Prime Edge 是一款专业的分析矩阵,旨在解码亚洲、伦敦和纽约交易时段的流动性资金流向。停止交易滞后的价格行为(Price Action)。在先进的马尔可夫链(Markov Chain)概率过滤器的支持下,该面板揭示了聪明钱(Smart Money)将动能从一个大陆转移到另一个大陆的确切时刻,自动识别高概率交易机会。 Prime Edge 不仅仅关注当前的价格水平,而是分析市场动能的方向性运动。通过将基于不同交易时段的货币强度分析与数学概率相结合,该指标可帮助交易者识别市场动能正在转变或维持其轨迹的时期。 它是如何工作的 该算法扫描 28 个交叉盘,计算 8 种主要货币(USD、EUR、GBP、JPY、CHF、CAD、AUD、NZD)的相对强度。然后,它通过比较货币强度在不同时段的变化来形成动能向量(FLOW)。这种逐步的时段跟踪提供了日内资本流动的清晰画面。 主面板组件 Global Session Matrix(全球时段矩阵):显示每种货币在特定时段内的标准化强度。基准线为 50.0。高于 50 的值表示买方压力,低于 50 的值表示卖方压力。 Mo
该产品的买家也购买
本产品已针对 2026 年市场进行更新,并针对最新 MT5 版本进行了优化。 价格更新通知: Smart Trend Trading System 目前价格为 $99 。 接下来的 30 次购买 后,价格将上涨至 $199 。 特别优惠: 购买 Smart Trend Trading System 后,请发送私信给我,即可免费领取 Smart Universal EA ,并将您的 Smart Trend 信号转换为自动交易。 Smart Trend Trading System 是一套完整的交易系统,具备不重绘、不回绘、不延迟的特点,专为希望获得更清晰信号、更准确趋势方向以及更有组织交易方式的交易者打造。 Online course , manual and [download presets] . 它将 10 多种交易工具 整合到一个系统中,包括趋势检测、反转区域、Smart Cloud、移动止损逻辑、支撑与阻力、K线着色、提醒以及多周期分析。 该系统旨在帮助您应对不同的市场环境: 趋势市场: 识别主要趋势,发现回调,跟随动能,并通过止损指导和移动止损选项寻找更清晰的入场机会。
Neuro Poseidon MT5
Daria Rezueva
4.8 (54)
Neuro Poseidon is a new indicator by Daria Rezueva. It combines precise trading signals with adaptive TP/SL levels - creating best possible trades as a result! Message me and get  Neuro Poseidon Assistant  as a gift to automize your trading process! What makes it stand out? 1. Proven profitability on all assets and timeframes 2. Only confirmed BUY and SELL signals present on the chart 3. Adaptive TP & SL levels generated by the software for each trade 4. Easy to understand - suitable for al
M1 Quantum MT5
Hamed Dehgani
5 (8)
开发者提示: 价格将于 2026年7月13日 上涨至 169美元 。 使用 M1 Quantum 的实盘交易信号 : 信号 (交易由 Quantum Trade Assistant 自动 执行,并作为本产品 免费 提供。) 价格计划: 当前价格: $149 (早期用户优惠) 下一阶段计划价格: $169 计划零售价: $299 开发者提示: 购买后请联系我,以获取 最新推荐的参数设置文件(Set File) 、交易建议,以及加入 VIP 支持群组 ,与其他 M1 Quantum 用户交流经验。 M1 Quantum 是一款专业的 M1 交易系统,提供快速且精准的交易信号,并内置止损(Stop Loss)、止盈(Take Profit)以及智能资金管理功能。 M1 Quantum 包含专业的资金管理系统,通过专注于 连续盈利交易 ,帮助交易者更快地增长账户资金。 M1 Quantum 指标 的主要特点 专为 M1 时间周期 和所有 主要货币对 设计 所有交易均配备止损和止盈 内置 资金管理功能 ,并指导交易者轻松执行交易计划 高胜率,高比例的 连续盈利交易 无重绘,无延迟 适合各种类型
SuperScalp Pro
Van Minh Nguyen
4.69 (29)
SuperScalp Pro – 专业多层共振剥头皮交易系统 SuperScalp Pro 是一款专业的多重共振剥头皮交易系统,旨在帮助交易者识别更高概率的交易机会,提供更清晰的入场确认、基于 ATR 的止损(Stop Loss)和止盈(Take Profit)水平,以及适用于 XAUUSD、BTCUSD 和主要外汇货币对的灵活信号过滤功能。 完整使用文档可在产品博客查看: [User Guide] 支持通过 SuperScalp Pro Auto Trader EA 进行自动交易: [Auto Trader] 基于 SuperScalp Pro 交易逻辑构建的黄金自动剥头皮交易 EA: [SuperScalp Gold] SuperScalp Pro 集成了 Supertrend、VWAP、EMA、RSI、ADX、成交量分析、布林带(Bollinger Bands)以及 MACD 背离分析,用于过滤低质量交易机会,减少虚假突破信号,并提高入场精准度。 SuperScalp Pro 专为 XAUUSD、BTCUSD 以及主要外汇货币对优化设计,通过基于 ATR 的波动率逻辑和规则化
SMC Intraday Formula
Kareem Abbas
5 (19)
让我们先坦诚一点。 没有任何一个指标可以单独让你实现盈利。如果有人告诉你可以,那他是在向你兜售一个梦想。任何显示完美买卖箭头的指标都可以被做得看起来毫无瑕疵——只需要放大历史中的某一段并截取成功交易的截图。我们不会这样做。 SMC Intraday Formula 是一个工具。 它为你读取市场结构,标记出概率最高的价格区域,并用简单直白的语言准确告诉你当前智能资金的行为轨迹。你仍然需要做决定。你仍然需要执行交易。但现在,你是带着精确性执行,而不是靠希望。 我们已经在黄金(XAUUSD)以及主要外汇货币对的日内剥头皮交易中使用该指标将近三年。这是我们在 M1、M5、M15 和 M30 上的日常主力工具。它之所以有效,是因为它不试图预测未来——它展示的是当前正在形成的高概率交易机会,并解释 为什么 。 它与其他所有指标有什么不同? 大多数交易指标只做一件事。移动平均线交叉。振荡指标触及某个水平。出现一个箭头。你进场交易。你亏损。你责怪指标。重复。 SMC Intraday Formula 将多个机构级概念整合为一个统一的市场解读: - 斐波那契共振引擎 不只是普通的斐波那契水平——该指标
Gold Entry Sniper
Tahir Mehmood
5 (14)
Gold Entry Sniper – 专业多周期ATR黄金交易仪表盘,适合黄金剥头皮与波段交易 Gold Entry Sniper 是一款先进的 MetaTrader 5 指标,旨在为 XAUUSD 及其他品种提供精准的 买/卖信号 。基于 ATR 移动止损逻辑 和 多周期分析仪表盘 ,适合剥头皮交易者与波段交易者,帮助识别 高概率黄金入场点 。 主要功能与优势 多周期信号分析 – 同时显示 M1、M5、M15 趋势方向。 基于ATR的动态止损 – 根据波动性自动调整。 专业图表仪表盘 – 展示信号状态、ATR水平、线性回归中线和交易方向。 清晰买卖标记 – 自动箭头与文字标签提示。 离场提示与交易管理 – 自动检测离场信号锁定利润。 全面自定义 – 调整仪表盘位置、颜色、字体及参数。 专为黄金优化 – 适用于 M1至M15 黄金剥头皮 ,也适合外汇、指数与加密货币。 为什么选择 Gold Entry Sniper? 为追求 快速、精准、可视化交易决策 的交易者打造,ATR 与多周期确认结合,帮助你抓住 最佳黄金入场点
Entry In The Zone and SMC Multi Timeframe is a real-time 2-in-1 market analysis tool that combines SMC market structure analysis and a No Repaint BUY / SELL signal system into a single indicator, built on Smart Money Concepts (SMC) — a widely adopted framework used by professional traders to understand market structure. This indicator helps you see the market more clearly, make decisions based on structure rather than guesswork, and focus on high-probability zones where price is more likely to r
Trend Sniper X
Sarvarbek Abduvoxobov
5 (4)
Trend Sniper X 是一款适用于 MetaTrader 5 的多时间周期趋势跟踪指标,帮助交易者以清晰、精确的方式识别趋势方向和潜在的反转点。 价格信息: 当前价格为促销价,随着未来更新和新功能的发布,价格可能会有所变动。 Code2Profit 频道 通过多时间框架分析掌握市场! 技术规格 平台 MetaTrader 5 指标类型 多时间周期趋势指标 运行时间周期 任何图表时间周期,可独立选择更高的时间周期 (M1–MN1) 主要交易品种 外汇、黄金 (XAUUSD) 及其他差价合约 (CFD) 推荐账户 任何账户类型 可视化 彩色趋势蜡烛 (买入/卖出/微弱/变化) + 买入/卖出箭头 附加模块 交易时段方框 (悉尼、东京、伦敦、纽约) 主要功能 多时间周期趋势分析: 直接在当前图表上投射更高时间周期的趋势方向,提供清晰的宏观视角。 弱势/不确定柱检测: 高亮显示趋势条件不明朗的柱线,让交易者避开震荡区域。 买入/卖出信号箭头: 在确认趋势变化后的柱线上自动绘制箭头,支持警报、推送和电子邮件通知。 一键开启/关闭面板: 图表上的按钮可切换指标,下拉菜单可立即切换分析时间周
Power Candles MT5
Daniel Stein
5 (8)
Power Candles V3 - 自我优化的强度指标 Power Candles V3 把货币与品种的强度直接转化为图表上可执行的交易方案。指标不再仅根据强度给K线着色,而是在后台持续运行实时自动优化,为您正面对的品种给出最佳 Stop Loss、Take Profit 与信号阈值。一键采用,Entry、Stop Loss、Take Profit 线就以精确价格绘制在图表上,提醒消息中直接包含方向。 本工具是 Stein Investments 生态系统的一部分 - 18+ 款工具,加上 Max,您的一对一 AI 交易导师。  随时在线,深入了解每一款指标,在您需要梳理思路的那一刻就在那里。  立即认识他: https://stein.investments 每根收盘K线运行 3,000+ 次交易模拟。9 种强度状态。2 种策略并行测试。一键采用最优配置。 为什么需要这个 大多数强度指标只给您一个数值,然后留下三个问题:相信哪个阈值、用哪个 Stop Loss、走哪个交易方向。Power Candles V3 在每根收盘K线上自动回答这些问题。结果就是一个完整的交易方案 -
Atomic Analyst MT5
Issam Kassas
4.33 (43)
本产品已针对 2026 年市场进行更新,并针对最新 MT5 版本进行了优化。 价格更新通知: Atomic Analyst 目前价格为 $99 。 接下来的 30 次购买 后,价格将上涨至 $199 。 特别优惠: 购买 Atomic Analyst 后,请发送私信给我,即可免费领取 Smart Universal EA ,并将您的 Atomic Analyst 信号转换为自动交易。 Atomic Analyst 是一款不重绘、不回绘、不延迟的 Price Action 交易指标,专为手动交易、清晰信号和 EA 自动化而设计。 User manual: settings, inputs and strategy.   &   User Manual PDF . 它分析价格行为、强度、动能、多周期方向和高级过滤器,帮助交易者减少噪音,避免弱势交易机会,并做出更有结构的交易决策。 该指标将复杂的市场计算转换为简单的视觉信号、彩色K线、趋势读数、止损水平和多个止盈区域,使交易者能够快速理解并应用于真实市场环境。 主要交易用途: 剥头皮和日内交易: 专为快速决策、清晰箭头、提醒、K线颜色和
Divergence Bomber
Ihor Otkydach
4.9 (92)
购买该指标的每位用户将额外免费获得以下内容: 原创工具“Bomber Utility”,该工具会自动跟踪每一笔交易,设置止损和止盈点,并根据策略规则自动平仓; 适用于不同交易品种的指标设置文件(Set 文件); 三种不同风险模式下的 Bomber Utility 设置文件:“最低风险”、“平衡风险” 和 “观望策略”; 一套详细的 视频操作手册,帮助您快速完成安装、配置并开始使用本交易系统。 注意: 要获取以上所有赠品,请通过 MQL5 的私人消息系统联系卖家。 我为您介绍原创的自定义指标 “Divergence Bomber”(背离轰炸机),它是一套基于 MACD 背离交易策略 的“全功能”交易系统。 该技术指标的主要任务是识别 价格与 MACD 指标之间的背离,并发出交易信号(包括推送通知),指示未来价格可能的运动方向。平均而言,这些信号的准确率超过 98%。有关该指标如何工作的详细说明,请观看本页面上的视频演示。 该系统使用 止损订单 和 动态回撤平仓机制 来管理交易。 Divergence Bomber 指标的主要特点: 支持交易的品种: AUDCAD、AUDCHF、AUDSG
Gann Made Easy MT5
Oleg Rodin
5 (8)
Gann Made Easy   是一个专业且易于使用的外汇交易系统,它基于使用先生理论的最佳交易原则。 W.D.江恩。该指标提供准确的买入和卖出信号,包括止损和获利水平。您甚至可以使用推送通知在旅途中进行交易。 购买后请联系我,即可免费获得交易指导和超棒的额外指标! 您可能已经多次听说过江恩交易方法。通常 Gann 的理论不仅对于新手交易者而且对于那些已经有一定交易经验的人来说都是非常复杂的东西。这是因为江恩的交易方法在理论上并不那么容易应用。我花了几年时间来完善这些知识,并将最好的原则应用到我的外汇指标中。 该指标非常易于应用。您所需要的只是将其附加到您的图表并遵循简单的交易建议。该指标不断进行市场分析工作并寻找交易机会。当它检测到一个好的入口点时,它会为您提供一个箭头信号。该指标还显示止损和获利水平。 换句话说,当您像先生一样进行交易时,该指标会为您提供最佳江恩建议。江恩亲自告诉你此时此刻该做什么。但最好的部分是您不需要了解任何有关江恩交易原则的知识,因为该指标会为您完成整个市场分析工作。
Trend Catcher ind mt5
Ramil Minniakhmetov
5 (10)
趨勢捕捉指標 趨勢捕捉指標結合了作者獨有的客製化自適應趨勢分析指標,用於分析市場價格趨勢。它透過過濾掉短期噪音,並專注於潛在的動能強度、波動性擴張和價格結構行為,來識別真實的市場方向。此外,它還結合了平滑和趨勢過濾等客製化指標,例如移動平均線、相對強弱指標 (RSI) 和波動率過濾器。 您可以在這裡查看實際運行情況以及我的其他產品: https://www.mql5.com/en/users/mechanic/seller 請注意,我不會在 Telegram 上出售 EA 或任何設置,那是騙局。所有設定都可以在我的部落格上免費取得。 重要提示!購買後請立即聯繫我,以獲取使用說明和額外獎勵! 請注意,我不會在 Telegram 上出售 EA 或任何設置,那是騙局。所有設定都可以在我的部落格上免費取得。
Entry Points Pro for MT5
Yury Orlov
4.49 (143)
传奇回归:Entry Points Pro 10。 这款传奇指标曾 3 年稳居 MQL5 Market 前三,如今全面重启。 数百条热情好评(两个版本合计 589 条),每天有数千名交易者用它交易,演示版下载 31,000+ 次。 五年来我读过你们的每一条评价——在第 10 版里,我没有给出许诺,而是把答案直接做进了产品。指标作者自 1999 年入市, 珍视诚信、自己的声誉和自己的客户 。 Entry Points Pro 给出的入场信号严格不重绘。 而且这一次不再只是作者的一面之词,而是可验证的事实:确认信号只在 K 线收盘后标出,自动化测试记录到 零重绘 (在 EURUSD、XAUUSD 和 BTCUSD 上共 2,486,568 次不变量检查——0 次违规)。测试方法完全公开——您可以在策略测试器中自行复现。 购买后请务必第一时间给我发私信。 我会发给您 扩展版说明书《交易者圣经》 ——使用本指标交易的完整指南——并告诉您如何免费获得 赠品:市场扫描器 ,它能同时分析多个品种和多个时间周期,并在一个界面上显示 Entry Points Pro 此刻在哪里表现最好。 我不要求您轻信
GoldenX Entry MT5
Kareem Abbas
5 (14)
GoldenX Entry 是一款用于 MT5 的指标,包含自适应 Smart Entry Trend 算法、信号评分系统、市场状态识别器以及波动率过滤器。每个信号都包含计算得出的入场位、三个止盈位(TP1、TP2、TP3)以及止损位。它基于多个分析层构建,旨在适应不同市场条件,将多层分析系统与内置优化器及统计跟踪系统相结合。该指标基于风险收益比(RR)指标和历史交易行为提供量化分析。 开始使用非常简单——在所选时间周期上运行优化器,然后在图表上开始使用该指标。 核心功能 GoldenX Entry 将信号引擎与内置交易管理及历史统计跟踪整合在同一图表中: - 内置优化器: 优化器可在图表上单击运行。它通过两阶段搜索流程测试200种参数组合——先进行探索,再进行优化——并在完成后自动应用选定配置。结果会按时间周期缓存,因此当返回已优化的周期时,会立即恢复相同设置。 - 黄金品种自动周期识别: 将指标加载到任何 XAUUSD 图表(M1 到月线)。系统会自动识别当前周期并加载对应预设。共包含9个时间周期配置文件,专为黄金在标准周期上优化设计。切换周期时,参数会自动调整。 - 资金参考面
M1 Sniper MT5
Oleg Rodin
5 (1)
M1 SNIPER   是一款易于使用的交易指标系统。它是一个专为 M1 时间框架设计的箭头指标。该指标可以作为独立的系统在 M1 时间框架下进行剥头皮交易,也可以作为您现有交易系统的一部分使用。虽然该交易系统专为 M1 时间框架交易而设计,但它也可以用于其他时间框架。我最初设计此方法是为了交易 XAUUSD 和 BTCUSD。但我发现这种方法在其他市场交易中也同样有用。 指标信号既可以顺势交易,也可以逆势交易。我教授一种特殊的交易技巧,帮助您利用指标信号进行双向交易。该方法基于使用特殊的动态支撑位和阻力位区域。 购买后,您可以立即下载 M1 SNIPER 箭头指标。此外,我还为所有 M1 SNIPER 工具用户免费提供下方屏幕截图所示的 Apollo Dynamic SR 指标!这两个指标的组合可以帮助您更轻松、更准确地利用 M1 时间框架进行交易。 购买后请联系我,免费获取交易提示和奖励指标! 祝您交易成功!
Crystal Heikin Ashi Signals
Muhammad Jawad Shabir
5 (2)
Crystal Heikin Ashi Signals - Professional Trend & Signal Detection Indicator Advanced Heikin Ashi Visualization with Intelligent Signal System for Manual & Automated Trading Final Price: $149 ---------> Price goes up $10 after every 10 sales . Limited slots available — act fast . Overview Crystal Heikin Ashi Signals is a professional-grade MetaTrader 5 indicator that combines pure Heikin Ashi candle visualization with an advanced momentum-shift detection system. Designed for both manual traders
ARIPoint
Temirlan Kdyrkhan
1 (1)
ARIPoint is a powerful trading companion designed to generate high-probability entry signals with dynamic TP/SL/DP levels based on volatility. Built-in performance tracking shows win/loss stats, PP1/PP2 hits, and success rates all updated live. Key Features: Buy/Sell signals with adaptive volatility bands Real-time TP/SL/DP levels based on ATR Built-in MA Filter with optional ATR/StdDev volatility Performance stats panel (Success, Profit/Loss, PP1/PP2) Alerts via popup, sound, push, or email Cu
KAMA Confluence Engine 顺势交易——在趋势反转的那一刻立即知道你的入场、止损和目标位。 KAMA Confluence Engine 是一款基于考夫曼自适应移动平均线(KAMA)的全能趋势指标,并结合了成交量加权、多周期共振确认以及自动交易水平。它会根据市场环境自动调整:在趋势行情中快速敏捷,在震荡行情中平稳过滤噪音——让你始终站在正确的一侧。 它的独特之处 成交量加权自适应引擎 ——当真实的成交量进入市场时,KAMA 线会加速;当成交量减弱时,它会放缓,让你留在强势行情中,避开假突破。 醒目的霓虹趋势带 ——亮丽、流畅的线条,底部带有深色阴影。绿色 = 上升趋势,红色 = 下降趋势,灰色 = 横盘/无交易。趋势一眼即可识别,即使远距离也清晰可见。 趋势颜色蜡烛图 ——蜡烛本身会根据趋势着色,让整个图表呈现统一的趋势故事。 自动 Entry / SL / TP 水平(新功能) 当新趋势出现时,指标会自动在图表上绘制可直接使用的交易水平: 入场线位于信号价格 止损由 ATR 计算(根据品种波动性自动调整) TP1 / TP2 / TP3 按你设定的风险回报比(默认
The Oracle Pro
Ottaviano De Cicco
5 (1)
The Oracle Pro:用于 MT5 的合成多周期偏向引擎 ️ 夏季上市优惠 — 早期买家可以 199 USD 获得 The Oracle Pro。价格将随关注度上升;最终价格 399 USD。 The Oracle Pro 是一款面向高要求与专业交易者的 MetaTrader 5 高级多周期 偏向引擎 。它以纪律回答一个问题:当前每个周期的方向偏向是什么、强度如何、各周期之间的一致程度如何?一切仅在已收盘的 K 线上计算——绝不重绘。 The Oracle Pro 是一套多因子共识系统。它将专有指标与优化算法整合为单一而精密的共识向量,并在单个指标实例内,跨当前周期与更高周期的堆栈进行读取——而不是在多个图表上堆叠互不相关的工具。 它是 Oracle 共识方法的专业进化版:完整重建为高级操作控制台,面向希望在一个纪律化工作流中获得深度、多周期背景与背离洞察的交易者。 是偏向引擎,而非信号生成器 The Oracle Pro 明确自身定位。它是一款提供纪律化方向背景的 多周期多因子偏向指标 。它 不是 信号生成器:不承诺入场、出场或盈利。偏向是背景——你在其方向上交易自己的设置
介绍     Quantum Breakout PRO   ,突破性的 MQL5 指标,正在改变您交易突破区域的方式!由拥有超过13年交易经验的资深交易员团队开发,     量子突破 PRO     旨在通过其创新和动态的突破区域策略将您的交易之旅推向新的高度。 量子突破指标将为您提供带有 5 个利润目标区域的突破区域的信号箭头,以及基于突破框的止损建议。 它既适合新手交易者,也适合专业交易者。 量子 EA 通道:       点击这里 重要的!购买后请私信我领取安装手册。 建议: 时间范围:M15 货币对:GBPJPY、EURJPY、USDJPY、NZDUSD、XAUUSD 账户类型:ECN、Raw 或 Razor,点差极低 经纪商时间:GMT +3 经纪商:IC Markets、Pepperstone with Raw 和 Razor 的点差最低 规格: 不重漆! 最多 5 个建议利润目标区域 建议止损水平 可定制的盒子。您可以设置自己的 Box Time Start 和 Box Time End。 接触 如果您有任何疑问或需要帮助,请通过私人消息与我联系。
MT5 Indicator See What the Market Is Really Doing, See the 3 Market Phases Live in front of you (Contraction, Expansion, Trend Phases) and have Better Entries at the Early Stage in the Trend Phase. Stop guessing . Start reading the market like the institutions, Smart Money do. Apex Market Structure Pro Indicator for MT5 is a precision smart-money analysis tool that strips away the noise and shows you the true structure beneath every candle, liquidity, structure shifts, accumulat
Super Hero Signals
Eugen-alexandru Zibileanu
5 (2)
SUPER HERO Signals 是 MeanFX 推出的全新交易指标。它将精准交易信号与自适应 TP/SL(止盈/止损)水平相结合,从而帮助交易者获得具有最佳统计优势的交易机会。 每售出 5 份后价格将上涨一次,下一阶段价格为 50 美元 。 购买前请先联系我,以获取实时图表演示和最新交易统计数据。这将帮助您做出更明智的决定,并有望提升您的交易表现。 为什么选择 SUPER HERO Signals? 经统计验证的 M15 黄金(XAUUSD)交易表现 (专注于精通单一时间周期,而不是同时涉猎多个市场却无法保持稳定结果。) 每天仅产生 1 至 3 次交易机会,胜率高,并具备明确的统计优势。 图表上仅显示经过确认的 BUY(买入)和 SELL(卖出)信号。 指标会根据市场情况自动生成每笔交易的止盈(TP)和止损(SL)水平。 平均胜率达到 75% 以上。 平均盈亏比达到 1:2 以上,止盈目标至少为止损距离的两倍。 支持手机推送通知和实时警报。 采用适合 Prop Firm(资金管理公司)规则的交易方式。 简单易懂,适合所有经验水平的交易者。 可获得开发者提供的个人技术支持。 10
ACB Breakout Arrows MT5
KEENBASE SOFTWARE SOLUTIONS
3.5 (2)
ACB Breakout Arrows 指标通过检测特殊的突破形态,提供市场中的关键入场信号。该指标持续扫描图表中的价格动量,在价格出现重大变动前,提前提供精确的入场信号。 点击此处获取多品种多周期扫描器 - ACB Breakout Arrows MT5 扫描器 主要特点 指标自动提供止损和止盈价格。 内置多周期扫描仪仪表盘,可追踪所有时间周期的突破信号。 适用于日内交易者、波段交易者和剥头皮交易者。 优化算法提升信号精度。 特别设置的快速盈利线用于无亏损移动或短线目标。 支持胜率、盈亏比、平均利润等绩效分析指标。 无重绘,信号可靠。 交易确认 - 可使用 ACB Trade Filter 指标 来过滤低概率的交易信号。 强烈买入: 向上箭头 + 绿色柱状图 + 多头趋势。 强烈卖出: 向下箭头 + 红色柱状图 + 空头趋势。 当柱状图为灰色且趋势为震荡时,应避免交易。 (可选) -  使用  KT 支撑阻力水平指标  避免在重要支撑/阻力位附近入场。这类交易可能迅速变成亏损。 “一个成功交易者的目标是做出最好的交易。金钱只是附属。” —— 亚历山大·埃尔德 输入参数 历史
Atbot
Zaha Feiz
4.69 (55)
AtBot: 它是如何工作的以及如何使用它 ### 它是如何工作的 “AtBot”指标用于MT5平台,通过结合技术分析工具生成买入和卖出信号。它集成了简单移动平均线(SMA)、指数移动平均线(EMA)和平均真实波幅(ATR)指标,以识别交易机会。此外,它还可以利用Heikin Ashi蜡烛来增强信号的准确性。 购买后留下评论,您将获得特别的奖励礼物。 ### 主要特点: - 不重绘: 信号在绘制后不会改变。 - 不变动: 信号保持一致,不会被更改。 - 无延迟: 提供及时的信号,没有延迟。 - 多种时间框架: 可在任何时间框架上使用,以适应您的交易策略。 ### 操作步骤: #### 输入和设置: - firstkey (TrendValue): 调整趋势检测的灵敏度。 - Secondkey (SignalValue): 定义买入/卖出信号生成的灵敏度。 - masterkey (ExitValue): 控制信号的退出策略。 - h: 切换是否根据Heikin Ashi蜡烛生成信号(真/假)。 - notifications: 启用或禁用信号提醒。 #### ATR计算: ATR测
Prop Firm Sniper MT5
Mohamed Hassan
5 (1)
Prop Firm Sniper MT5 is a professional market structure indicator that automatically identifies high-probability BUY and SELL opportunities using BOS and CHoCH analysis. Recommended Timeframes: For backtesting, use the indicator on   M5 or M15   for Gold (XAUUSD), and   M15 or H1   for more volatile Forex pairs such as   GBPUSD, USDJPY, EURGBP , and similar markets. CONTACT ME AFTER PURCHASE TO CLAIM YOUR FREE BONUSES! Prop Firm Sniper  is a professional market structure indicator designed to
UZFX {SSS} 超短线智能信号 v4.0 MT5 是一款无重绘的高性能交易指标,专为在快速波动的市场中需要精准、实时信号的超短线交易者、日内交易者和波段交易者设计。该指标由 (UZFX-LABS) 开发,融合了价格行为分析、趋势确认和智能过滤技术,可在所有货币对和时间周期内生成高概率的买卖信号、预警信号以及趋势延续机会。 别再对交易犹豫不决了,开始遵循这一专为追求清晰、精准和纪律性市场执行的交易者设计的结构化信号系统吧。 我的建议* 最佳时间周期:15分钟及以上。 {H1} 是我的最爱。而且效果令人惊叹……!! 更新后的主要功能 • 自动买入和卖出信号检测 • 先进的反转识别逻辑 • 潜在市场反转前的早期预警信号 • 趋势延续确认信号 • 内置风险管理功能,包含入场点、止损点、TP1、TP2和TP3水平 • 完全可自定义的风险回报比 • 实时警报、声音提醒和移动端推送通知 • 带交易建议的专业信息面板 • 适用于所有MT5交易品种和时间周期 • 界面简洁、轻量且用户友好 为什么交易者选择 UZFX SSS? 大多数交易者亏损的原因在于入场过晚、平仓过早,或者缺乏明确的交
本产品已针对 2026 年市场进行更新,并针对最新 MT5 版本进行了优化。 价格更新通知: Smart Price Action Concepts 目前价格为 $200 。 接下来的 30 次购买 后,价格将上涨至 $299 。 特别优惠: 购买后,请发送私信给我,即可领取 免费赠品 + 礼物 。 首先需要强调的是,这款交易工具是不重绘、不回绘、不延迟的指标,因此非常适合专业交易使用。 Online course , and manual Smart Price Action Concepts 指标是一款非常强大的工具,适合新手和有经验的交易者使用。它将 20 多个实用指标整合到一个系统中,结合了 Inner Circle Trader Analysis 和 Smart Money Concepts Trading Strategies 等高级交易理念。该指标专注于 Smart Money Concepts,帮助交易者理解大型机构如何交易,并辅助预测其市场行为。 它特别擅长流动性分析,使交易者更容易理解机构交易逻辑。它也非常适合预测市场趋势并仔细分析价格走势。通过让交易与机构策略保
Axiom Matrix
Issam Kassas
5 (3)
AXIOM MATRIX MT5 首发价格:$99 Axiom Matrix 现以 $99 的首发价格提供。 前 30 次购买完成后,价格将上涨至 $199。 购买后,请直接私信我,以获取使用说明并领取您的专属赠品奖励。 Axiom Matrix 是一款适用于 MetaTrader 5 的专业多品种、多时间周期市场扫描器和决策仪表板。 它会扫描您的 Market Watch,分析多个时间周期,读取多个证据引擎,比较最强的交易机会,并在一个清晰的矩阵仪表板中显示最佳 BUY、SELL、WAIT 或被阻止的状态。 我开发 Axiom Matrix,是因为我想要一个可以替我完成繁重市场扫描工作的工具。 我不想只单独检查 RSI。 然后单独检查 MACD。 然后检查移动平均线。 然后检查成交量。 然后检查波动率。 然后检查支撑和阻力。 然后还要手动在不同品种和时间周期之间切换,只为了建立一个交易思路。 我想要一个仪表板,可以扫描市场、比较证据、排序最佳机会,并告诉我现在最强的交易设置在哪里。 这就是 Axiom Matrix 背后的核心理念。 AXIOM MATRIX 的功能 Axiom Ma
FX Power MT5 NG
Daniel Stein
5 (33)
FX Power:分析货币强度,助您做出更明智的交易决策 概述 FX Power 是一款专业工具,帮助您全面了解主要货币和黄金在任何市场条件下的真实强度。通过识别强势货币用于买入,弱势货币用于卖出, FX Power 简化了交易决策,并帮助您发现高概率的交易机会。不论您是想跟随趋势还是通过极端的 Delta 值预测反转,这款工具都能完美适应您的交易风格。别再盲目交易——用 FX Power 让您的交易更加智慧。 1. 为什么 FX Power 对交易者极具价值 实时货币和黄金强度分析 • FX Power 实时计算并显示主要货币和黄金的相对强度,助您全面了解市场动态。 • 监控领先或落后资产,轻松识别值得交易的货币对。 全面的多时间框架视图 • 跟踪短期、中期和长期时间框架的货币和黄金强度,以便将您的交易策略与市场趋势保持一致。 • 无论是快进快出的短线交易还是更长期的投资策略, FX Power 都能为您提供所需的信息。 Delta 动态分析用于趋势和反转 • 极端 Delta 值常常预示反转机会,而平缓的 Delta 变化则确认趋势延续。 • 使用 Delta 分析,轻
作者的更多信息
Trend View
Emanuele Cartelli
Trend View is a simple indicator that shows in a text the trend of the current currency in the timeframe you choose. Inputs are: Color: color of the text. Timeframe: timeframe for calculations. Trend can be: UP: bullish trend. DOWN: bearish trend. ---: trend not defined. You can use this indicator to show the main trend of a bigger timeframe helping you to choose your trades. Note: text is draggable.  
FREE
Pattern Finder
Emanuele Cartelli
Pattern Finder is a MULTICURRENCY indicator that scans the entire market seeking for up to 62 candlestick patterns in 15 different pairs/currencies all in one chart! You can also filter the scanning by following the trend by a function based on exponential moving average. Indicator parameters Alerts ON/OFF: Alert on screen ON/OFF : enables or disable screen alters. Notification by email ON/OFF : enable or disable email alerts. Push notification ON/OFF : enable or disable push notification on mo
Trend Lines View
Emanuele Cartelli
Trend Lines View draws trend lines in the current chart in the timeframe you choose, taking account of the last two maximum and minimum. Inputs are: Timeframe: timeframe for calculation. Period of calculation Max/Min: Integer that indicates the number of bars to define a minimum or a maximum; 1 means minimum/maximum have to be the lower/higher value of 1 bar previous and 1 bar after, 2 means a  the minimum/maximum have to be the lower/higher value of 2 bar previous and 2 bar after, etc. Color hi
Support Resistance View draws horizontal lines in the current chart that define in real time the values of Supports/Resistances for the timeframe tha you choose. Inputs: Lines color: color of the lines. Timeframe: timeframe for calculations. Support and Resistance are values at which the currency usually inverts the trend or have a breakthrought, so you can use this values to define a strategy for trading.
Stochastic Break Point is based on the stochastic oscillator and moving average to find the points in which the currency will probably go in a defined direction. Inputs: Alarm ON/OFF: turn on or off alarm on screen. The indicator draws an arrow pointing the direction to follow based on when the stochastic line cross the signal line and in which direction it does it, filtered by the moving average direction. Stochastic Break Point can help you to choose the moment to do your trades in a specific
Support Resistance Pattern is based on supports and resistance to find the points in which the currency will probably go in a defined direction. Inputs: Alarm ON/OFF: turn on or off alarm on screen. The indicator draws an arrow pointing the direction to follow based on when a specific pattern of bars is found near a support or a resistance. Support Resistance Pattern can help you to choose the moment to do your trades in a specific direction, strengthening your trading strategy.
Support Resistance Inversion is based on supports and resistance to find the points in which the currency will probably go in a defined direction. Inputs: Alarm ON/OFF: turn on or off alarm on screen. The indicator draws an arrow pointing the direction to follow based on when the price cross or bounce on a support or a resistance. Support Resistance Inversion can help you to choose the moment to do your trades in a specific direction, strengthening your trading strategy.
Retracement Trend
Emanuele Cartelli
Retracement Trend is based on a priceaction logic and volume of the lasts bars. Inputs: Alarm ON/OFF: turn on or off alarm on screen. The indicator draws an arrow pointing the direction to follow based on when a specific pattern of bar's volume is found and the price has a specific direction. Retracement Trend can help you to choose the moment to do your trades in a specific direction, strengthening your trading strategy.
MA Break Point
Emanuele Cartelli
MA Break Point is based on moving average and a priceaction logic to find the points in which the currency will probably go in a defined direction. Inputs: Alarm ON/OFF: turn on or off alarm on screen. The indicator draws an arrow pointing the direction to follow based on when the currency cross a moving average and verify the trend with another ma. MA Break Point can help you to choose the moment to do your trades in a specific direction, strengthening your trading strategy.
Chart Reverse Point
Emanuele Cartelli
Chart Reverse Point is based on moving average, volumes, and a priceaction logic to find the points in which the currency will probably go in a defined direction. Inputs: Alarm ON/OFF: turn on or off alarm on screen. The indicator draws an arrow pointing the direction to follow based on when a specific pattern of bars is found near the moving average and the volumes are higher than a minumun defined by the indicator. Chart Reverse Point can help you to choose the moment to do your trades in a sp
筛选:
无评论
回复评论