Magic sl NASDAQ 100

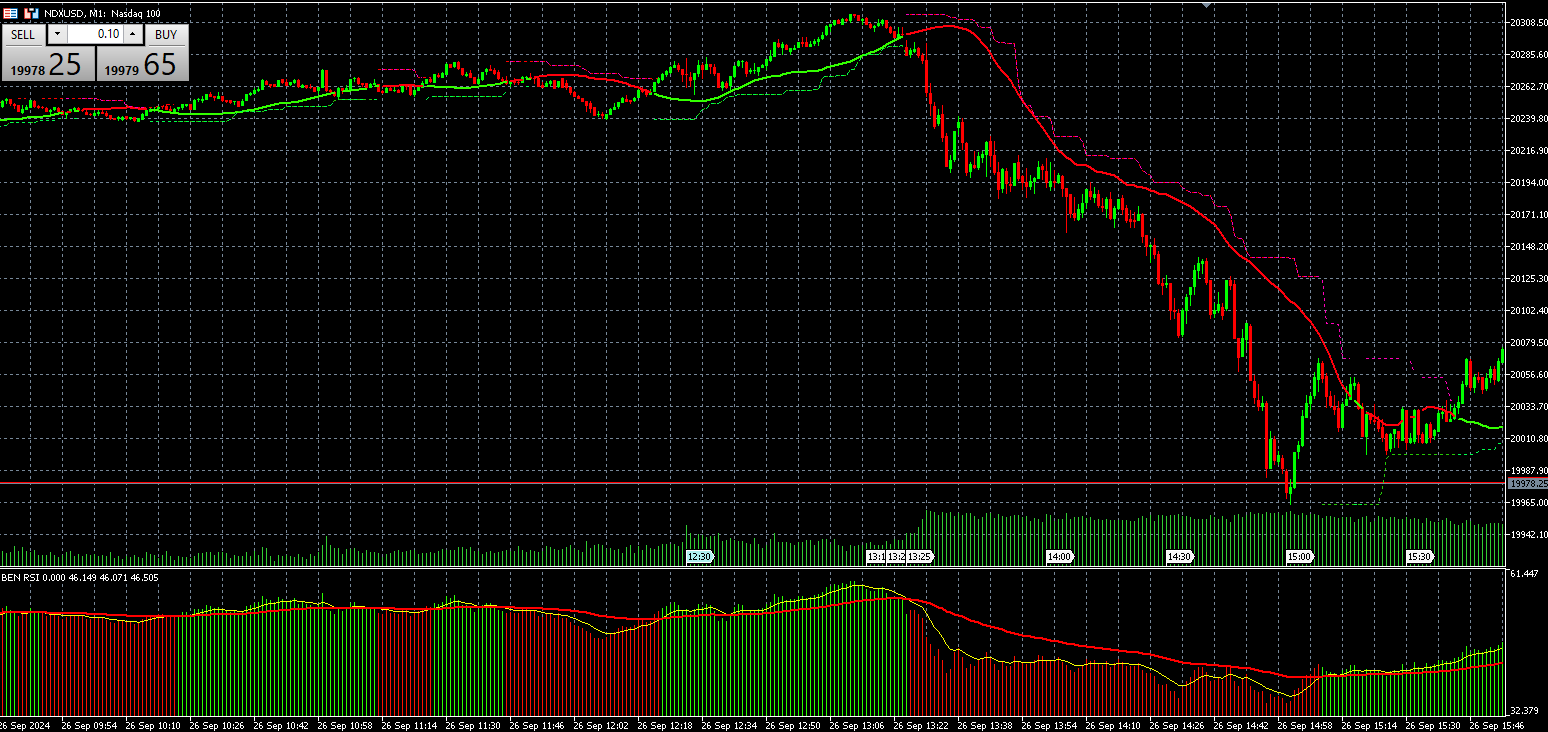
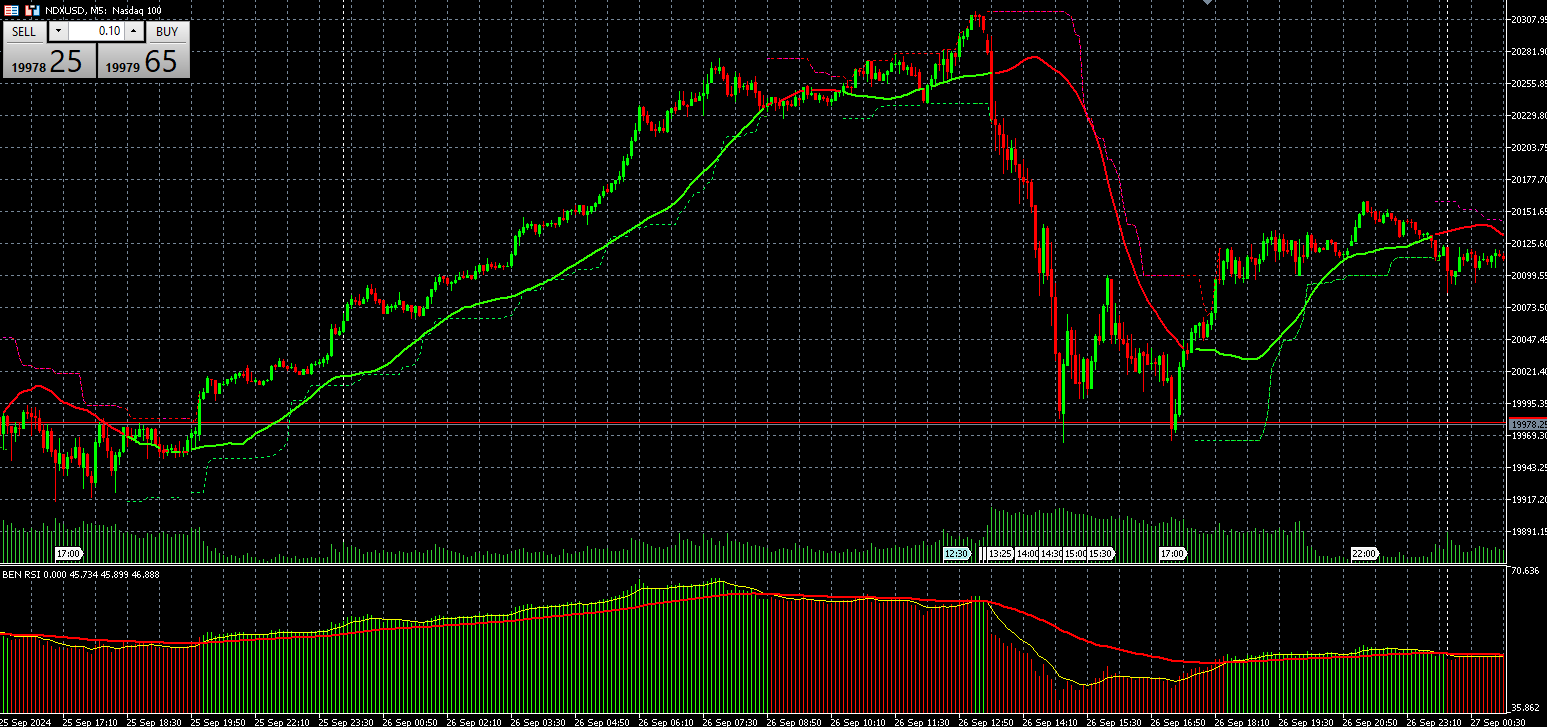
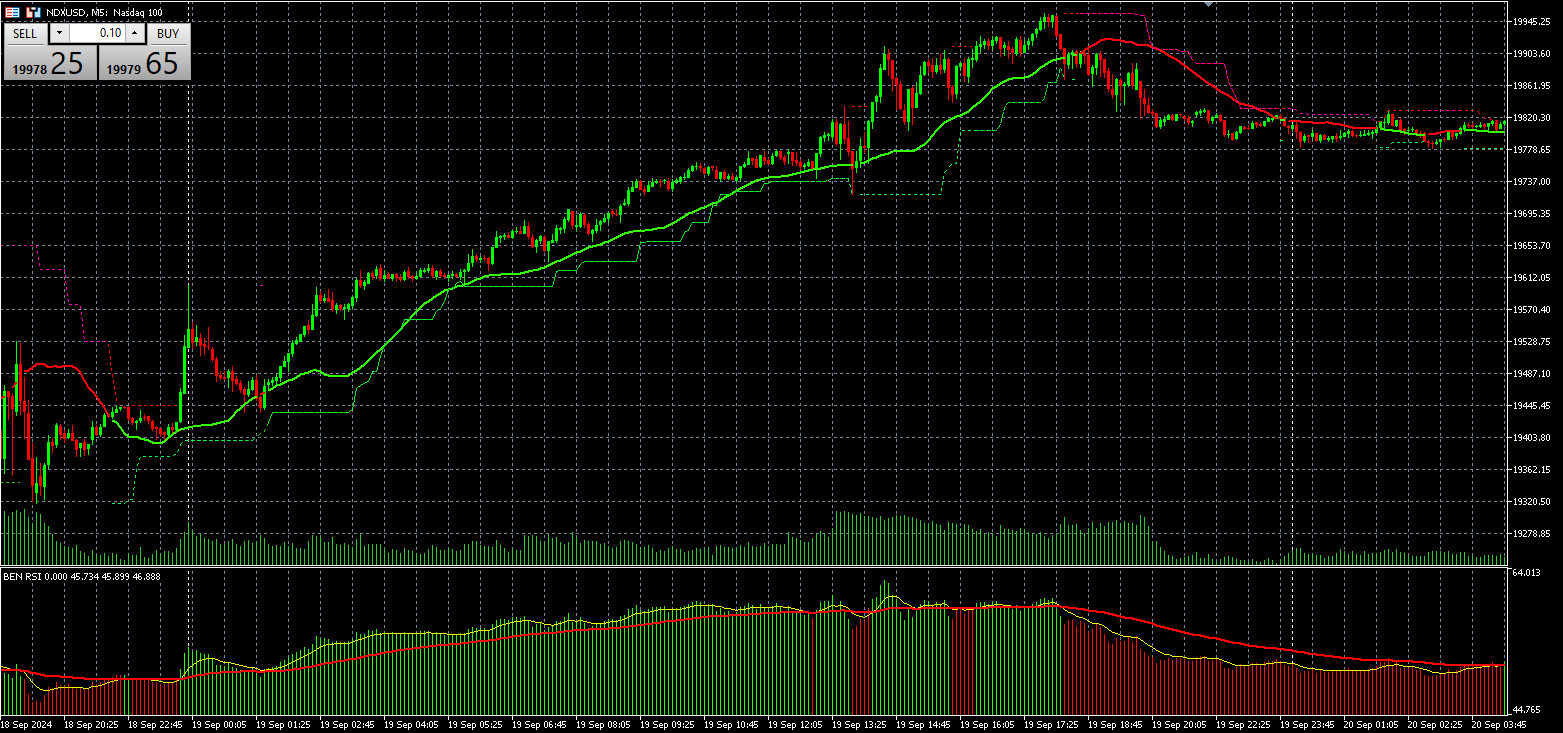
The indicator now at your disposal is undoubtedly one of the best tools for trading in the NASDAQ 100 market, especially in the 1-minute and 5-minute timeframes. This indicator is meticulously designed for high precision and can be adjusted for other timeframes as well. Simply run it and receive good exit signals.

Key Features:

  • Specialized performance in the 1-minute and 5-minute timeframes: While this indicator works in other timeframes as well, its primary focus is on these two timeframes.
  • Compatibility with the NASDAQ 100 Magic Strategy: This indicator is one of the main tools of this strategy and helps you find optimal exit points in trades.
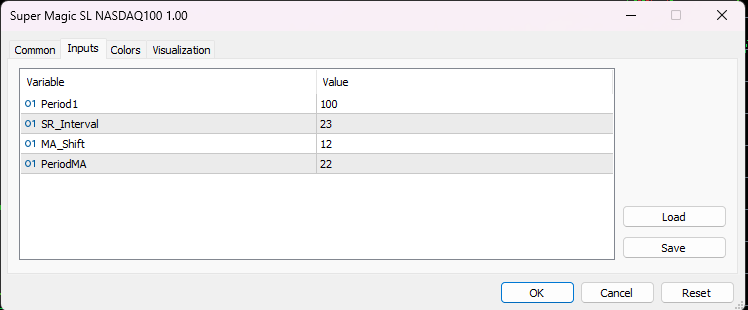
  • This indicator is designed based on a combination of optimized indicators and golden ratios, specifically calibrated for NASDAQ 100, and has been tested for over a year. However, the user must backtest this indicator and evaluate its effectiveness before making trades.

Trading Guide:

  1. Receive the initial signal from the Magic Moving Pro indicator.
  2. Enter the trade with confirmation from the Magic NASDAQ100 indicator after a candle with a large body (at least 80% crossing the moving average) confirms the signal.
  3. If the histogram changes color at the same time, this is the best time to enter a trade.
  4. If the initial signal is given but the candles haven't crossed the moving average, it's better to wait as it could signal market divergence.
  5. For exiting the trade, use the Magic SL NASDAQ100 indicator, which will help you exit at an appropriate time.

This product is priced at $150 but will be available for a limited time at $40.


推荐产品
Noize Absorption Index
Ekaterina Saltykova
Noize Absorption Index - is the manual trading system that measures the difference of pressure between bears forces and bulls forces. Green line - is a noize free index that showing curent situation. Zero value of index shows totally choppy/flat market.Values above zero level shows how powerfull bullish wave is and values below zero measures bearish forces.Up arrow appears on bearish market when it's ready to reverse, dn arrow appears on weak bullish market, as a result of reverse expectation.
Trend Reversal Scanner MT5
Reza Aghajanpour
5 (8)
**   All Symbols   x   All Timeframes   scan just by pressing scanner button ** Discount: The price is $50$, But now it is just $39, Limited time offer is active. *** Contact me  to send you instruction and add you in "Trend Reversal group" for sharing or seeing experiences with other users. Introduction: Trendlines are the most famous technical analysis in trading . Trendlines continually form on the charts of markets across all the different timeframes providing huge opportunities for traders
Level Volume Pro
John Samfel Bucton Josol
HAT IT DOES   MONTHLY HIGH & LOW — AUTO-DRAWN EVERY MONTH Draws the High and Low of every month for the current year (or any year you set). Each level extends as a horizontal ray into the future so you always see where price is reacting to historical monthly extremes. Color-coded (blue = high, red = low), labeled (JAN HIGH, FEB LOW etc.), fully customizable width and style. Toggle individual months on or off.   WEEKLY HIGH & LOW
SMC Venom 模型 BPR 指標是針對在智慧貨幣 (SMC) 概念內工作的交易者的專業工具。它會自動辨識價格圖表上的兩種關鍵模式: FVG (公平價值缺口)是三根蠟燭的組合,其中第一根和第三根蠟燭之間存在缺口。它在水平之間形成一個沒有成交量支撐的區域,這通常會導致價格調整。 BPR (平衡價格區間)是兩種 FVG 模式的組合,形成一個「橋樑」 - 當價格以低成交量活動移動時,突破並返回到水平的區域,從而在蠟燭之間產生間隙。 這些模式可協助交易者透過分析圖表上的交易量和價格動態(大型市場參與者和普通參與者之間的互動)來識別關鍵的支撐/阻力位、突破區域和切入點。 此指標以矩形和箭頭的形式可視化模式,也支援靈活的警報設定。 主要特點: 模式顯示模式:選擇顯示 BPR 模式(看漲和看跌)或 FVG 模式(看漲和看跌)。 可以隱藏所有圖表分析模式。 以條數過濾:BPR 結構中 FVG 之間的最小/最大距離。 訊號的附加視覺化: 箭頭有 9 種類型可供選擇(標準、細、分形等)或手動輸入 Wingdings 代碼,其表格可以選擇性地顯示在圖表上。 設定顏色、尺寸及其縮放時相對於價格的動態
可以说,这是您可以为MetaTrader平台找到的最完整的谐波价格形成自动识别指标。它检测19种不同的模式,像您一样认真对待斐波那契投影,显示潜在的反转区域(PRZ),并找到合适的止损和获利水平。 [ 安装指南 | 更新指南 | 故障排除 | 常见问题 | 所有产品 ] 它检测19种不同的谐波价格形态 它绘制了主要,衍生和互补的斐波那契投影(PRZ) 它评估过去的价格走势并显示每个过去的形态 该指标分析其自身的质量和性能 它显示合适的止损和获利水平 它使用突破来表明合适的交易 它在图表上绘制所有样式比率 它实现了电子邮件/声音/视觉警报 受斯科特·M·卡尼(Scott M. Carney)的书的启发,该指标旨在满足最纯粹和最熟练的交易者的需求。但是,它采取了一种使交易更容易的方式:在向交易发出信号之前,它会等待Donchian朝正确方向突破,从而使交易信号非常可靠。 斐波那契投影与向量无关 它实现了电子邮件/声音/推送警报 它绘制了ABCD投影 重要提示: 为了符合 Scott M. Carney先生 的商标申诉,某些图案名称已重命名为不言自明的替代方式, Scott M.
Pro Gold System Indicator
PEDRO JOAQUIM GONCALVES GOMES
ADVANCED FUNCTIONALITIES: Trend Score (0-100) with visual bar Intelligent signals with adjustable strength (1-10) Risk management with automatic TP/SL Audible and visual alerts Price zones with smooth filling Multi-indicator analysis (RSI, ATR, BB, EMAs) DESIGN FEATURES Modern Visual: Smooth and well-spaced lines (EMA with 2-3px width) Vibrant and professional colors (Sky Blue, Orange, Gold) Modern arrows (code 233/234) for buy/sell signals Configurable dark/light theme Adjustable transparency f
Trading Utility for Forex Currency Pairs Only not for Gold  Functions Auto Lot Calculation based on Risk Auto stoploss  Auto TakeProfit Breakeven Auto Close Half % Close in percentage with respect to the PIPs Pending Orders BuyLimit Sell Limit with distances BuyStop Sell Stop    with distances Trading Informations Risk in percentage For Multiple trades Combine Takeprofit and Combine Stoplosses
Multi Timeframe Smc Bias Finder Trading in alignment with higher timeframe structure is one of the most consistently profitable habits a trader can build. The difficulty has always been execution: switching between timeframes, manually reading structure, and keeping track of whether the Daily, 4-Hour and 1-Hour are all pointing in the same direction before committing to a position. Multi Timeframe Smc Bias Finder resolves that entirely. Three tools in one indicator: A live multi-timeframe bias d
An indicator of pattern #31 ("Long Island") from Encyclopedia of Chart Patterns by Thomas N. Bulkowski. The second gap is in the opposite direction. Parameters: Alerts - show alert when an arrow appears   Push - send a push notification when an arrow appears (requires configuration in the terminal) GapSize - minimum gap size in points ArrowType - a symbol from 1 to 17 ArrowVShift - vertical shift of arrows in points   ShowLevels - show levels ColUp - color of an upward line ColDn - color of a d
Chinese (Simplified) 代码优势解释(不涉及具体代码) 1. 更精细的市场状态区分(三维) 大多数工具只显示“涨”或“跌”,但该工具特别分离出了**“盘整”(Sideways)**力量。交易者可以清晰看到: 买方主导时(多头)。 卖方主导时(空头)。 最重要的是: 市场无方向或休息时(盘整),有效减少震荡期的操作失误。 2. 强度量化震荡指标 (0-100) 将价格波动标准化为 0 到 100 的范围: 极端区域: 设定超买/超卖阈值(如高于80或低于20)。 区域填充: 对关键区域进行着色,一眼就能识别市场是否处于“峰值”。 3. 灵活的噪音过滤(平滑与加权) 设计用于自定义信号的“平滑度”: 减少误导信号: 提供多种平均算法(RMA, EMA, SMA 等)以过滤市场噪音。 成交量加权: 可选择加入**成交量(Volume)**进行计算,比单纯看价格更可靠。 4. 清晰的趋势提示 交叉箭头: 当买卖力量发生转换时显示箭头,明确入场时机。 可定制显示: 用户可开关线条、填充或箭头,保持图表整洁。 5. 性能与稳定性 优化了资源占用,修复了高 CPU 使用率问题,多开
Harmonic Pattern Structure Harmonic Pattern Structure is a professional MetaTrader 5 indicator that automatically detects classic harmonic patterns using strict Fibonacci ratio validation and XABCD price structure. Designed for traders who value precision, clean visuals, and structured analysis, the indicator highlights potential reversal zones based on price geometry, supporting consistent and objective decision-making. SUPPORTED HARMONIC PATTERNS Gartley (222) Butterfly Bat Crab Shark Cy
Price Magnet — Price Density and Attraction Levels Indicator Price Magnet is a professional analytical tool designed to identify key support and resistance levels based on statistical Price Density. The indicator analyzes a specified historical period and detects price levels where the market spent the most time. These zones act as “magnets,” attracting price action or forming a structural base for potential reversals. Unlike traditional Volume Profile tools, Price Magnet focuses on price-time d
TRI Visualizer
Yoshimi Mon 三 Ura
TRI Visualizer MT5 – Thermodynamic Market Analysis Overview The TRI (Thermal Range Indicator) Visualizer Enhanced is a rare market analysis indicator that goes beyond conventional technical analysis, applying principles of thermodynamics from physics. It interprets market price fluctuations as “thermodynamic energy,” enabling the highly accurate detection of subtle market changes that are often overlooked. Innovative Mechanisms 1. Dual Calculation Engines Classic TRI Mode Formula: |Close
AI Gold Asia Signal v2.00 Professional Indicator - Asia/London Session Breakout for Gold (XAUUSD) The indicator is extremely convenient for busy people and those constantly on the move. With the built-in push notification you receive a signal on your phone with the Take Profit and Stop Loss levels shown as exact prices. This makes it quick and easy to place a trade directly from your mobile device with MT5 installed. You can also install AnyDesk (free) on both your home computer and your phone,
Monster Harmonics Indicator is a harmonic pattern indicator. It recognizes Gartley, Bat, Crab, Butterfly, Cypher, White Swan, Black Swan, Shark and AB=CD patterns. Projected patterns that are not yet completed are recognized, too. Monster even shows the PRZ (Potential Reversal Zone). Users can add their own user defined patterns to Monster. Besides the current pattern, Monster also shows all patterns in the symbols history. Monster will provide alerts for developing patterns. Introduced by H.M.
CosmiCLab FIBO
Kirils Subins
CosmiCLab SMC FIBO CosmiCLab SMC FIBO is a professional trading indicator designed for traders who use Smart Money Concepts (SMC), market structure analysis and Fibonacci retracement levels. The indicator automatically detects market swings and builds Fibonacci levels based on the latest impulse movement. It also identifies market structure changes such as BOS (Break of Structure) and CHOCH (Change of Character), helping traders understand the current market direction. CosmiCLab SMC FIBO also pr
Blahtech Market Profile MT5
Blahtech Limited
5 (10)
Was: $249  Now: $99   Market Profile defines a number of day types that can help the trader to determine market behaviour. A key feature is the Value Area, representing the range of price action where 70% of trading took place. Understanding the Value Area can give traders valuable insight into market direction and establish the higher odds trade. It is an excellent addition to any system you may be using. Inspired by Jim Dalton’s book “Mind Over Markets”, this indicator is designed to suit the
Key level wedge MT5
Presley Annais Tatenda Meck
The   Key level wedge MT5   indicator automatically draws rising wedge pattern and falling wedge pattern for you on the chart. This pattern is really good when used as a confirmation entry at key support & resistance, supply & demand and reversal zones. Advantages  The   Key level wedge MT5   block DOES NOT RE-PAINT, giving you confidence when a signal appears and also helps when looking back.  The   Key level wedge MT5   includes an on/off button on the chart to easily keep the charts clean
Laguerre SuperTrend Clouds   adds an Adaptive Laguerre averaging algorithm and alerts to the widely popular SuperTrend indicator. As the name suggests,   Laguerre SuperTrend Clouds (LSC)   is a trending indicator which works best in trendy (not choppy) markets. The SuperTrend is an extremely popular indicator for intraday and daily trading, and can be used on any timeframe. Incorporating Laguerre's equation to this can facilitate more robust trend detection and smoother filters. The LSC uses the
Trend Indicator Multi-timeframe trend scoreboard with box system, ATR impulse arrows and automatic score for MetaTrader 5. Panel Position The scoreboard panel can be freely positioned in the chart using X and Y coordinates. Parameter Default Description X 260 Horizontal position of the panel (pixels from left) Y 25 Vertical position of the panel (pixels from top) Timeframes The scoreboard displays three columns. Each column can be set to any timeframe independently. Parameter Default Descri
RSI Currency Strength Meter is a powerful and elegant multi-currency indicator that measures the real-time relative strength of the 8 major currencies using RSI logic. By calculating the smoothed performance of each currency across its major pairs and applying the RSI formula, it delivers clean and responsive strength lines that make it easy to spot which currencies are truly strong or weak at any moment. This indicator is particularly useful for visualizing currency correlations and divergence
DYJ BoS
Daying Cao
DYJ BoS指标自动识别和标记市场结构转变的基本要素,包括: 结构突破(BoS):当价格出现重大波动,突破之前的结构点时检测到。 它标记了可能的上升趋势线和下降趋势线(UP&DN,也是就不断创新高和创新低),一旦价格突破这些线,标记红色(BEAR)和绿色(BULL)箭头 BoS通常发生在价格决定性地穿过之前价格行动所建立的摆动低点或摆动高点时。当价格高于波动高点或低于波动低点时,它们只是打破了之前形成的市场结构,因此被称为“打破”结构。这通常表明市场情绪和趋势方向的变化,表明现有趋势的延续或新趋势的开始。 通常,为了提高关闭准确性,建议不设置止损和止盈,结束位置一般在相同方向的下一个突破点位置   关闭 ,或者是在反方向的突破点关闭 当您获得某个品种   足够 交易的经验时,你可以使用SL=7*TP的比率, 对于外汇符号,设置TP=500(5美元/最低交易量),SL=3500(35美元 /最低交易量 );单位点数POINTS。 对于 Volatility 75 Index 指数符号,设定TP=500000(5美元 /最低交易量 ),SL=3500000(35美元 /最低交易量 )
ChangePeriod MT5
Kazuya Yamaoka
You can change the time period of the chart at the touch of a button. You can also change multiple charts at the touch of a button. You can also change multiple charts at the touch of a button,   saving you the trouble of changing time periods. We are live-streaming the actual operation of the system. Please check for yourself if it is usable. Please check it out for yourself. https://www.youtube.com/@ganesha_forex We do not guarantee your investment results. Investments should be made at you
我们的   Basic Support and Resistance   指示器是提高技术分析所需的解决方案。该指标允许您在图表/ MT4版本 功能 斐波那契水平的集成: 可以选择显示斐波那契水平以及支持和阻力水平,我们的指标使您对市场行为和可能的逆转区域有更深入的了解。 性能优化: 只能在每个栏的打开时更新扩展线,我们的指标可确保最佳性能,而无需牺牲支持和阻力级别的准确性。 输入 主设置 Timeframe:   通过此输入,您可以选择在图表上显示较高时间范围的支撑线和阻力线。 Support/Resistance Strength [Number of Bars]:   使用此输入,您可以确定支撑和电阻的强度。数量越高,支持/阻力越强。 Price mode:  此参数允许您选择哪种价格将用于计算支持和电阻水平。它可以是收盘价,最高价格,最低价格等。取决于您的策略和偏好,您可以选择最适合您需求的价格。 显示设置 Display Fibonacci levels:   此参数确定是否将显示斐波那契水平以及图表上的支持和电阻级别。斐波那契水平是技术分析中使用的关键水平,并使用斐
PivotWave
Jeffrey Quiatchon
Introducing PivotWave – your ultimate trading companion that redefines precision and market analysis. Designed with traders in mind, PivotWave is more than just an indicator; it’s a powerful tool that captures the pulse of the market, identifying key turning points and trends with pinpoint accuracy. PivotWave leverages advanced algorithms to provide clear visual signals for optimal entry and exit points, making it easier for traders to navigate volatile market conditions. Whether you are a begin
This indicator presents an alternative approach to identify Market Structure. The logic used is derived from learning material created by   DaveTeaches (on X) Upgrade v1.10: + add option to put protected high/low value to buffer (figure 11, 12) + add  Retracements  value to buffer when Show Retracements When quantifying Market Structure, it is common to use fractal highs and lows to identify "significant" swing pivots. When price closes through these pivots, we may identify a Market Structure S
Monitor your order
Eslam Mohamed Hassanein Hassan Aly
Advanced Lot & Profit Monitor PRO is a powerful MT5 indicator that provides real-time monitoring of your trading positions directly on the chart. It displays the number of orders, total lot sizes, and profit (including swap) for Buy and Sell positions separately, as well as the overall account performance. Designed with a clean and customizable interface, this tool helps traders stay in control of their exposure and risk at all times. Key Features: Real-time monitoring of open positions Sepa
Cumulative Volume Delta MA-X MTF(带梯度动量) 该指标为 MetaTrader 5 提供多时区累积成交量德尔塔(CVD)分析。它通过分析报价成交量(Tick Volume)或真实成交量(Real Volume)数据,计算买盘与卖盘压力之间的净差值,从而直观地展示订单流(Order Flow)情绪。 指标逻辑与特性 本指标采用数学方法进行成交量分析: 数据来源 :支持交易所资产的 真实成交量 (Real Volume) ,以及针对外汇/CFD 市场的 OHLC 影线代理算法 (OHLC Wick Proxy) 。 梯度系统 :4 色移动平均线用于识别趋势阶段: 深天蓝 (DeepSkyBlue) :数值为正且正在上升。 橙色 (Orange) :数值为正但正在下降。 洋红色 (Magenta) :数值为负且正在下降。 紫色 (Purple) :数值为负但正在上升。 五层共振系统 (5-Layer Confluence System) 指标集成了五种不同的分析方法: 第一层:成交量德尔塔核心 (Volume Delta Core) —— 计算成交量德尔塔的
Crash 1000 Scalping Indicator for the Crash 1000 Deriv Synthetic Index. Introduction The Crash 1000 Scalping Indicator is a specialized tool designed for the Crash 1000 index on the Deriv Synthetic market. This indicator is particularly useful for scalping on the M1 timeframe, helping traders to identify precise entry and exit points for buy positions. It is designed to be non-repainting, providing clear signals with audible alerts and push notifications, and is compatible with mobile devices th
该产品的买家也购买
Neuro Poseidon MT5
Daria Rezueva
4.98 (43)
Neuro Poseidon is a new indicator by Daria Rezueva. It combines precise trading signals with adaptive TP/SL levels - creating best possible trades as a result! Message me and get  Neuro Poseidon Assistant  as a gift to automize your trading process! What makes it stand out? 1. Proven profitability on all assets and timeframes 2. Only confirmed BUY and SELL signals present on the chart 3. Adaptive TP & SL levels generated by the software for each trade 4. Easy to understand - suitable for al
SuperScalp Pro
Van Minh Nguyen
4.67 (27)
SuperScalp Pro – 高级多重过滤剥头皮指标系统 SuperScalp Pro 是一款高级剥头皮交易指标,将经典 Supertrend 与多种智能确认过滤器结合,帮助识别交易机会。它可高效运行于 M1 至 H4 多个时间周期,并针对 XAUUSD、BTCUSD 及主要外汇货币对进行了优化。 该指标提供清晰的 Buy 和 Sell 信号,并基于 ATR 自动计算入场价、止损和止盈水平,帮助交易者更有效地管理风险。Fibonacci Take Profit 功能可在关键价格水平提前平仓,并在到达这些水平时发送通知,从而提升交易管理效率与稳定性。 默认配置已启用 Fibonacci Take Profit,专注于更稳定、更持续的交易体验。您只需将指标加载到图表即可立即开始使用,无需额外设置。对于高级用户,所有参数均可完全自定义,以适应不同交易策略和偏好。 完整使用文档可在产品博客查看: [User Guide] 支持通过 SuperScalp Pro Auto Trader EA 进行自动交易: [Auto Trader] SuperScalp Pro 集成了 EMA、RSI
SMC Intraday Formula
Kareem Abbas
5 (15)
让我们先坦诚一点。 没有任何一个指标可以单独让你实现盈利。如果有人告诉你可以,那他是在向你兜售一个梦想。任何显示完美买卖箭头的指标都可以被做得看起来毫无瑕疵——只需要放大历史中的某一段并截取成功交易的截图。我们不会这样做。 SMC Intraday Formula 是一个工具。 它为你读取市场结构,标记出概率最高的价格区域,并用简单直白的语言准确告诉你当前智能资金的行为轨迹。你仍然需要做决定。你仍然需要执行交易。但现在,你是带着精确性执行,而不是靠希望。 我们已经在黄金(XAUUSD)以及主要外汇货币对的日内剥头皮交易中使用该指标将近三年。这是我们在 M1、M5、M15 和 M30 上的日常主力工具。它之所以有效,是因为它不试图预测未来——它展示的是当前正在形成的高概率交易机会,并解释 为什么 。 它与其他所有指标有什么不同? 大多数交易指标只做一件事。移动平均线交叉。振荡指标触及某个水平。出现一个箭头。你进场交易。你亏损。你责怪指标。重复。 SMC Intraday Formula 将多个机构级概念整合为一个统一的市场解读: - 斐波那契共振引擎 不只是普通的斐波那契水平——该指标
本产品已针对 2026 年市场进行更新,并针对最新 MT5 版本进行了优化。 价格更新通知: Smart Trend Trading System 目前价格为 $99 。 接下来的 30 次购买 后,价格将上涨至 $199 。 特别优惠: 购买 Smart Trend Trading System 后,请发送私信给我,即可免费领取 Smart Universal EA ,并将您的 Smart Trend 信号转换为自动交易。 Smart Trend Trading System 是一套完整的交易系统,具备不重绘、不回绘、不延迟的特点,专为希望获得更清晰信号、更准确趋势方向以及更有组织交易方式的交易者打造。 Online course , manual and download presets . 它将 10 多种交易工具 整合到一个系统中,包括趋势检测、反转区域、Smart Cloud、移动止损逻辑、支撑与阻力、K线着色、提醒以及多周期分析。 该系统旨在帮助您应对不同的市场环境: 趋势市场: 识别主要趋势,发现回调,跟随动能,并通过止损指导和移动止损选项寻找更清晰的入场机会。 震荡
Entry In The Zone and SMC Multi Timeframe is a real-time 2-in-1 market analysis tool that combines market structure analysis and a No Repaint BUY / SELL signal system into a single indicator, built on Smart Money Concepts (SMC) — a widely adopted framework used by professional traders to understand market structure. This indicator helps you see the market more clearly, make decisions based on structure rather than guesswork, and focus on high-probability zones where price is more likely to react
Trend Catcher ind mt5
Ramil Minniakhmetov
5 (6)
趨勢捕捉指標 趨勢捕捉指標結合了作者獨有的客製化自適應趨勢分析指標,用於分析市場價格趨勢。它透過過濾掉短期噪音,並專注於潛在的動能強度、波動性擴張和價格結構行為,來識別真實的市場方向。此外,它還結合了平滑和趨勢過濾等客製化指標,例如移動平均線、相對強弱指標 (RSI) 和波動率過濾器。 您可以在這裡查看實際運行情況以及我的其他產品: https://www.mql5.com/en/users/mechanic/seller 請注意,我不會在 Telegram 上出售 EA 或任何設置,那是騙局。所有設定都可以在我的部落格上免費取得。 重要提示!購買後請立即聯繫我,以獲取使用說明和額外獎勵! 請注意,我不會在 Telegram 上出售 EA 或任何設置,那是騙局。所有設定都可以在我的部落格上免費取得。
Quantum TrendPulse
Bogdan Ion Puscasu
5 (25)
介绍 Quantum TrendPulse   ,这是一款终极交易工具,它将 SuperTrend   、   RSI 和 Stochastic 的强大功能整合到一个综合指标中,以最大限度地发挥您的交易潜力。该指标专为追求精准和效率的交易者而设计,可帮助您自信地识别市场趋势、动量变化以及最佳进入和退出点。 主要特点: 超级趋势整合: 轻松跟随当前的市场趋势并乘上盈利浪潮。 RSI 精度: 检测超买和超卖水平,非常适合把握市场逆转时机,可用作 SuperTrend 的过滤器 随机精度: 利用随机振荡在波动的市场中寻找隐藏的机会, 用作超级趋势的过滤器 多时间范围分析: 从 M5 到 H1 或 H4,在不同时间范围内关注市场动态。 可定制的警报: 当您的自定义交易条件得到满足时收到通知,这样您就不会错过任何交易。 无论您是新手还是经验丰富的交易员,   Quantum TrendPulse 都能为您提供所需的优势,帮助您增强策略并自信地进行交易。借助这一强大的指标,将洞察力转化为利润 — 掌控您的交易! ***购买 Quantum TrendPulse,即可免费获得 Quantum Tr
Divergence Bomber
Ihor Otkydach
4.9 (90)
购买该指标的每位用户将额外免费获得以下内容: 原创工具“Bomber Utility”,该工具会自动跟踪每一笔交易,设置止损和止盈点,并根据策略规则自动平仓; 适用于不同交易品种的指标设置文件(Set 文件); 三种不同风险模式下的 Bomber Utility 设置文件:“最低风险”、“平衡风险” 和 “观望策略”; 一套详细的 视频操作手册,帮助您快速完成安装、配置并开始使用本交易系统。 注意: 要获取以上所有赠品,请通过 MQL5 的私人消息系统联系卖家。 我为您介绍原创的自定义指标 “Divergence Bomber”(背离轰炸机),它是一套基于 MACD 背离交易策略 的“全功能”交易系统。 该技术指标的主要任务是识别 价格与 MACD 指标之间的背离,并发出交易信号(包括推送通知),指示未来价格可能的运动方向。平均而言,这些信号的准确率超过 98%。有关该指标如何工作的详细说明,请观看本页面上的视频演示。 该系统使用 止损订单 和 动态回撤平仓机制 来管理交易。 Divergence Bomber 指标的主要特点: 支持交易的品种: AUDCAD、AUDCHF、AUDSG
PrimeScalping
Temirlan Kdyrkhan
PrimeScalping is a powerful trading companion designed to generate high-probability entry signals with dynamic TP/SL/DP levels based on volatility. Built-in performance tracking shows win/loss stats, PP1/PP2 hits, and success rates — all updated live. Key Features: Buy/Sell signals with adaptive volatility bands Real-time TP/SL/DP levels based on ATR Built-in MA Filter with optional ATR/StdDev volatility Performance stats panel (Success, Profit/Loss, PP1/PP2) Alerts via popup, sound, push, or e
Power Candles MT5
Daniel Stein
5 (8)
Power Candles V3 - 自我优化的强度指标 Power Candles V3 把货币与品种的强度直接转化为图表上可执行的交易方案。指标不再仅根据强度给K线着色,而是在后台持续运行实时自动优化,为您正面对的品种给出最佳 Stop Loss、Take Profit 与信号阈值。一键采用,Entry、Stop Loss、Take Profit 线就以精确价格绘制在图表上,提醒消息中直接包含方向。 本工具是 Stein Investments 生态系统的一部分 - 18+ 款工具,加上 Max,您的一对一 AI 交易导师。  随时在线,深入了解每一款指标,在您需要梳理思路的那一刻就在那里。  立即认识他: https://stein.investments 每根收盘K线运行 3,000+ 次交易模拟。9 种强度状态。2 种策略并行测试。一键采用最优配置。 为什么需要这个 大多数强度指标只给您一个数值,然后留下三个问题:相信哪个阈值、用哪个 Stop Loss、走哪个交易方向。Power Candles V3 在每根收盘K线上自动回答这些问题。结果就是一个完整的交易方案 -
FX Trend MT5 NG
Daniel Stein
5 (6)
FX Trend NG:新一代多市场趋势智能分析工具 概述 FX Trend NG 是一款专业的多时间周期趋势分析与市场监控工具,帮助您在几秒钟内全面了解市场结构。 无需在多个图表之间来回切换,您可以立即看到哪些品种处于趋势中、哪里动能正在减弱,以及哪些时间周期之间存在强烈共振。 限时发布优惠 – 仅需 $30(6个月) 或 $80 终身授权 即可拥有 FX Trend NG 。 已经是 Stein Investments 客户? -> 发送消息 以获取专属客户群访问权限。 需要帮助或安装指导? -> 请访问 Stein Investments 官方页面 。 1. FX Trend NG 的核心优势 三状态趋势逻辑 —— 不只是 Buy 或 Sell • 大多数指标仅显示两种状态:Buy 或 Sell。 • FX Trend NG 增加第三种状态: Fade 。 • Fade 表示趋势强度正在减弱,在完全反转之前提前发出信号。 这种结构化逻辑让您看到趋势变化过程,而不仅仅是简单方向信号。 多时间周期分析(M1 至 MN1) • 从短线交易到中长线交易全面覆盖。 • 快速识别趋势
Gann Made Easy MT5
Oleg Rodin
5 (6)
Gann Made Easy   是一个专业且易于使用的外汇交易系统,它基于使用先生理论的最佳交易原则。 W.D.江恩。该指标提供准确的买入和卖出信号,包括止损和获利水平。您甚至可以使用推送通知在旅途中进行交易。 购买后请联系我,即可免费获得交易指导和超棒的额外指标! 您可能已经多次听说过江恩交易方法。通常 Gann 的理论不仅对于新手交易者而且对于那些已经有一定交易经验的人来说都是非常复杂的东西。这是因为江恩的交易方法在理论上并不那么容易应用。我花了几年时间来完善这些知识,并将最好的原则应用到我的外汇指标中。 该指标非常易于应用。您所需要的只是将其附加到您的图表并遵循简单的交易建议。该指标不断进行市场分析工作并寻找交易机会。当它检测到一个好的入口点时,它会为您提供一个箭头信号。该指标还显示止损和获利水平。 换句话说,当您像先生一样进行交易时,该指标会为您提供最佳江恩建议。江恩亲自告诉你此时此刻该做什么。但最好的部分是您不需要了解任何有关江恩交易原则的知识,因为该指标会为您完成整个市场分析工作。
Atomic Analyst MT5
Issam Kassas
4.26 (35)
本产品已针对 2026 年市场进行更新,并针对最新 MT5 版本进行了优化。 价格更新通知: Atomic Analyst 目前价格为 $99 。 接下来的 30 次购买 后,价格将上涨至 $199 。 特别优惠: 购买 Atomic Analyst 后,请发送私信给我,即可免费领取 Smart Universal EA ,并将您的 Atomic Analyst 信号转换为自动交易。 Atomic Analyst 是一款不重绘、不回绘、不延迟的 Price Action 交易指标,专为手动交易、清晰信号和 EA 自动化而设计。 User manual: settings, inputs and strategy. 它分析价格行为、强度、动能、多周期方向和高级过滤器,帮助交易者减少噪音,避免弱势交易机会,并做出更有结构的交易决策。 该指标将复杂的市场计算转换为简单的视觉信号、彩色K线、趋势读数、止损水平和多个止盈区域,使交易者能够快速理解并应用于真实市场环境。 主要交易用途: 剥头皮和日内交易: 专为快速决策、清晰箭头、提醒、K线颜色和结构化进出场区域而设计。 日内交易和波段交易:
M1 Quantum MT5
Hamed Dehgani
5 (3)
开发者说明: 仅剩 1 个许可证 可享受 129 美元 的价格。售出后,价格将上涨至 149 美元 。 M1 Quantum 是一款专业的 M1 交易系统,提供快速且精准的交易信号,并内置止损(Stop Loss)、止盈(Take Profit)以及智能资金管理功能。 M1 Quantum 包含专业的资金管理系统,通过专注于 连续盈利交易 ,帮助交易者更快地增长账户资金。 M1 Quantum 指标 的主要特点 专为 M1 时间周期 和所有 主要货币对 设计 所有交易均配备止损和止盈 内置 资金管理功能 ,并指导交易者轻松执行交易计划 高胜率,高比例的 连续盈利交易 无重绘,无延迟 适合各种类型的交易者,简单易懂 要使用 M1 Quantum ,您需要 M1 Quantum Assistant 。这款强大的工具对所有 M1 Quantum 用户 免费提供 。 下载 M1 Quantum Assistant 加入我的 MQL5 频道 ,获取最新更新和新产品发布信息。 价格将在下周上涨至149美元。
本产品已针对 2026 年市场进行更新,并针对最新 MT5 版本进行了优化。 价格更新通知: Smart Price Action Concepts 目前价格为 $200 。 接下来的 30 次购买 后,价格将上涨至 $299 。 特别优惠: 购买后,请发送私信给我,即可领取 免费赠品 + 礼物 。 首先需要强调的是,这款交易工具是不重绘、不回绘、不延迟的指标,因此非常适合专业交易使用。 Online course , and manual Smart Price Action Concepts 指标是一款非常强大的工具,适合新手和有经验的交易者使用。它将 20 多个实用指标整合到一个系统中,结合了 Inner Circle Trader Analysis 和 Smart Money Concepts Trading Strategies 等高级交易理念。该指标专注于 Smart Money Concepts,帮助交易者理解大型机构如何交易,并辅助预测其市场行为。 它特别擅长流动性分析,使交易者更容易理解机构交易逻辑。它也非常适合预测市场趋势并仔细分析价格走势。通过让交易与机构策略保
Market Structure Order Block Dashboard MT5 是一款专为希望直接在图表上解读市场结构和主要价格反应区域的交易者设计的MT5指标。它结合了BOS、ChoCH、订单块(Order Blocks)、公允价值缺口(FVG)、流动性、Kill Zones、成交量分布图以及一个紧凑的面板,便于快速分析。 本指标面向使用市场结构、ICT和Smart Money概念作为决策框架的交易者。它可以帮助以更结构化的方式识别趋势延续、可能的反转、价格失衡、流动性目标和关注区域。 面向买家的资源 购买后可通过MQL5私信申请获取完整的PDF使用指南和参数配置建议。通过MQL5私信提供直接技术支持。 1.20版本带来两项重要新增: Pending BOS / Pending ChoCH 检测 和 可拖动面板 (按住面板标题栏即可将其拖动到图表任意位置,不影响图表本身)。当K线收于前一摆动点之外时,Pending Breaks 立即显示待确认的结构突破,无需等待经典的摆动确认。 重要 本产品仅为指标。它不会自动开仓、平仓或管理仓位。它不是EA(智能交易系统)。 主要功能 市场
ARIPoint
Temirlan Kdyrkhan
1 (1)
ARIPoint is a powerful trading companion designed to generate high-probability entry signals with dynamic TP/SL/DP levels based on volatility. Built-in performance tracking shows win/loss stats, PP1/PP2 hits, and success rates all updated live. Key Features: Buy/Sell signals with adaptive volatility bands Real-time TP/SL/DP levels based on ATR Built-in MA Filter with optional ATR/StdDev volatility Performance stats panel (Success, Profit/Loss, PP1/PP2) Alerts via popup, sound, push, or email Cu
Azimuth Pro
Ottaviano De Cicco
5 (7)
Azimuth Pro V2:MT5合成分形结构分析与确认入场 概述 Azimuth Pro 是 Merkava Labs 推出的多层级波段结构指标。四层嵌套波段层级、锚定波段的VWAP、ABC形态识别、三时间框架结构过滤以及收盘确认入场——一个图表,一个从微观波段到宏观周期的完整工作流程。 这不是盲目的信号产品。它是一个以结构为先的工作流程,专为重视位置、背景和时机的交易者打造。 V2上市优惠 — Azimuth Pro V2售价USD 399(接下来的100份)。最终价格:USD 499。 1. V2的变化 合成多时间框架引擎 高时间框架分析从零开始重建,采用与Meridian Pro相同的专有合成架构。更清晰的HTF背景、稳定的实时行为、无经典MTF同步问题。合成引擎还解锁了 固定比率时间框架级联 (x2、x3、x4、x6)——不再在经纪商的固定时间框架之间任意跳转,您可以按图表时间框架的固定倍数分析结构,在每个尺度上保持相同的分形关系。 确认入场箭头 作为稳定且可恢复的执行层而设计的收盘确认箭头。当ABC设置形成且自适应确认逻辑在收盘K线上验证方向时,箭头会写入下一根K线的
Gem SIGNAL
Shengzu Zhong
5 (1)
GEM Signal Pro GEM Signal Pro 是一款適用於 MetaTrader 5 的趨勢跟隨指標,專為希望在圖表上獲得更清晰訊號、更有結構的交易設定,以及更實用風險管理的交易者而設計。 它不僅僅顯示一個簡單的箭頭,GEM Signal Pro 還能以更清晰、更易讀的方式呈現完整的交易思路。當條件確認完成後,指標可在圖表上顯示進場價、止損價與止盈目標,幫助交易者更有效率地評估交易設定。 運作方式 該指標首先根據其內部邏輯識別有效的初始訊號。 當確認條件滿足後,GEM Signal Pro 會在圖表上顯示完整的交易設定。這讓交易者可以更清楚地看到交易結構,並減少手動分析與計算的工作量。 圖表上的交易價位 對於已確認的訊號,GEM Signal Pro 可顯示: 進場價 止損價 止盈 1 止盈 2 止盈 3 風險報酬比 這讓交易設定更容易理解,也有助於讓圖表分析更有條理。 內建風險管理 風險管理是此指標設計的重要部分。 止損位基於近期市場結構,結合附近的擺動高低點與可選的 ATR 緩衝距離。這能讓交易價位更貼近當前市場條件,而不只是依賴固定距離。 圖表資訊面板 GEM Si
Crystal Heikin Ashi Signals
Muhammad Jawad Shabir
5 (2)
Crystal Heikin Ashi Signals - Professional Trend & Signal Detection Indicator Advanced Heikin Ashi Visualization with Intelligent Signal System for Manual & Automated Trading Final Price: $149 ---------> Price goes up $10 after every 10 sales . Limited slots available — act fast . Overview Crystal Heikin Ashi Signals is a professional-grade MetaTrader 5 indicator that combines pure Heikin Ashi candle visualization with an advanced momentum-shift detection system. Designed for both manual traders
Reversion King Indicator
Eugen-alexandru Zibileanu
5 (4)
全新王者降临 - 指标 + 订单管理提示(TP1 + TP2 + TP3)+ 可选 Telegram 信号发送器 INCLUDED(免费) (完整交易与信号系统) 我们最强的黄金 EA: Gold Slayer 该指标包含先进的交易策略、可自定义订单管理系统,以及结合 Envelope 扩展的均值回归系统,并通过 RSI 等多重智能确认过滤器进行验证,以捕捉高概率反转入场机会,提供 BUY 与 SELL 信号。 你不仅能够学习如何交易,还能学会如何高效管理多个仓位,并利用之前盈利的持仓来覆盖亏损交易。 专为 M5 周期打造并优化,在 BTCUSD 和 XAUUSD 上表现尤为出色,因为这些市场的流动性能够让信号更加干净、可靠。 该指标会自动生成清晰的多头(Long)与空头(Short)信号,同时基于 ATR 自动计算入场位、止损位和止盈位,让风险管理从一开始就融入系统之中。 多 TP 系统设有三个渐进式目标位,你可以在 TP1 锁定部分利润、在 TP2 继续持仓,并在更大的行情中将仓位持有至 TP3,而这正是平均风险回报比真正开始大放异彩的地方。 默认参数开箱即用,已经针对稳定表现进行
KURAMA GOLD SIGNAL PRO(MT5)— 7层过滤 · 自动止盈止损 · 质量评分 · 信号历史保存 | 完整的XAUUSD交易系统 实时不重绘。信号出现的瞬间,箭头、入场、止盈、止损当场锁定,之后绝不移动。你交易的就是这个实时信号。而且在v7.20中,每一个真正发出的信号都会自动保存,并在重启后精确还原。 购买者专属赠品 购买永久授权,即可免费获得 AI Zone Radar(价值$59)+ 完整PDF手册。在产品价格之外,额外附赠价值$59的赠品。购买后在MQL5上给我留言即可。 AI Zone Radar: https://www.mql5.com/en/market/product/175834 在黄金交易者社区中被实际使用,因精度与易用性而广受好评。 你的难题 —— 以及解决方案 黄金一天波动$30–$50。你知道机会就在那里。但这些情况是否似曾相识: - 入场太早,价格逆行$10后才朝你的方向
Quant Direction MT5
Georgios Kalomoiropoulos
Quant Direction 是一款三维市场分析工具。它通过同时计算多个维度上的精确百分比偏差,提供完全客观的、基于算法的市场分析视角。该算法采用先进的人工智能建模工具开发,并经过全面测试,旨在以独特的精准度解读市场。它可以分析您平台上的任何货币对或金融工具。 无论您是短线 交易者、日内 交易者还是波段交易者,Quant Direction 都是您的理想之选。 交易者的真正优势 Quant Direction 的真正优势在于彻底消除情绪、屏幕疲劳和过度思考。它无需手动点击十几个图表来寻找方向并反复质疑自己的偏好,引擎即可在几毫秒内即时处理 8 个时间周期(从 5 个月到月线)。它能准确告诉你任何时刻谁在掌控市场,确保你始终朝着概率最高的方向进行交易。 市场分析的三个维度 该算法将市场分为三个不同的交易维度,为您提供完整的宏观和微观视角: 超短线交易分析: 捕捉即时、快速的动量变化和较低时间框架的执行点。 日内分析: 识别真实的、潜在的每日方向性偏差。 波动分析: 专注于宏观趋势,确保您不会与大盘机构的走势背道而驰。 独家评分引擎 Quant Direction 的底层采用了一套
Grabber System MT5
Ihor Otkydach
4.83 (24)
向您介绍一款优秀的技术指标——Grabber,它是一套即开即用的“全包式”交易策略。 在一个代码中集成了强大的市场技术分析工具、交易信号(箭头)、提醒功能和推送通知。 每位购买该指标的用户还可免费获得以下内容: Grabber辅助工具:用于自动管理已开仓位 视频操作指南:逐步教学如何安装、设置和使用该指标进行交易 原创Set文件:可快速自动配置,帮助实现最佳交易效果 忘掉其他策略吧!只有Grabber能够真正激励你在交易中攀登新高峰! Grabber策略的主要特点: 交易周期:从M5到H4 适用资产:任意,但我推荐我亲自测试过的品种(GBPUSD、GBPCAD、GBPCHF、AUDCAD、AUDUSD、AUDSGD、AUDCHF、NZDUSD、NZDCAD、EURCAD、EURUSD、EURAUD、EURGBP、EURCHF、USDCAD、USDSGD) 交易时间:全天候 24/7 交易效果:我分享自己的真实交易结果,并在此教学如何操作: https://www.mql5.com/ru/market/product/134563?source=Site+Market+MT5+Indic
介绍     Quantum Breakout PRO   ,突破性的 MQL5 指标,正在改变您交易突破区域的方式!由拥有超过13年交易经验的资深交易员团队开发,     量子突破 PRO     旨在通过其创新和动态的突破区域策略将您的交易之旅推向新的高度。 量子突破指标将为您提供带有 5 个利润目标区域的突破区域的信号箭头,以及基于突破框的止损建议。 它既适合新手交易者,也适合专业交易者。 量子 EA 通道:       点击这里 重要的!购买后请私信我领取安装手册。 建议: 时间范围:M15 货币对:GBPJPY、EURJPY、USDJPY、NZDUSD、XAUUSD 账户类型:ECN、Raw 或 Razor,点差极低 经纪商时间:GMT +3 经纪商:IC Markets、Pepperstone with Raw 和 Razor 的点差最低 规格: 不重漆! 最多 5 个建议利润目标区域 建议止损水平 可定制的盒子。您可以设置自己的 Box Time Start 和 Box Time End。 接触 如果您有任何疑问或需要帮助,请通过私人消息与我联系。
SmartScalping
Temirlan Kdyrkhan
SmartScalping is a powerful trading companion designed to generate high-probability entry signals with dynamic TP/SL/DP levels based on volatility. Built-in performance tracking shows win/loss stats, PP1/PP2 hits, and success rates — all updated live. Key Features: Buy/Sell signals with adaptive volatility bands Real-time TP/SL/DP levels based on ATR Built-in MA Filter with optional ATR/StdDev volatility Performance stats panel (Success, Profit/Loss, PP1/PP2) Alerts via popup, sound, push, or e
RelicusRoad Pro MT5
Relicus LLC
4.96 (24)
RelicusRoad Pro: 量化市场操作系统 终身访问限时 70% 折扣 - 加入 2,000+ 交易员社区 为什么大多数交易者即使拥有“完美”指标也会失败? 因为他们在真空中交易 单一概念 。没有背景的信号是赌博。要持续获胜,您需要 共振 (CONFLUENCE) 。 RelicusRoad Pro 不是一个简单的箭头指标。它是一个完整的 量化市场生态系统 。它描绘价格运行的“公允价值之路”,区分市场噪音和真实的结构性突破。 停止猜测。开始用机构级“路”逻辑进行交易。 核心引擎:“Road” (路) 算法 系统的核心是 Road Algo ,一个实时适应市场条件的动态波动率通道。它投射出 安全线 (平衡) 和价格可能反转的 扩展水平 。 Simple Road: 典型市场的标准结构映射。 Smooth Road: 针对震荡盘整的降噪计算。 Breakout Road: 专为识别波动率扩张和爆发性走势而调整。 1. 算法动量与确认 我们的“剥头皮箭头”不只是简单的交叉。它们利用 高阶多项式逻辑 过滤噪音,确保信号与主周期一致。我们检测动量、价格行为和 Road 结构汇聚的精确入场
Smart Stop Indicator – 智能化止损逻辑,直接呈现在您的图表上 概述 Smart Stop Indicator 是为希望以清晰、系统、非情绪化方式设置止损的交易者量身打造的工具。它将经典的价格结构逻辑(更高的高点、更低的低点)与现代突破识别技术相结合,精准标记真正合理的止损位置。无论是趋势、盘整还是快速突破行情,指标都会在图表上直接显示最佳 SL 区域及其状态(“new”、“broken”、“valid”)并且现在新增 SL 与 %ADR 的距离显示。 亮点 基于市场结构的自动止损识别 • 根据市场结构与实时价格行为自动识别关键止损位置。 智能突破适应能力 • 能适应突破与快速方向变化,不会强迫过早调整止损。 SL %ADR 显示 • 显示止损距离占平均日波动范围 ADR 的百分比与 Smart Stop Scanner 完全一致帮助交易者即时识别紧密机会或已延伸的行情。 内置警报逻辑 • 当止损水平变为“new”、“valid”或“broken”时触发警报包含准确的状态切换与冷却逻辑。 破损级别的淡化显示 • 对于“broken”状态的方向、价格、S
This indicator automatically detects  internal & swing market structure, Breaker block, Strong Imbalance, Liquidity Void, Volume imbalance. Features Full internal & swing market structure labeling in real-time Breaker block Strong Imbalance Liquidity Void volume imbalance After purchasing the indicator, the full source code is provided, and via indicator buffers it can be easily integrated into your Expert Advisors (EAs) for automated trading strategies.
Gladiator Indicator: Conquer the Markets Step into the trading arena with the Gladiator Indicator, a robust and highly effective trading tool designed exclusively for MQL5. Built for traders who want clear, actionable insights, Gladiator cuts through market noise to deliver precise Buy and Sell signals right on your charts. Whether you are a beginner looking for guidance or an experienced trader seeking a reliable confirmation tool, Gladiator provides the edge you need to battle the markets wi
作者的更多信息
Candel color NASDAQ
Benyamin Naser Mokhtari Karchegani
Advancing in NASDAQ 100 Trading with the Smart "Candle Color" Indicator The indicator we offer is one of the good tools for trading in the NASDAQ 100 market, especially in the 1-minute and 5-minute timeframes. This indicator is designed with precision and scientific rigor and can also be used in other timeframes. All you need to do is activate it and leverage its power. Unique Features: Optimized Performance in 1-Minute and 5-Minute Timeframes: This indicator is specifically designed for these
Magic Moving AI
Benyamin Naser Mokhtari Karchegani
Magic Moving AI The Magic Moving AI indicator is one of the best tools for trading in the NASDAQ 100 market. This tool is specifically designed for the 1-minute and 5-minute timeframes and operates with high precision. You can easily activate this indicator and benefit from its advantages. Unique Features: Specialized Performance in 1-Minute and 5-Minute Timeframes: While this indicator is capable of working in other timeframes, its primary focus is on these two timeframes to deliver optimal re
Magic Nasdaq AI
Benyamin Naser Mokhtari Karchegani
发现纳斯达克100市场的高级交易机会,使用NASDAQ Smart Indicator。 NASDAQ Smart Indicator是一个用于纳斯达克100市场交易的强大且有效的工具。该指标专为1分钟和5分钟的时间框架设计,具有高精度和专业性。您可以轻松激活它并享受其带来的各种优势。 主要特点: 在1分钟和5分钟时间框架内的最佳表现 :此指标特别为这两个时间框架设计,以提供最佳的交易结果。虽然它也适用于其他时间框架,但主要关注1分钟和5分钟,这对交易者尤为重要。 与纳斯达克100策略兼容 :此指标是我们纳斯达克100策略的重要组成部分,帮助您识别适合的交易机会。 此指标在上线之前经过了一年的测试,并表现出令人满意的效果;但在使用此指标之前,用户应先进行回测并熟悉其功能。 振荡器结构 :NASDAQ Smart Indicator作为振荡器运行,并显示在图表下方的单独窗口中。这种结构使您可以轻松观察交易信号。 使用指南: 激活指标 :首先激活指标,确保它正确显示在您的图表上。 利用颜色信号 :注意直方图中的颜色变化,这些变化显示了交易信号。绿色直方图表示买入信号,而红色则提醒您是卖出信
Magic SL AI
Benyamin Naser Mokhtari Karchegani
The indicator now available to you is one of the best tools for trading in the NASDAQ 100 market, particularly in the 1-minute and 5-minute timeframes. This tool is designed with precision and can also be used for other timeframes. All you need to do is activate it. Key Features: Specialized Performance in 1-Minute and 5-Minute Timeframes: While this indicator can work in other timeframes, it delivers optimal results in these two timeframes. Compatibility with the NASDAQ 100 Secret Strategy: Th
Super Magic Moving Pro
Benyamin Naser Mokhtari Karchegani
*纳斯达克100“黄金指标”介绍!* 你是否在寻找一款强大的工具来提升你在纳斯达克100中的交易成功率?不必再犹豫!我们独家推出的指标经过两年对纳斯达克100走势的深入研究和分析,精心开发而成。 这个先进的移动平均线指标利用黄金分割、斐波那契水平和江恩角度,准确定位价格与移动平均线的交叉点。 *为什么选择这个指标?* - *简单设置:* 只需下载并运行,无需复杂配置! - *最佳性能:* 最适用于1分钟和5分钟的时间框架,同时在所有时间框架中均表现出色。 - *趋势强度检测:* 当一根强势蜡烛越过移动平均线时进入交易(确保蜡烛实体80%以上位于平均线之上)。 *“魔法策略”的一部分!*   该指标是纳斯达克100“魔法策略”的三大重要工具之一。它提供早期的交易入场信号,为了最大化收益,使用另外两个指标(在产品描述中提到)至关重要。 *超值优惠!*   目前该指标的价格远低于其实际价值。立即获取它,迈出通往财务成功的重要一步! Note : As you know, the demo version of any indicator or expert advisor ca
Super Magic NASDAQ100
Benyamin Naser Mokhtari Karchegani
您现在拥有的指标无疑是 在NASDAQ 100市场中 进行1分钟和5分钟交易的最佳工具之一。虽然它也适用于其他时间框架,但它是专门为这两个时间框架设计的。该指标设计精确, 无需初始设置 —只需运行它并信任它的信号。 准确性和效率 该工具经过严格校准,结合了多个 经过黄金比例优化 的指标,专门用于NASDAQ。它在过去一年中进行了严格的测试,并持续显示盈利能力。与市场上的许多指标不同,这个指标确实旨在支持您实现 持续的盈利交易 。 盈利性和投资回报 该指标的一大特点是其 快速的投资回报 。在几次成功交易之后,您投资于该工具的费用将迅速得到回报。该指标不仅提供 精确的入场信号 ,还帮助您在最佳时机退出,以最大化利润。 魔法三重策略NASDAQ 该指标是称为魔法三重策略NASDAQ 100的 三指标系统 的一部分。当前指标是 该策略的主要组成部分 ,为您提供实现自信交易所需的 准确性和精确性 。 如何使用及交易指南 要开始交易,首先从 Super Magic Moving Pro 获取 初始信号 。一旦第一根蜡烛完全穿越了 移动平均线 ,并且指标的直方图确认了颜色变化,那就是入场交易的理想时
筛选:
无评论
回复评论