PriceLevels LTF

Short Description

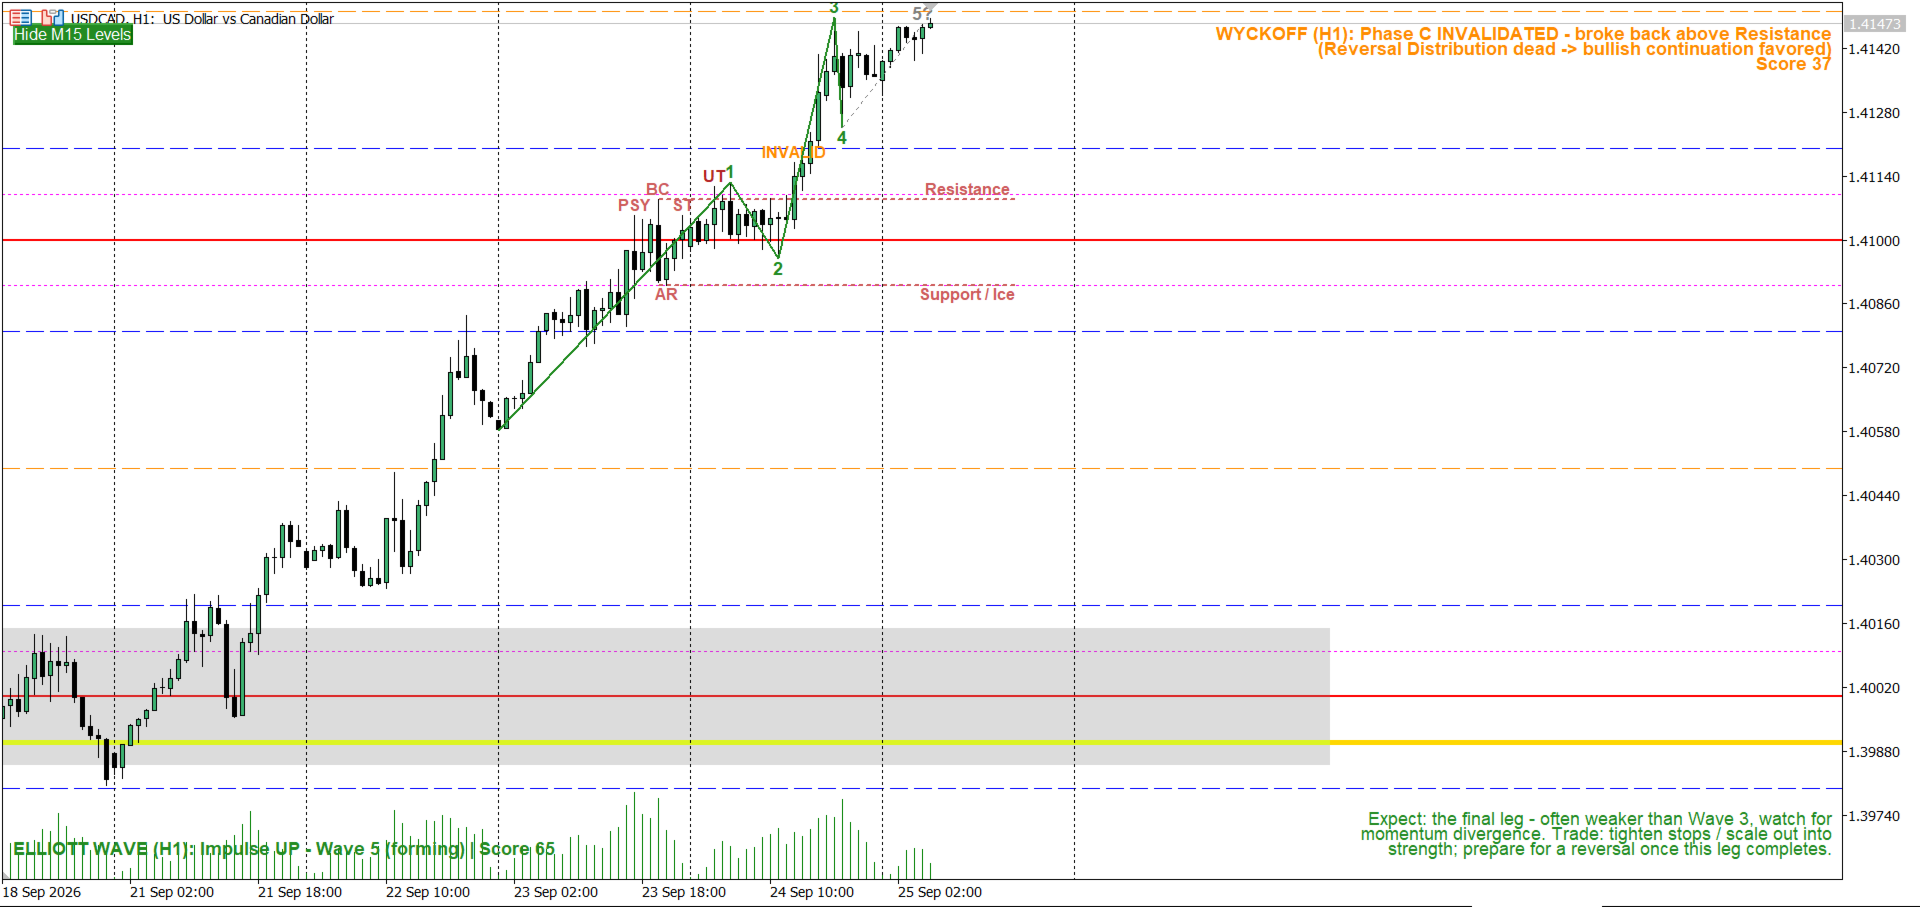
PriceLevel LTF is an all-in-one price-structure suite for the major Forex pairs: a round-number ("big figure") reaction grid — Wall, Hot Zone, Exit, Trap — layered with volume-profile confluence, HTF Monthly/Weekly key levels, a session liquidity-sweep/stop-hunt detector, dual liquidity heatmaps, and automatic Wyckoff Method and Elliott Wave phase detection. Built and tuned for the M15 timeframe. Updates in place with no flicker and refreshes instantly on new bars and fast price moves.

Full Description

Overview

This indicator started as a simple round-number grid and has grown into a full institutional price-structure toolkit, built specifically around standard Forex broker pip conventions (auto-adjusting for 3/5-digit pricing). Because the grid, key levels, and sweep detector are all built from that shared pip logic rather than any single pair's quirks, they work identically across the major Forex pairs — EUR/USD, GBP/USD, USD/JPY, USD/CHF, AUD/USD, USD/CAD, NZD/USD — with no manual recalibration per pair. This indicator is designed for the major Forex pairs; it is not intended for metals, indices, crypto, or exotic-pair use.

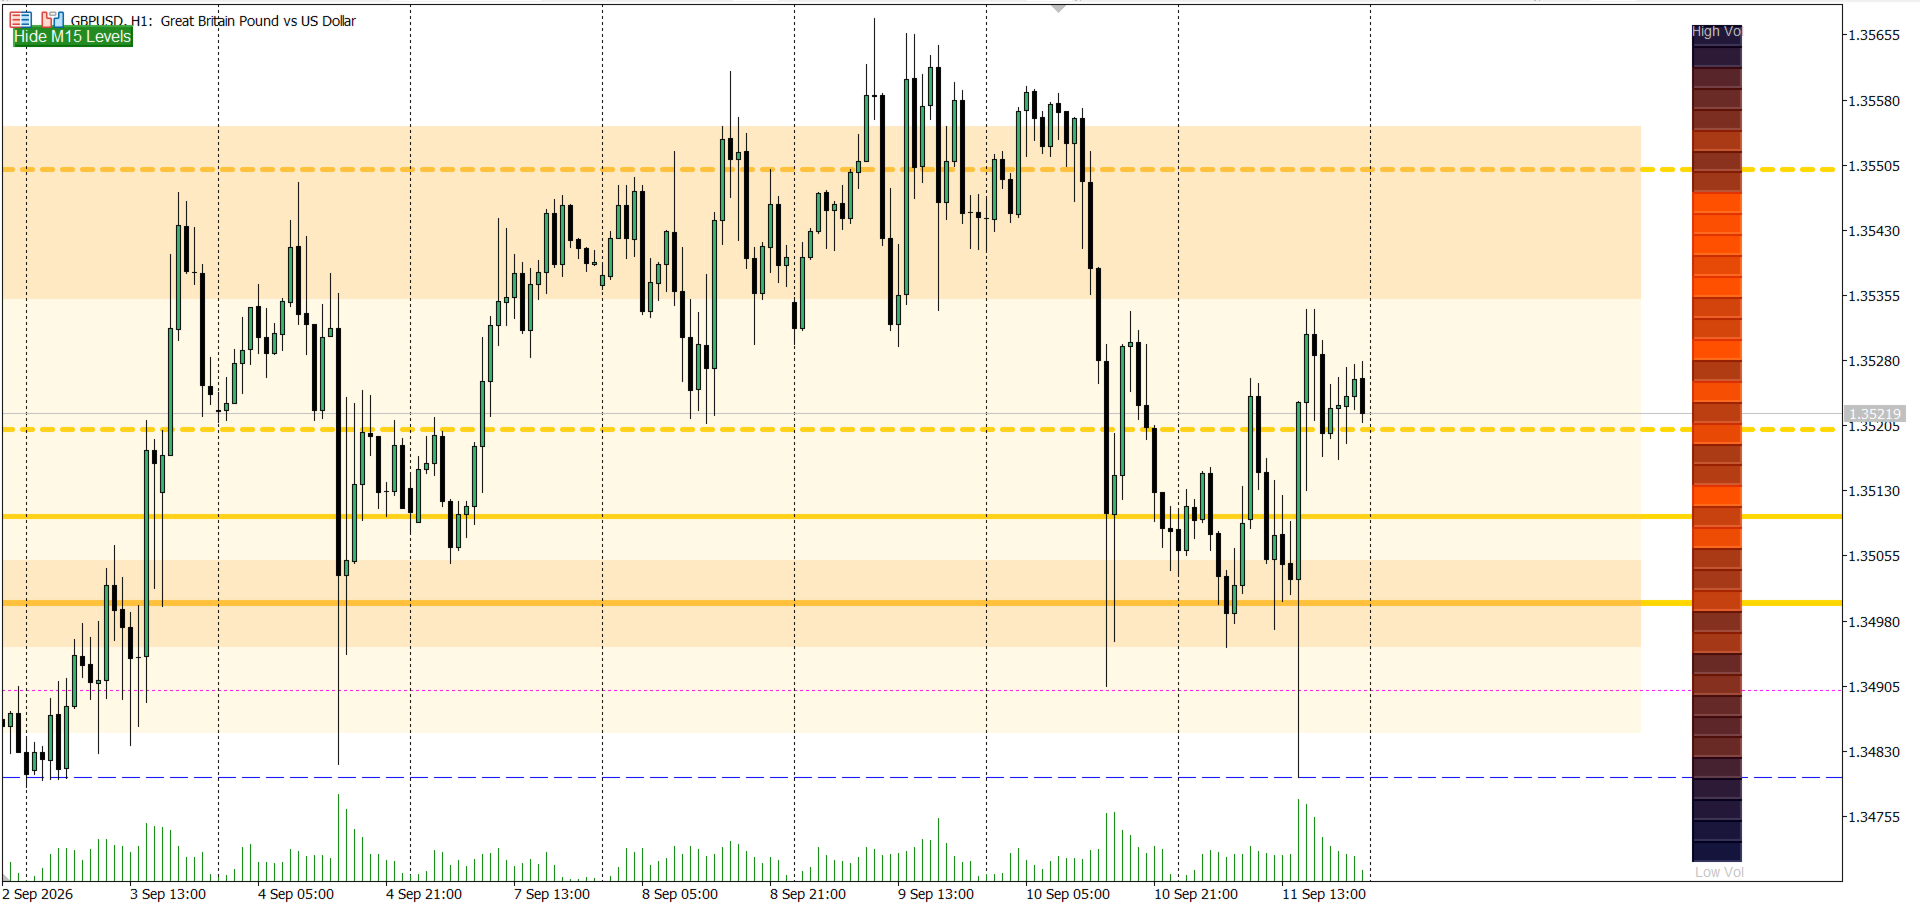
The core grid plots horizontal reference lines at 100-pip intervals, based on the idea that round numbers and near-round numbers tend to act as psychological reaction zones where stop hunts, liquidity grabs, and reversals commonly cluster:

  • .000 — The Wall: major round number, often a zone of rejection.
  • .200 / .800 — The Hot Zone: a common area to watch for entry confirmation.
  • .500 — The Exit: mid-level, often used as a partial take-profit reference.
  • .100 / .900 — The Trap: prone to fakeouts and stop hunts — a caution zone, not an entry signal.
  • Optional minor grid lines at every remaining .X00 level.

Everything else builds context around that grid: which levels line up with real volume, which sit at a higher timeframe's own key level, which just got swept and reclaimed, and where the broader wave/phase structure of the market currently stands.

Best timeframe

This indicator is built and tuned for the M15 chart — its session windows, sweep-reclaim logic, and default lookback settings are calibrated around 15-minute bars, and that's the timeframe it's most accurate and most tested on. It remains usable down to M5 and up to H4 for the grid, key-level, and sweep features. The Wyckoff and Elliott Wave detectors (below) are structure-based and will run on any timeframe, but read most reliably from M15 up to H4, where a full phase or wave cycle has enough bars to form cleanly — very low timeframes (M1) tend to produce noisier, faster-invalidating counts.

Feature set

Grid & core display

  • Feature 1 — Right-margin text labels combining level name, live metrics, and suggested action.
  • Feature 2 — Automatic pip/step scaling for correct spacing across all 3/4/5-digit major FX pairs.
  • Feature 3 — Configurable proximity alerts (popup/push/email) when price approaches a chosen level type.
  • Feature 4 — An on-chart Hide/Show toggle button for the whole grid.

Confluence & context

  • Feature 5 — Bounce/Break tracker: counts how many times each level has been respected vs. broken, shown right on the label.
  • Feature 6 — Volume-profile confluence: builds a lightweight session volume profile and highlights grid levels that sit on a genuine high-volume node (POC-relative), not just a round number.
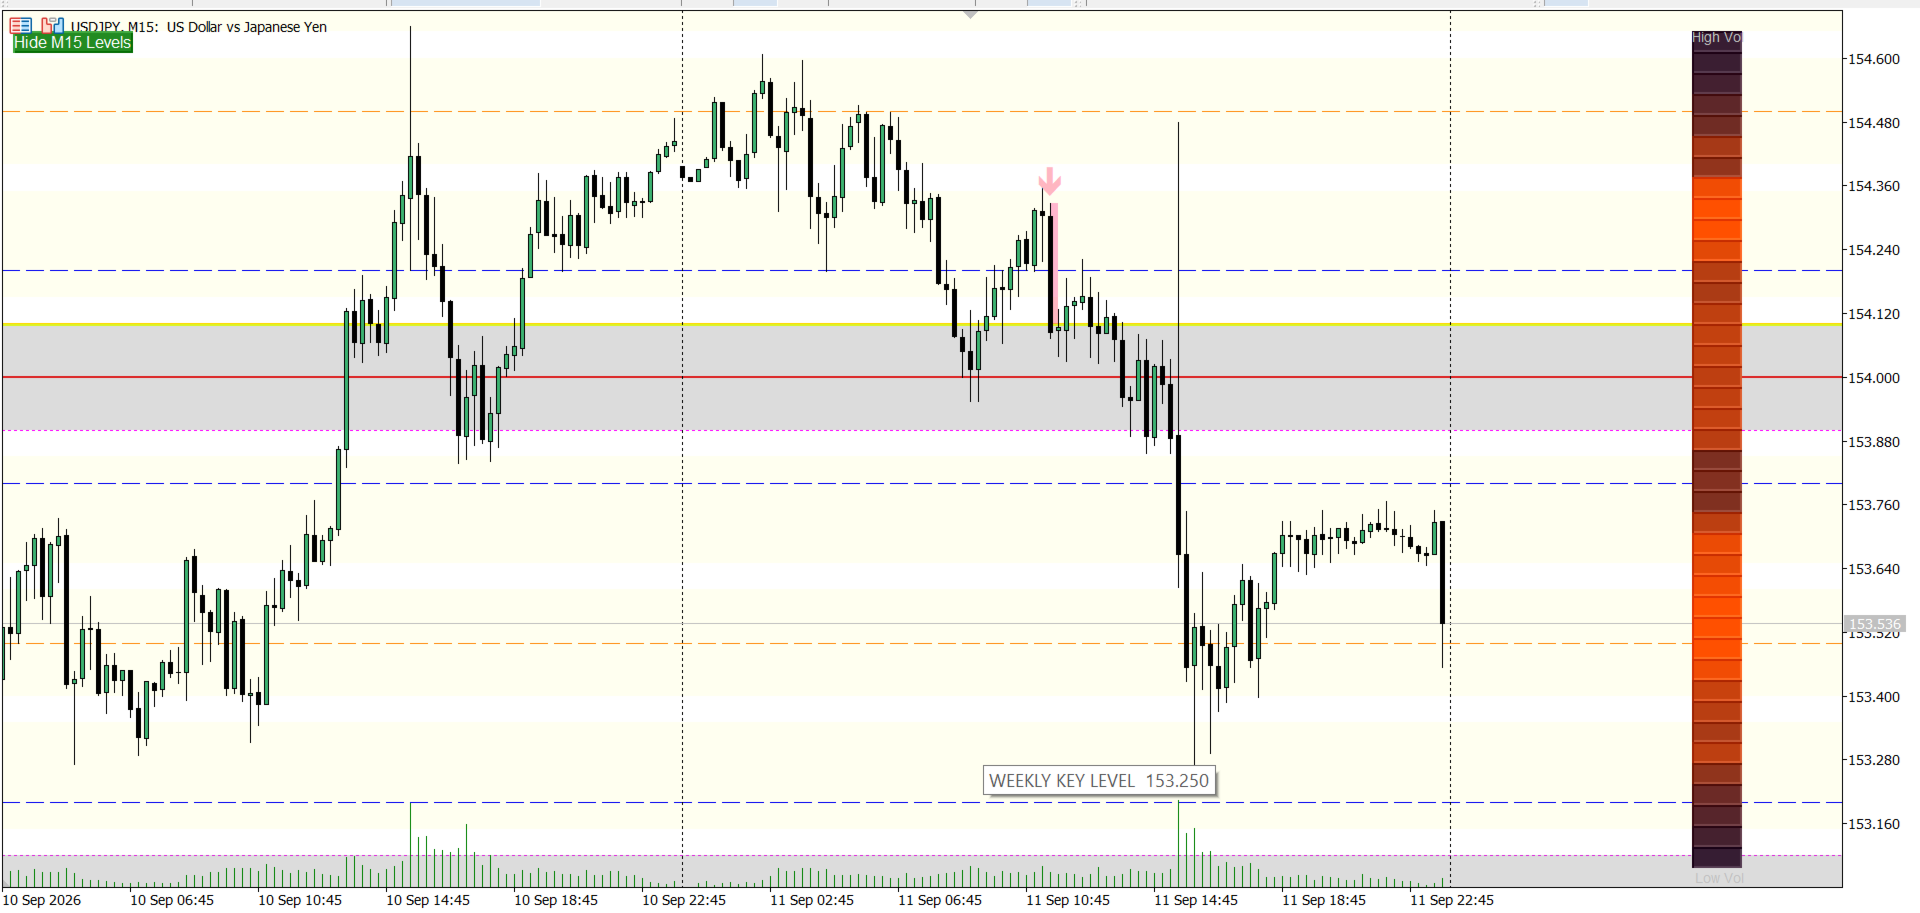
  • Feature 7 — Multi-timeframe institutional key levels: auto-detected (or manual) Monthly big-figure and Weekly quarter-figure zones drawn independently of the intraday grid.

Signal detection

  • Feature 8 — Session liquidity sweep / stop-hunt detector: watches configurable session windows (London/New York open, etc.) for a wick through a Trap level followed by a same-bar-or-N-bar reclaim, and marks it with a box and arrow. Ambiguous, two-sided (bilateral) sweeps are deliberately left undecorated rather than forced into a directional read.

Heatmaps

  • Feature 9 / 9b — Liquidity heatmap panel: a screen-anchored density strip built from tick volume, with an optional Daily/Weekly/Monthly range mode.
  • Feature 10 — Hybrid liquidity heatmap: blends tick-volume density with open-interest data from an imported options CSV (Barchart-style export, columns matched by name so a reordered file still parses correctly), and plots Call/Put "wall" lines at the strikes with the heaviest interest.

Structure detection — Wyckoff Method

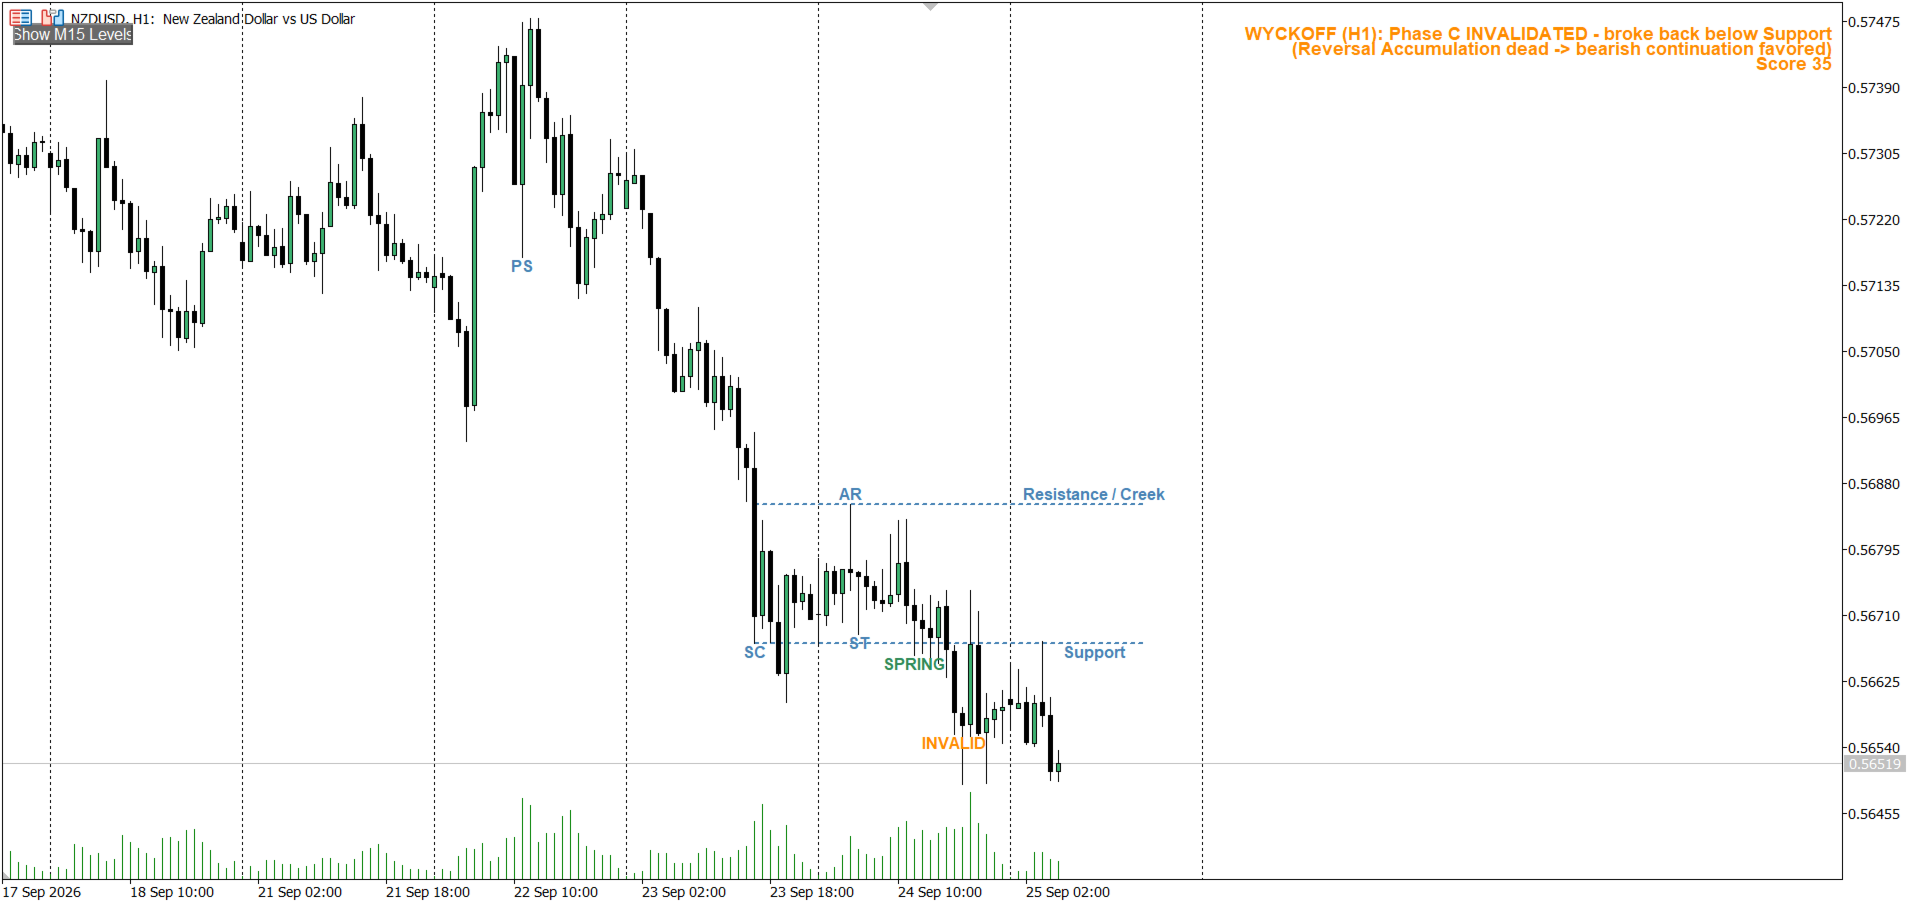
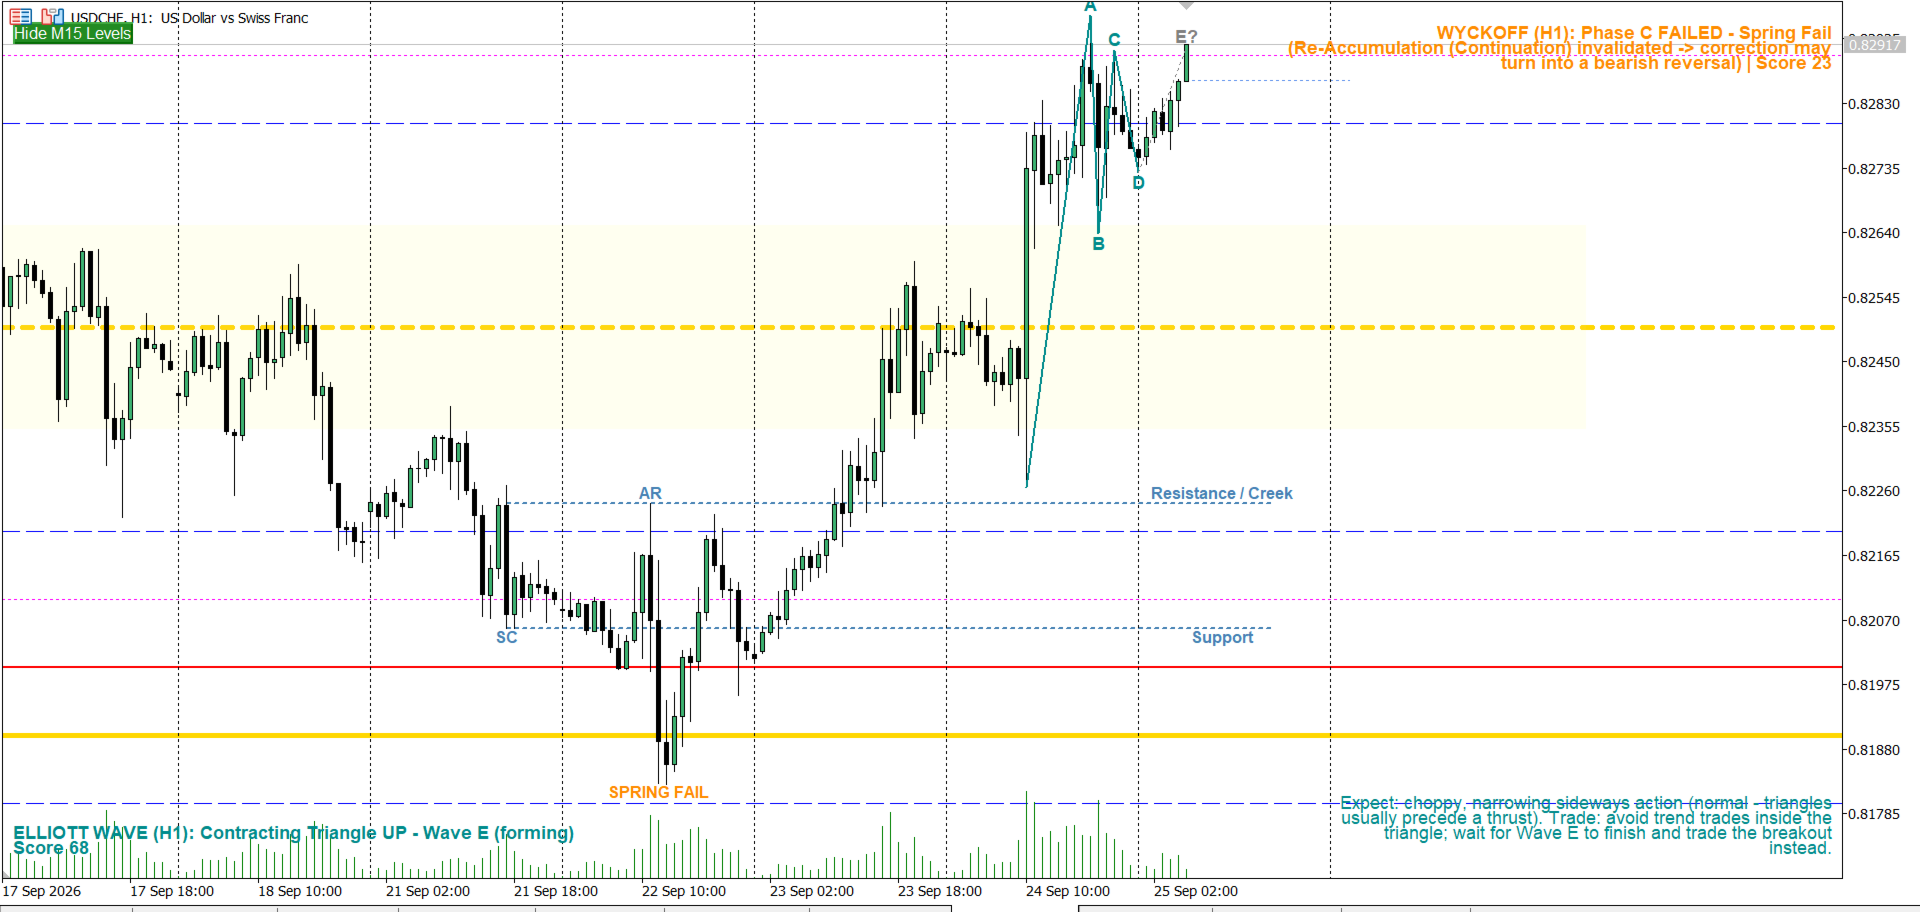
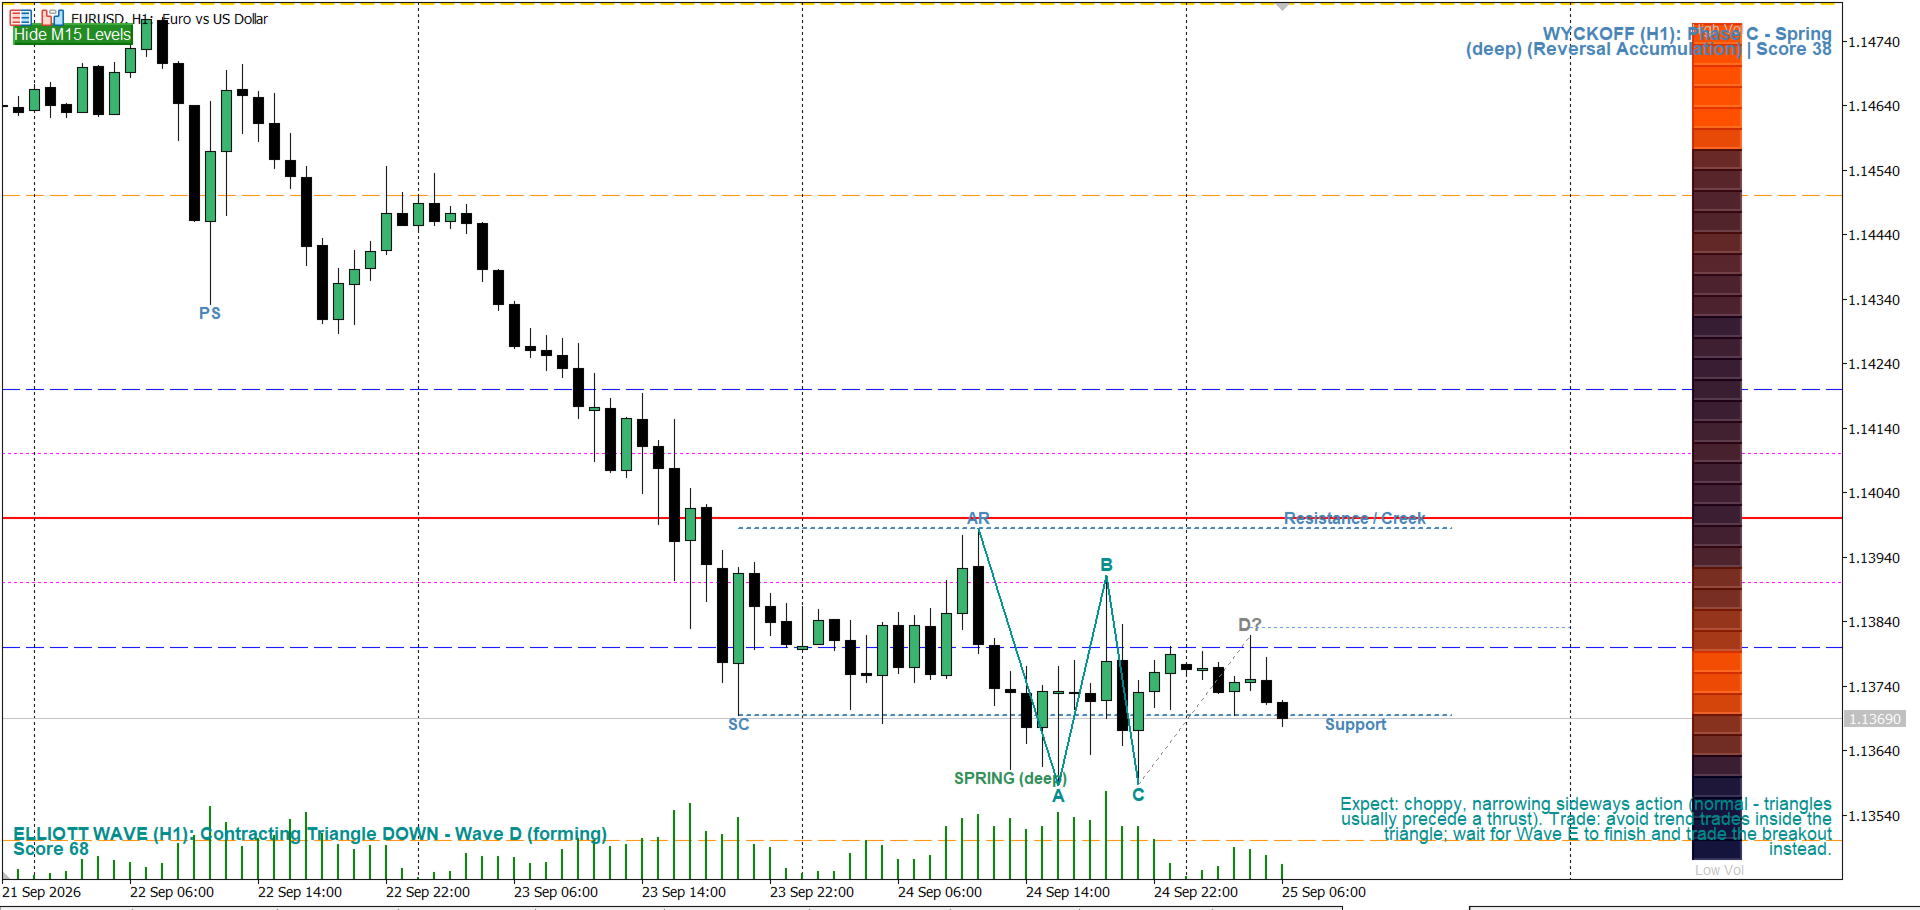
Feature 11 identifies an active Accumulation or Distribution cycle in real time, on any timeframe, and scores it with a probability-weighted status panel. It tracks the full classic sequence:

  • Preliminary Support/Supply and the Selling/Buying Climax
  • Automatic Rally / Automatic Reaction (AR)
  • Secondary Test (ST)
  • Spring (or Upthrust) — the shakeout below/above the range
  • Sign of Strength / Sign of Weakness (SOS/SOW)
  • Last Point of Support / Last Point of Supply (LPS/LPSY), with a real, bounded zone rather than a single price
  • Invalidation of a failed SOS/SOW back into the range

The panel shows which phase (A–E) the current range is in, whether the cycle is accumulation or distribution, and a confidence score based on volume behavior at each stage — using a median/trimmed-mean volume baseline so a single spike doesn't distort the read.

Structure detection — Elliott Wave

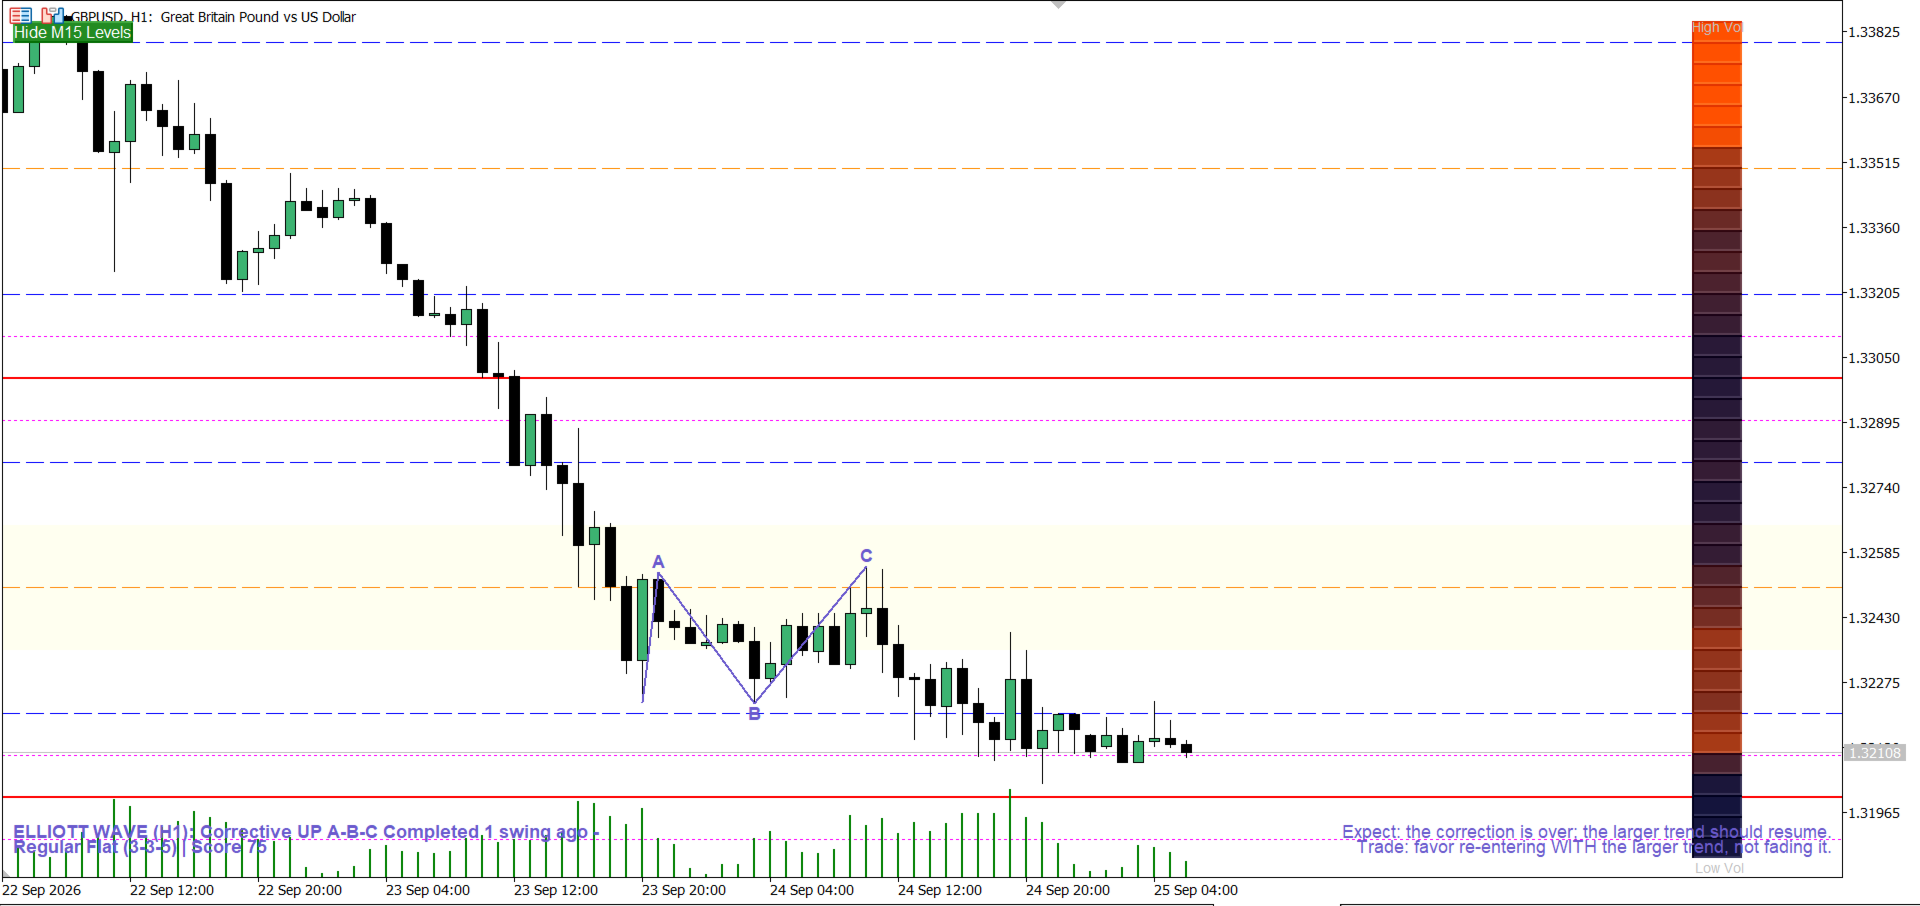
Feature 12 runs a full Elliott Wave scan on any timeframe, scoring candidates against classic Fibonacci guideline ratios and keeping the display stable via continuity/hysteresis (it won't jump between unrelated counts bar-to-bar). It detects:

  • Impulse waves (1-2-3-4-5), including Contracting and Expanding Diagonal variants
  • Corrective structures: Zigzag, Regular/Expanded/Running Flat, and Shallow/Irregular corrections
  • Triangles: both Contracting and Expanding, full A-B-C-D-E
  • Both a fully complete count and a live/forming count at once, so you can see both "what just finished" and "what's building right now"

For whichever count is active, it draws Fibonacci-based projection targets for the next wave and a plain-English guidance panel — e.g. Wave 2 = classic retrace entry zone, Wave 3 = hold/trail rather than take early profit, Wave 4 = avoid the chop, Wave 5 = tighten stops and watch for divergence, a Triangle = wait for the Wave E breakout. This is a textbook read of the detected geometry, not a signal or a recommendation.

Performance

Every visual element updates in place — grid lines, zone boxes, heatmap cells, and status panels are found and modified, not deleted and redrawn, so there's no flicker as price moves. The heavier scans (Wyckoff, Elliott, the sweep detector) only run once per new closed bar. The grid and HTF-zone window refreshes instantly on every new bar and also recenters automatically, on a short throttle, the moment price moves far enough intrabar — so a sudden news spike doesn't leave the chart stale while waiting on a timer.

How to use

  1. Watch for price approaching a Wall or Hot Zone level on your chosen major pair — these are the two level types that qualify as entry candidates; Trap levels are caution zones.
  2. Check whether the level also carries volume confluence (Feature 6) or sits on a Weekly/Monthly key level (Feature 7) — either raises its significance.
  3. If a Trap level was just swept and reclaimed (Feature 8), treat that as a stop-hunt warning rather than a reason to chase the wick.
  4. Use the Wyckoff and Elliott panels (Features 11/12) for broader phase/structure context — are you inside accumulation, or partway through an impulse — rather than as standalone entry triggers.
  5. Layer in your own confirmation (price action, order flow, or a separate volume/VSA tool) before acting on any level.

Inputs

Organized into input groups per feature (Visual Settings, then one group each for Features 1 through 12, plus the Feature 10 CSV/quote settings), so every feature can be tuned or disabled independently. All zone colors, styles, and widths are configurable, as are alert conditions, session windows, lookback depth, and detection thresholds for each detector.

Risk note

Tick volume is used as a proxy for real volume (no centralized tape exists for spot Forex), so treat volume-based reads as directional-pressure estimates rather than certainty. Wyckoff and Elliott Wave readings are the detector's structural interpretation of price, not a guarantee of what happens next. Always combine with your own risk management and trade plan.

Disclaimer

This indicator is provided for informational and educational purposes only. It does not constitute financial advice, and past price behavior at these levels or structures is not indicative of future results. Trading involves risk of loss.
推荐产品
Nameless Stochastic
Flavio Javier Jarabeck
5 (2)
It is the very same classic Stochastic indicator, but with a little twist: NO NAME and data is shown in the sub window. It could be stupid, BUT, if you are running out of space in Micro windows like Mini Charts, where the indicator's name is totally useless, you came to the right place. And that's it! I know it seems stupid but I needed the classical version of Stochastic indicator without that annoying name on my Mini Chart, so I did it that way... The original formula is right from Metaquote's
FREE
QuantumAlert Stoch Navigator is a free indicator available for MT4/MT5 platforms, its work is to provide "alerts" when the market is inside "overbought and oversold" regions in the form of "buy or sell" signals. This indicator comes with many customization options mentioned in the parameter section below, user can customise these parameters as needful. Join our   MQL5 group , where we share important news and updates. You are also welcome to join our private channel as well, contact me for the p
FREE
Prometheus Analyst
Humphrey Mangera
PROMETHEUS TECHNICAN VERSION Free | By THE SONS A gift from The Sons — no strings, no trial, no expiry. Every trader deserves access to professional-grade market intelligence. That belief is why Prometheus Technical Version exists, and why it costs nothing. Consider it our handshake to the trading community. What You're Getting This is not a simplified tool dressed up as a gift. Prometheus Technican Version is a fully built, institutional-quality technical analysis indicator running a dual-model
FREE
Follow Line
Thiago Pereira Pinho
4 (1)
The Follow Line Indicator is an essential technical analysis tool that provides a clear, immediate visualization of the trend while detecting high-probability reversals in real-time. By combining adaptive price tracking with clear visual alerts, it transforms complex data into actionable trading signals. Key Features Dynamic Trend Line: Tracks the market's prevailing direction, automatically adjusting to each new price extreme. Clear Colors: The line turns Blue during uptrends and Red during dow
FREE
Smart Structure Buy Sell Signals is a visual market structure indicator developed primarily for Gold (XAUUSD) intraday trading on MetaTrader 5. The indicator combines market structure, momentum, liquidity behaviour and supply-demand zones to identify potential Buy and Sell opportunities. It provides clear trading levels while keeping the final trading decision completely under the user’s control. This is a manual trading indicator. It does not open, modify or close real trades. Main Features • C
FREE
Rule Plotter Scanner
Francisco Gomes Da Silva
5 (1)
您是否曾经想过拥有一款能够扫描所有策略并同时显示该资产所有时间框架的买卖点的扫描仪? 这正是这款扫描仪所能做到的。该扫描仪旨在展示您在 Rule Plotter: 无需编程即可创建策略的策略生成器 中创建的买卖信号,并在此扫描仪中在不同的资产和时间框架上运行它们。 Rule Plotter的默认策略仅涉及牛市和熊市的蜡烛,这意味着如果您在Rule Plotter中没有绘制任何策略,该扫描仪将向您展示所选资产在所有时间框架上的蜡烛颜色,如果蜡烛为负则为红色,为正则为绿色。 创建您想要的任意策略 不要局限于默认策略,发挥您的创造力,构建传统策略,使用Metatrader中的所有可用指标。 或者,使用您喜欢的指标构建定制策略。 此扫描仪仅是Rule Plotter所提供的功能的冰山一角;它只是Rule Plotter的辅助工具。 然而,真正的魔力并不在这些工具上,因为它们只是为您 发挥创造力 的工具。 通过此扫描仪,您将全面了解您选择的所有资产的所有时间框架中您的策略的表现。 同时观察到所有指标同时发出信号将使您充满信心地进入操作,因为您将全面了解市场中其他参与者正在看到什么,从而大大降低错
FREE
Swing BOS Structure is a market structure indicator for MetaTrader 5. The indicator automatically detects: • Swing High (SH) • Swing Low (SL) • Break of Structure (BOS) • Change of Character (CHoCH) Swings are confirmed only after a defined number of candles, ensuring no repainting. BOS signals indicate trend continuation. CHoCH signals indicate a potential change in market structure and may appear less frequently depending on market conditions and timeframe. The indicator is lightweight, fa
FREE
Little useful tool - you manually select range on chart by dragging vertical blue lines and indicator shows support and resistance zones for this range and extends them outside of selected range.  Useful for: * Range trading * Range breakout * Range breakout & retest * Good entry during pullback in trend phase when previous high is retested * Good for scalping on short timeframes * Good for trades on longer timeframes around selected important zones like daily high or low
FREE
Ambush Swing Structure
Nicolaas Jason Jansen Van Vuuren
Ambush Swing Structure 不会坐等行情自报家门——它通过 RSI 极值捕捉波段高低点,再叠加完整的市场结构:结构突破(BOS)、性质转变(CHoCH),以及趋势真正反转的那一刻。两款指标的清晰度,合二为一,零重绘烦恼。 把它挂上任意图表,保持默认设置,结构便会实时显现。由 Ambush Pips 打造,献给那些宁愿伏击行情、也不愿追涨杀跌的交易者。                         xxoxoxoxoxoxoxoxoxoxoxoxoxoxoxoxoxoxoxoxoxoxoxoxoxoxoxoxoxoxoxoxoxoxoxoxoxxoxoxxoxoxxoxoxoxoxoxoxoxoxoxoxoxoxoxoxoxoxoxoxox xoxo xoxxoxoxoxoxo please forgive me for this its just to fill the 300 character size minimum. xoxoxoxoxoxo
VFI Quantum
Nikita Berdnikov
5 (1)
Introducing VFI (Volume Flow Indicator) – a trading indicator that analyzes the relationship between volume and price movement to identify key trading opportunities. The indicator displays the strength and direction of volume flow, providing clear signals about potential entry and exit points. Signals are formed based on zero line crossovers, crossovers between the VFI line and its exponential moving average (EMA), and when the indicator exits overbought and oversold zones. Attention! This stra
FREE
Fimathe PCM Indicador
Cristiano Rodrigo Olegini
5 (1)
Velas Forex FIMATHE PCM Indicator(免费) Velas Forex FIMATHE PCM Indicator 是一款免费指标,旨在帮助交易者以简单、快速且直观的方式进行市场分析。 该指标通过清晰的视觉信号帮助交易者识别市场状况,从而更有信心地做出交易决策。 XAUUSD 最佳测试结果: 时间周期: 5分钟(5M) MT5 服务器时间: 02:00 资金管理: 达到 1 次止盈(Take Profit)后: 停止交易,等待下一交易日。 达到 2 次止损(Stop Loss)后: 停止交易,等待下一交易日。 主要功能 简洁直观的用户界面。 安装和配置简单方便。 兼容 MetaTrader 5 平台上的所有金融交易品种。 支持多个时间周期(Timeframes)。 适合初学者和经验丰富的交易者使用。 占用平台资源少,运行高效。 免费 本指标 100% 免费 提供给所有 MQL5 社区用户使用。 如果您觉得本指标对您有所帮助,欢迎留下评分和评论。您的反馈将帮助我们持续开发更多优质工具。 免责声明 本指标仅作为技术分析辅助工具, 不保证任何盈利或投资回报 。在
FREE
Plus BB Color
Leonel Alberto Jose Quintana
Plus BB Color Plus BB Color 是一款适用于 MetaTrader 5 的视觉指标,旨在帮助用户更直观地读取价格在基于布林带和动态指数移动平均线结构中的位置。 该指标结合上轨、下轨、彩色中线以及潜在价格极值的视觉标记,帮助用户识别价格扩张、偏离以及可能出现的行情动能衰竭区域。 主要功能 根据可配置的周期和标准差计算上轨和下轨。 基于可调整周期的 EMA 计算中央线。 根据 EMA 相对于布林带基准线的位置自动改变中央线颜色。 识别上轨以上的局部极值。 识别下轨以下的局部极值。 使用视觉箭头突出显示可能的过度扩张或过度偏离区域。 兼容 MetaTrader 5 主图表。 支持系统使用的 Replay/Tester 环境。 视觉解读 中央线会根据 EMA 与布林带基准线之间的关系改变颜色: 蓝色: EMA 位于布林带基准线之上。 橙色: EMA 位于布林带基准线之下。 布林带可以帮助用户观察价格波动幅度,以及价格与中央区域之间的距离。 当指标识别到靠近或超出布林带的相关局部极值时,可能显示: 价格上方的粉色箭头: 识别到上方极值。 价格下方的蓝色箭头: 识别到下方极
FREE
Super Trend eu
Emin Ulucanli
4.83 (6)
SUPERTREND; It is a trend following indicator based on the SuperTrend ATR created by Olivier Seban. It can be used to detect changes in trend direction and locate stops. When the price falls below the indicator curve, it turns red and indicates a downtrend. Conversely, when the price moves above the curve, the indicator turns green, indicating an uptrend. Like other indicators, it works well on SuperTrend when used in conjunction with other indicators such as MACD, parabolik SAR, Bollinger Band
FREE
Cybertrade Keltner Channels
Emanuel Andriato
4.67 (6)
Cybertrade Keltner Channels - MT5 Created by Chester Keltner, this is a volatility indicator used by technical analysis. It is possible to follow the trend of financial asset prices and generate support and resistance patterns. In addition, envelopes are a way of tracking volatility in order to identify opportunities to buy and sell these assets. It works on periods longer than the period visible on the chart. All values ​​are available in the form of buffers to simplify possible automations.
FREE
About. This indicator is the combination of 3 Exponential Moving averages, 3,13 and 144. it features Taking trades in the direction of trend, and also helps the trade to spot early trend change through Small moving averages crossing Big Moving averages Product features 1. Have built in Notification system to be set as the user desires (Alerts, Popup notification and Push Notification to Mobile devices) so with notification on, you do not need to be at home, or glued to the computer, only set and
FREE
Non Lag Ma
Juan Manuel Rojas Perez
El indicador técnico Non Lag MA (Non-Lagged Moving Average) es una variante de la media móvil que busca reducir el retraso inherente a las medias móviles tradicionales. Pros: - Menos retraso: Al estar diseñado para reducir el retraso, el Non Lag MA puede proporcionar señales más rápidas que las medias móviles tradicionales. - Tendencias claras: Las líneas del Non Lag MA muestran claramente las tendencias alcistas y bajistas, lo que facilita la interpretación de la dirección del mercado. - Pers
FREE
VWap Osw MT5
William Oswaldo Mayorga Urduy
VWAP Institutional Pro:真实价值地图 VWAP Institutional Pro 是识别市场公平价格的终极工具,让您能够参考与大型投资基金和高频算法相同的标准进行交易。该指标实时计算成交量加权平均价,揭示动态支撑和阻力的隐形水平,机构订单流通常在这些水平上做出精准反应。 配置参数指南 请使用 MetaTrader 面板中显示的相同名称调整您的策略: TimeFrame VWap:定义锚定周期(日线、周线等),指标在此周期重新开始成交量和价格计算。 Show Line STD 1 a 5:用于激活或停用 5 条可用波动带的视觉开关。 STD 1 a 5:标准差带的自定义倍数;用于扩大或缩小机构超买和超卖区域。 视觉与操作解读 系统投影出一条中央平衡线 (VWAP) 和五个波动包络线。内线(STD 1 和 2)通常充当趋势延续区,而外线(STD 3 到 5)则标志着极端衰竭水平。当价格触及上轨或下轨并表现出拒收迹象时,会出现有效的反转信号,寻求回归中心价值。 优化与建议 资产:指数(纳斯达克、德指 DAX)、黄金 (XAUUSD) 和主要货币对。 时间周期
FREE
RSI abcd
Francisco Gomes Da Silva
4.33 (3)
RSI ABCD形态查找器:技术策略 1. 指标工作原理 结合 经典RSI 与自动检测 ABCD谐波形态 。 主要组件 标准RSI (可调周期) 高低点标记 (箭头) ABCD形态 (绿/红线) 超买(70)和超卖(30)过滤器 2. MT5设置 period = 14 ; // RSI周期 size = 4 ; // 最大形态尺寸 OverBought = 70 ; // 超买水平 OverSold = 30 ; // 超卖水平 Filter = USE_FILTER_ YES ; // 确认过滤器 3. 交易策略 3.1. 买入信号(看涨ABCD) 条件: RSI形成: 低点( A ) → 高点( B ) → 更高低点( C ) D 高于超卖区(30)但低于 C 确认:绿色连线A-B-C-D 目标: TP1: B-C的61.8% TP2: B-C的100% 止损: 低于 D 3.2. 卖出信号(看跌ABCD) 条件: RSI形成: 高点( A ) → 低点( B ) → 更低高点( C ) D 低于超买区(70)但高于 C 确认:红色连线A-B-C-D 目标: TP1: B-C的6
FREE
How it works –   Base-departure detection — algorithmically finds consolidation bases (overlapping range with compressed volatility) followed by displacement departures. Patterns: Drop-Base-Rally, Rally-Base-Drop, Rally-Base-Rally, Drop-Base-Drop — detected structurally, not by candle names. –   Strength score (0–100) — from departure velocity, time-at-base, freshness (each revisit decays the score), higher-timeframe confluence and origin volume. –   Lifecycle — Fresh, Tested (decaying), Broken
FREE
Pure Path
Jean Carlos Souza
ST Pure Path Indicator Description for Metatrader ST Pure Path Indicator Description for Metatrader This document aims to provide a clear and accessible description of the ST Pure Path indicator, developed for the Metatrader platform. It is designed to assist traders, especially those with little experience, in identifying market trends and decision points visually and intuitively. 1. Visual Identification The ST Pure Path appears on the chart as a continuous, solid line , with a thickness of 2
FREE
La **Media Móvil de Tercera Generación (TGMMA)** es una versión avanzada del indicador estándar de **Media Móvil (MA)**. Fue descrita por primera vez por Manfred G. Dürschner en su artículo "Gleitende Durchschnitte 3.0" (en alemán). Aquí están las características clave de la TGMMA: 1. **Reducción del Retraso**:    - A diferencia de las MAs tradicionales, la TGMMA reduce significativamente el retraso. Se adapta más rápidamente a los cambios de precios, lo que la hace ideal para traders que busc
FREE
Supertrend etradro
Christian Opperskalski
5 (3)
The Supertrend etradro indicator is volatility based and is more of a trend following indicator in function. The ATR indicator, which is integrated into the calculation of the super trend, also calculates course gaps (gaps) and does not overlook them. This allows more accurate values to be calculated. When measuring volatility, the mean value of the current price serves as the basis. Since the Supertrend indicator features sliding stop and reversal lines, it is quite similar in function to the P
FREE
AI Range Compression Scanner
Fadi Hassan Khaled Ghanem
AI Range Compression Scanner automatically finds periods of tightening volatility - price squeezes - and highlights them as a shaded zone on the chart, then marks the breakout the moment price escapes the squeeze. Volatility contraction almost always precedes an expansion move, and this indicator lets you see it building in real time. The indicator continuously compares a short-term price range against a longer-term baseline range. When the short-term range compresses below your chosen percentag
FREE
Reversal Composite Candles
MetaQuotes Ltd.
3.69 (16)
该系统的思路是通过计算复合蜡烛来识别反转形态。 反转形态类似日本蜡烛条分析的 "锤头" 和 "吊颈" 形态。但它使用符合蜡烛替代单一的蜡烛,并且不需要复合蜡烛的小实体来确认反转。 输入参数: Range - 最大柱线数量, 计算复合蜡烛时用。 Minimum - 最小复合蜡烛大小 (传统的点数)。 ShadowBig and ShadowSmall - 影线 (复合蜡烛单元)。 Limit, StopLoss and TakeProfit - 开盘价, 止损位和止盈位, 它们是相对于复合蜡烛的收盘价 (复合蜡烛单元)。 Expiration - 订单过期时间 (单位柱线), 用于挂单 (Limit!=0.0)。 反向蜡烛条形态的判别如下。 它计算复合蜡烛参数,其自最后的完整柱线 (索引为 1) 至由 Range 输入参数定义的柱线数量。如果复合蜡烛大小大于由 Minimum 输入参数指定的数值, 它分析复合蜡烛的影线检测反转条件。 空头能量的特征是复合蜡烛的上影线为零, 多头能量的特征是复合蜡烛的下影线为零。 为确认空头趋势反转 (且多头开始),需要以下检查: 下影线的大小 (多头能量
FREE
================================================================================               VL LEVELS INDICATOR - USER GUIDE               VolumeLeaders Institutional Trade Levels for MetaTrader 5 ================================================================================ WHAT IS THIS INDICATOR? ----------------------- This indicator displays VolumeLeaders institutional  dark pools trade levels on your MT5 charts. These levels represent price points where significant institutional trad
FREE
Indicator MA Channel
Alexey Smirnov
4 (1)
I present the well-known Moving Average indicator. This indicator is presented as a channel, where the upper and lower lines are equidistant from the main line by a percentage set by the user. The indicator is easy to use. The basic settings of the moving average have been saved and a percentage parameter (Channel%) has been added. Basic parameters: Channel% - shows how much we want to deviate from the main line. The indicator is freely available.
FREE
The 3 Bar Break
Stephen Reynolds
Three Bar Break is based on one of Linda Bradford Raschke's trading methods that I have noticed is good at spotting potential future price volatility. It looks for when the 1st bar's High is less than the 3rd bar's High as well as the 1st bar's Low to be higher than the 3rd bar's Low. This then predicts the market might breakout to new levels within 2-3 of the next coming bars. It should be used mainly on the daily chart to help spot potential moves in the coming days. Features : A simple meth
FREE
【为什么大多数 RSI 背离不是延迟,就是重绘?】   如果你用过足够多的背离指标,你一定遇到过这两种情况之一: 要么背离出现得很晚,要么背离会突然消失。   这并不是某个指标 “写得不好”,而是背离本身的计算逻辑,天然就存在取舍问题。   如果你想要 “立刻提示”,往往就要承受重绘; 如果你想要 “完全不重绘”,就一定会有延迟。   这个指标,正是试图在这两者之间,找到一个更合理的平衡点。   ————————————————————   【背离为什么一定会有延迟?】   背离,本质上是在比较两个高点或两个低点之间的关系。   但问题在于:一个高点或低点,只有在行情出现反向回调之后,才能被确认是真正成立的。   在回调发生之前,任何所谓的 “高点 / 低点”,都只是暂时的价格位置,而不是一个已经确认的极值。   因此,传统背离算法通常采用的逻辑是:先等待价格走出一段回调,再回头确认前面的高点或低点,最后才判断是否构成背离。这一步 “等待确认”的过程,就必然带来了时间上的延迟。   ————————————————————   【那重绘又是怎么来的?】   重绘,通常出现在追求 “提
FREE
On Chart Watchlist
Omkar Dilip Pathak
5 (2)
On Chart Watchlist puts your Market Watch symbols and your favourite timeframes on the chart as compact buttons, so you can switch with one click. The panels are live: symbol text turns green or red with the daily change, and hovering a button shows bid, spread and daily %. You can collapse the panels, page through long lists, open a symbol in a new chart with Ctrl+Click, step through symbols with the keyboard, and keep linked charts in sync. It detects broker prefixes and suffixes automatically
FREE
Quantora Market Structure MT5 is a MetaTrader 5 indicator that identifies confirmed swing points and displays market structure events on the chart. The indicator classifies detected swing points as Higher High, Higher Low, Lower High or Lower Low. It also marks Break of Structure and Change of Character events according to its detection conditions. Market Structure Analysis Higher High and Higher Low detection Lower High and Lower Low detection Bullish and bearish Break of Structure events Chan
FREE
该产品的买家也购买
SMART TREND TRADING SYSTEM — 特别优惠 您的交易系统、自动化 EA,以及配套培训与支持。 以 99 美元购买适用于 MT5 的 Smart Trend Trading System,即可 免费获赠 Smart Universal Expert Advisor ,用于自动执行系统的交易信号。 STTS 将趋势方向、入场和出场信号、反转区域及重要价格水平集中呈现在图表上。您可以根据系统手动交易,也可以连接随附的 EA,按照您选择的设置自动执行交易。 当前 99 美元的价格适用于接下来的 30 次购买。此后,价格将上调至 149 美元。 您的完整产品套装 购买后,您将获得: • 适用于 MT5 的 Smart Trend Trading System。 • Smart Universal Expert Advisor — 免费赠送。 • 完整的 STTS PDF 用户手册。 • STTS 官方在线课程。 • 逐步安装与设置指导。 • 私人客户社区访问权限及支持服务。 您不仅能获得工具,还能按照清晰的步骤学习如何使用它们。 一套系统,四种交易思路 STTS
Trend Sniper X
Sarvarbek Abduvoxobov
4.9 (39)
Trend Sniper X 是一款适用于 MetaTrader 5 的多周期趋势跟踪指标,可帮助交易者清晰精准地识别趋势方向和潜在的反转点。 适用于 MT4: https://www.mql5.com/en/market/product/193245 价格信息: 当前价格为促销价,随着后续更新和新功能的推出,价格可能会有所变动。 赠品优惠: 购买后联系作者,即可免费获取该指标的 Auto-Trade Assistant EA(自动交易助手 EA)。 Code2Profit 频道 通过多时间框架分析掌控市场! 如何使用 Trend Sniper X 最大化您的胜率:核心规则与交易时段技巧 技术规格 平台 MetaTrader 5 指标类型 多时间周期趋势指标 运行时间周期 任何图表时间周期,可独立选择更高的时间周期 (M1–MN1) 主要交易品种 外汇、黄金 (XAUUSD) 及其他差价合约 (CFD) 推荐账户 任何账户类型 可视化 彩色趋势蜡烛 (买入/卖出/微弱/变化) + 买入/卖出箭头 附加模块 交易时段方框 (悉尼、东京、伦敦、纽约) 主要功能 多时间周期趋势分析: 直接在
Neuro Poseidon MT5
Daria Rezueva
4.75 (52)
Neuro Poseidon is a new indicator by Daria Rezueva. It combines precise trading signals with adaptive TP/SL levels - creating best possible trades as a result! Message me and get  Neuro Poseidon Assistant  as a gift to automize your trading process! What makes it stand out? 1. Proven profitability on all assets and timeframes 2. Only confirmed BUY and SELL signals present on the chart 3. Adaptive TP & SL levels generated by the software for each trade 4. Easy to understand - suitable for al
M1 Sniper MT5
Oleg Rodin
5 (7)
M1 SNIPER   是一款易于使用的交易指标系统。它是一个专为 M1 时间框架设计的箭头指标。该指标可以作为独立的系统在 M1 时间框架下进行剥头皮交易,也可以作为您现有交易系统的一部分使用。虽然该交易系统专为 M1 时间框架交易而设计,但它也可以用于其他时间框架。我最初设计此方法是为了交易 XAUUSD 和 BTCUSD。但我发现这种方法在其他市场交易中也同样有用。 指标信号既可以顺势交易,也可以逆势交易。我教授一种特殊的交易技巧,帮助您利用指标信号进行双向交易。该方法基于使用特殊的动态支撑位和阻力位区域。 购买后,您可以立即下载 M1 SNIPER 箭头指标。此外,我还为所有 M1 SNIPER 工具用户免费提供下方屏幕截图所示的 Apollo Dynamic SR 指标!这两个指标的组合可以帮助您更轻松、更准确地利用 M1 时间框架进行交易。 购买后请联系我,免费获取交易提示和奖励指标! 祝您交易成功!
SuperScalp Pro
Van Minh Nguyen
4.65 (34)
SuperScalp Pro - Professional Multi-Layer Confluence Scalping System SuperScalp Pro 是一款高级剥头皮交易指标,在经典 Supertrend 的基础上加入了多个智能确认过滤器。它可以帮助您识别概率更高的 Buy/Sell 交易机会,同时显著减少虚假信号。 清晰的 Buy 和 Sell 箭头会直接显示在图表上,基于 ATR 的 Stop Loss 和 Take Profit 水平会实时自动计算。 购买后,请联系我获取设置指导和推荐配置。 使用 SuperScalp Pro Auto Trader 轻松实现信号自动化: [Auto Trader] 下载推荐设置文件: [Set File] 完整文档请参阅产品博客: [User Guide] 加入官方频道获取最新更新: [Official Channel] SuperScalp Pro 如何工作? 只有当多个确认层同时一致时,指标才会生成交易信号(趋势 + 动能 + 成交量 + 波动率)。 您可以手动交易,也可以连接 SuperScalp Pro Auto Tr
Zoryk Gold
Reda El Koutbane
5 (13)
折扣将在 24 小时后结束——下一价格为 69 美元 ZORYK — MetaTrader 5 专用高级 XAUUSD 黄金信号系统 你一定熟悉这种感觉。 你花了很多时间分析黄金,等待合适的入场机会。终于开仓后,价格却立刻朝相反方向移动。你过早平仓、移动止损,或者只犹豫了几秒钟。随后,市场却在没有你的情况下到达了你原本预期的目标。 问题并不总是方向判断错误。 真正的问题是缺乏确定性。 你不知道准确的入场位置在哪里。 你不知道什么时候交易逻辑已经失效。 你不知道应该先锁定较近的利润,还是继续等待更大的行情。 你也不知道当前信号是否足够强,还是自己只是在强行寻找交易机会。 黄金市场变化非常快。一个没有明确计划的好想法,可能在几秒钟内变成错误的交易决定。 ZORYK 正是为了解决这个问题而开发。 什么是 ZORYK ZORYK 是一套完整的 XAUUSD 黄金信号与交易计划系统,专门为 MetaTrader 5  和 M5 时间周期 开发。 它不是一个只显示 BUY 或 SELL 箭头,然后让你独自决定其余所有内容的简单指标。 每个确认后的信号都可以在图表上显示完整的可视化交易计划,包
Gann Made Easy MT5
Oleg Rodin
5 (10)
Gann Made Easy   是一个专业且易于使用的外汇交易系统,它基于使用先生理论的最佳交易原则。 W.D.江恩。该指标提供准确的买入和卖出信号,包括止损和获利水平。您甚至可以使用推送通知在旅途中进行交易。 购买后请联系我,即可免费获得交易指导和超棒的额外指标! 您可能已经多次听说过江恩交易方法。通常 Gann 的理论不仅对于新手交易者而且对于那些已经有一定交易经验的人来说都是非常复杂的东西。这是因为江恩的交易方法在理论上并不那么容易应用。我花了几年时间来完善这些知识,并将最好的原则应用到我的外汇指标中。 该指标非常易于应用。您所需要的只是将其附加到您的图表并遵循简单的交易建议。该指标不断进行市场分析工作并寻找交易机会。当它检测到一个好的入口点时,它会为您提供一个箭头信号。该指标还显示止损和获利水平。 换句话说,当您像先生一样进行交易时,该指标会为您提供最佳江恩建议。江恩亲自告诉你此时此刻该做什么。但最好的部分是您不需要了解任何有关江恩交易原则的知识,因为该指标会为您完成整个市场分析工作。
SMC Intraday Formula
Kareem Abbas
5 (25)
让我们先坦诚一点。 没有任何一个指标可以单独让你实现盈利。如果有人告诉你可以,那他是在向你兜售一个梦想。任何显示完美买卖箭头的指标都可以被做得看起来毫无瑕疵——只需要放大历史中的某一段并截取成功交易的截图。我们不会这样做。 SMC Intraday Formula 是一个工具。 它为你读取市场结构,标记出概率最高的价格区域,并用简单直白的语言准确告诉你当前智能资金的行为轨迹。你仍然需要做决定。你仍然需要执行交易。但现在,你是带着精确性执行,而不是靠希望。 我们已经在黄金(XAUUSD)以及主要外汇货币对的日内剥头皮交易中使用该指标将近三年。这是我们在 M1、M5、M15 和 M30 上的日常主力工具。它之所以有效,是因为它不试图预测未来——它展示的是当前正在形成的高概率交易机会,并解释 为什么 。 它与其他所有指标有什么不同? 大多数交易指标只做一件事。移动平均线交叉。振荡指标触及某个水平。出现一个箭头。你进场交易。你亏损。你责怪指标。重复。 SMC Intraday Formula 将多个机构级概念整合为一个统一的市场解读: - 斐波那契共振引擎 不只是普通的斐波那契水平——该指标
GoldenX Entry MT5
Kareem Abbas
5 (16)
GoldenX Entry 是一款用于 MT5 的指标,包含自适应 Smart Entry Trend 算法、信号评分系统、市场状态识别器以及波动率过滤器。每个信号都包含计算得出的入场位、三个止盈位(TP1、TP2、TP3)以及止损位。它基于多个分析层构建,旨在适应不同市场条件,将多层分析系统与内置优化器及统计跟踪系统相结合。该指标基于风险收益比(RR)指标和历史交易行为提供量化分析。 开始使用非常简单——在所选时间周期上运行优化器,然后在图表上开始使用该指标。 核心功能 GoldenX Entry 将信号引擎与内置交易管理及历史统计跟踪整合在同一图表中: - 内置优化器: 优化器可在图表上单击运行。它通过两阶段搜索流程测试200种参数组合——先进行探索,再进行优化——并在完成后自动应用选定配置。结果会按时间周期缓存,因此当返回已优化的周期时,会立即恢复相同设置。 - 黄金品种自动周期识别: 将指标加载到任何 XAUUSD 图表(M1 到月线)。系统会自动识别当前周期并加载对应预设。共包含9个时间周期配置文件,专为黄金在标准周期上优化设计。切换周期时,参数会自动调整。 - 资金参考面
Unix Scalper
Issam Kassas
4 (4)
UNIX SCALPER — 特别优惠 发现交易形态,看清交易计划,选择执行方式。 以 99 美元购买适用于 MT5 的 UNIX Scalper,即可免费获赠 Smart Universal Expert Advisor,用于自动执行指标的交易信号。 UNIX Scalper 将市场分析、BUY/SELL/WAIT 决策以及 Entry、Stop Loss、TP1 和 TP2 水平集中在一个清晰的面板中。您可以按照交易计划手动交易,也可以连接随附的 EA,按照您选择的设置自动执行交易。 当前 99 美元的价格适用于接下来的 30 次购买。此后,价格将上调至 149 美元。 您的完整产品套装 购买后,您将获得: • 适用于 MT5 的 UNIX Scalper。 • Smart Universal Expert Advisor — 免费赠送。 • 完整的 UNIX Scalper PDF 用户手册。 • UNIX Scalper 官方在线课程。 • 逐步安装与设置指导。 • 私人客户社区访问权限及支持服务。 您不仅能获得工具,还能按照清晰的步骤学习如何使用它们。 看清信号与交
Entry Points Pro for MT5
Yury Orlov
4.52 (151)
传奇回归:Entry Points Pro 10。 这款传奇指标曾 3 年稳居 MQL5 Market 前三,如今全面重启。 数百条热情好评(两个版本合计 589 条),每天有数千名交易者用它交易,演示版下载 31,000+   MT4+MT5  次。 五年来我读过你们的每一条评价——在第 10 版里,我没有给出许诺,而是把答案直接做进了产品。指标作者自 1999 年入市, 珍视诚信、自己的声誉和自己的客户 。 Entry Points Pro 给出的入场信号严格不重绘。 而且这一次不再只是作者的一面之词,而是可验证的事实:确认信号只在 K 线收盘后标出,自动化测试记录到 零重绘 (在 EURUSD、XAUUSD 和 BTCUSD 上共 2,486,568 次不变量检查——0 次违规)。测试方法完全公开——您可以在策略测试器中自行复现。 购买后请务必第一时间给我发私信。 我会发给您 扩展版说明书《交易者圣经》 ——使用本指标交易的完整指南——并告诉您如何免费获得 赠品:市场扫描器 ,它能同时分析多个品种和多个时间周期,并在一个界面上显示 Entry Points Pro 此刻在哪里表现
Welcome to ENTRY IN THE ZONE AND SMC MULTI TIMEFRAME Entry In The Zone and SMC Multi Timeframe is a real-time market analysis tool based on Smart Money Concepts (SMC), designed to analyze market structure, price direction, and key trading zones. It supports both Single-Timeframe Analysis and Multi-Timeframe Analysis, providing a clearer view of the overall market structure across multiple timeframes, with real-time BUY / SELL signals that do not repaint. It is designed to help filter trading opp
Reversion King Indicator
Eugen-alexandru Zibileanu
5 (9)
全新王者降临 - 指标 + 订单管理提示(TP1 + TP2 + TP3)+ 可选 Telegram 信号发送器 INCLUDED(免费) (完整交易与信号系统) 我们最强的黄金 EA: Gold Slayer 该指标包含先进的交易策略、可自定义订单管理系统,以及结合 Envelope 扩展的均值回归系统,并通过 RSI 等多重智能确认过滤器进行验证,以捕捉高概率反转入场机会,提供 BUY 与 SELL 信号。 你不仅能够学习如何交易,还能学会如何高效管理多个仓位,并利用之前盈利的持仓来覆盖亏损交易。 专为 M5 周期打造并优化,在 BTCUSD 和 XAUUSD 上表现尤为出色,因为这些市场的流动性能够让信号更加干净、可靠。 该指标会自动生成清晰的多头(Long)与空头(Short)信号,同时基于 ATR 自动计算入场位、止损位和止盈位,让风险管理从一开始就融入系统之中。 多 TP 系统设有三个渐进式目标位,你可以在 TP1 锁定部分利润、在 TP2 继续持仓,并在更大的行情中将仓位持有至 TP3,而这正是平均风险回报比真正开始大放异彩的地方。 默认参数开箱即用,已经针对稳定表现进行
Gold Entry Sniper
Tahir Mehmood
5 (20)
Gold Entry Sniper – 专业多周期ATR黄金交易仪表盘,适合黄金剥头皮与波段交易 Gold Entry Sniper 是一款先进的 MetaTrader 5 指标,旨在为 XAUUSD 及其他品种提供精准的 买/卖信号 。基于 ATR 移动止损逻辑 和 多周期分析仪表盘 ,适合剥头皮交易者与波段交易者,帮助识别 高概率黄金入场点 。 主要功能与优势 多周期信号分析 – 同时显示 M1、M5、M15 趋势方向。 基于ATR的动态止损 – 根据波动性自动调整。 专业图表仪表盘 – 展示信号状态、ATR水平、线性回归中线和交易方向。 清晰买卖标记 – 自动箭头与文字标签提示。 离场提示与交易管理 – 自动检测离场信号锁定利润。 全面自定义 – 调整仪表盘位置、颜色、字体及参数。 专为黄金优化 – 适用于 M1至M15 黄金剥头皮 ,也适合外汇、指数与加密货币。 为什么选择 Gold Entry Sniper? 为追求 快速、精准、可视化交易决策 的交易者打造,ATR 与多周期确认结合,帮助你抓住 最佳黄金入场点
Market Structure Order Block Dashboard MT5 是一款专为希望直接在图表上解读市场结构和主要价格反应区域的交易者设计的MT5指标。它结合了BOS、ChoCH、订单块(Order Blocks)、公允价值缺口(FVG)、流动性、Kill Zones、成交量分布图以及一个紧凑的面板,便于快速分析。 本指标面向使用市场结构、ICT和Smart Money概念作为决策框架的交易者。它可以帮助以更结构化的方式识别趋势延续、可能的反转、价格失衡、流动性目标和关注区域。 面向买家的资源 购买后可通过MQL5私信申请获取完整的PDF使用指南和参数配置建议。通过MQL5私信提供直接技术支持。 1.20版本带来两项重要新增: Pending BOS / Pending ChoCH 检测 和 可拖动面板 (按住面板标题栏即可将其拖动到图表任意位置,不影响图表本身)。当K线收于前一摆动点之外时,Pending Breaks 立即显示待确认的结构突破,无需等待经典的摆动确认。 重要 本产品仅为指标。它不会自动开仓、平仓或管理仓位。它不是EA(智能交易系统)。 主要功能 市场
Atomic Analyst MT5
Issam Kassas
4.46 (59)
ATOMIC ANALYST — 特别优惠 您的市场分析工具、自动化 EA,以及配套培训与支持。 以 99 美元购买适用于 MT5 的 Atomic Analyst,即可 免费获赠 Smart Universal Expert Advisor ,用于自动执行指标的交易信号。 Atomic Analyst 将价格行为、趋势方向、入场和出场信号、止损位及多个止盈位集中呈现在图表上。您可以参考其分析手动交易,也可以连接随附的 EA,按照您选择的设置自动执行交易。 当前 99 美元的价格适用于接下来的 30 次购买。此后,价格将上调至 149 美元。 您的完整产品套装 购买后,您将获得: • 适用于 MT5 的 Atomic Analyst。 • Smart Universal Expert Advisor — 免费赠送。 • 完整的 Atomic Analyst PDF 用户手册。 • Atomic Analyst 官方在线课程。 • 逐步安装与设置指导。 • 私人客户社区访问权限及支持服务。 您不仅能获得工具,还能按照清晰的步骤学习如何使用它们。 看清信号,理解交易形态 Atom
货币强度向导是一个非常强大的指标,为您提供成功交易的一体化解决方案。该指标使用多个时间范围内所有货币的数据来计算这个或那个外汇对的力量。此数据以易于使用的货币指数和货币电力线的形式表示,您可以使用它们来查看这种或那种货币的力量。 您所需要的只是将指标附加到您要交易的图表上,该指标将向您显示您交易的货币的真实强度。该指标还向您显示买卖量压力的极值,您可以在顺势交易时利用这些压力。该指标还显示了基于斐波那契的可能目标。该指标可用于各种交易时间范围。该指标支持各种货币对的交易。   该指标为您提供所有类型的警报,包括推送通知。 购买后请联系我。我将与您分享我的交易技巧,并免费为您提供丰厚的红利指标! 祝您交易愉快,获利丰厚!
FiboSniper Pro
Van Minh Nguyen
5 (3)
FiboSniper Pro – Multi-Filter Fibonacci System with Auto SL/TP and Control Panel FiboSniper Pro 是一款技术指标,将动态 Fibonacci Envelopes 与多个确认过滤器相结合,以生成经过筛选的 Buy 和 Sell 信号。Fibonacci 水平基于 Moving Average 和 ATR 计算,然后通过 ADX、EMA、RSI、ATR、Volume、Time 和 Candle 结构进行过滤。该指标直接在图表上显示基于 ATR 自动计算的 Stop Loss 和 Take Profit 水平,并提供交互式控制面板,以便快速调整参数。 购买后,请联系我以获取推荐的设置文件和详细使用说明。 使用 Auto Trader X 自动执行 FiboSniper Pro 信号: [Auto Trader X] 用户指南和设置文件: [Click here] 加入官方频道获取最新更新: [Click here] 专为偏好结构化入场和清晰风险管理的交易者设计,适用于 Gold (XAUUSD)、B
Tokyo mt5 Indicator
Vasiliy Strukov
5 (1)
Tokyo Indicator(东京指标)直观地展示了趋势方向、潜在交易信号及市场状况。 其采用颜色编码的阶梯式趋势线,以蓝色标识看涨阶段,以洋红色标识看跌阶段。配套的方向箭头会在趋势发生变化时,标示出潜在的买入与卖出机会。 内置的综合仪表盘将当前信号、市场倾向、动能、波动率及信号质量整合于同一视图中,方便交易者在观察价格走势的同时评估指标数据,无需在不同面板间切换。 凭借清晰的图表显示和简洁的市场概览,Tokyo Indicator 支持以系统化的方式进行趋势分析与交易确认。 适用于任何时间周期及各类交易品种,尤其适合黄金交易。 购买后请立即联系我,以获取专属赠品!您可以免费获得我们的“强力支撑与趋势扫描”(Strong Support and Trend Scanner)指标,请私信我! 设置说明与使用手册请见此处。 请注意:我不会在 Telegram 上出售我的 EA 或特殊参数设置(set files);我的 EA 仅在 Mql5 平台上提供,而参数设置文件仅在我的博客(此处链接)上发布。请务必警惕诈骗,切勿从他人处购买任何参数设置! 设置 ShowHUD —— 在图表上显示
Adaptive Price Action Engine 买指标,免费送EA 自适应多时间框架趋势与K线形态智能分析系统 市场环境始终在变化,不同的市场阶段中,并非所有 Price Action 形态都具有相同的参考价值。 Adaptive Price Action Engine 旨在适应不断变化的市场条件,将 趋势结构、多时间框架分析、K线形态与统计优化 整合到一个统一的分析框架中。 两种自适应模式 Dual Alpha Trend Mode(双 Alpha Trend 模式) 自动搜索适合的 Alpha Trend 参数,并结合低周期与高周期市场结构,使指标能够根据近期市场行为动态调整趋势识别。 Candlestick + Alpha Mode(K线 + Alpha 模式) 将 Alpha Trend 市场状态与 22种多空K线形态 相结合。系统不会简单地对所有形态一视同仁,而是对不同的形态组合进行统计评估,并识别在特定市场环境下表现出更强历史统计特征的配置。 主要功能 趋势参数自动优化 多时间框架市场状态分析 22种多头与空头 Price Action K线形态 对数千种可能
SMART PRICE ACTION CONCEPTS — 特别优惠 看清结构,识别区域,制定交易计划。 以49美元购买MT5版Smart Price Action Concepts,即可免费获得Smart Universal Expert Advisor。 在一张清晰有序的图表中整合Smart Money Concepts(SMC)、ICT风格分析与价格行为分析。识别市场结构、订单块、流动性参考价位和失衡区域,再通过Smart Panel选择要显示的内容。 当前49美元的价格适用于接下来的30笔购买。之后价格将上调至100美元。 完整套餐 • MT5版Smart Price Action Concepts。 • Smart Universal Expert Advisor — 免费赠品。 • 完整PDF用户手册及官方在线课程。 • 分步骤安装和设置指导。 • 私人客户社区访问权限及支持服务。 工具、培训和清晰的入门指引,均包含在购买中。 更有条理地分析市场 • 市场结构:内部与波段结构、HH/HL/LL/LH、BOS与CHoCH、高周期分析及多周期仪表板。 • 关键区域:内
Divergence Bomber
Ihor Otkydach
4.89 (94)
购买该指标的每位用户将额外免费获得以下内容: 原创工具“Bomber Utility”,该工具会自动跟踪每一笔交易,设置止损和止盈点,并根据策略规则自动平仓; 适用于不同交易品种的指标设置文件(Set 文件); 三种不同风险模式下的 Bomber Utility 设置文件:“最低风险”、“平衡风险” 和 “观望策略”; 一套详细的 视频操作手册,帮助您快速完成安装、配置并开始使用本交易系统。 注意: 要获取以上所有赠品,请通过 MQL5 的私人消息系统联系卖家。 我为您介绍原创的自定义指标 “Divergence Bomber”(背离轰炸机),它是一套基于 MACD 背离交易策略 的“全功能”交易系统。 该技术指标的主要任务是识别 价格与 MACD 指标之间的背离,并发出交易信号(包括推送通知),指示未来价格可能的运动方向。平均而言,这些信号的准确率超过 98%。有关该指标如何工作的详细说明,请观看本页面上的视频演示。 该系统使用 止损订单 和 动态回撤平仓机制 来管理交易。 Divergence Bomber 指标的主要特点: 支持交易的品种: AUDCAD、AUDCHF、AUDS
Auto Optimized SpeedAngle 是一款机构级的动量向量化系统,通过持续的前瞻优化(Walk-Forward Optimization, WFO)彻底消除了曲线拟合(curve-fitting)。该指标没有采用在市场 状态转换时容易失效的静态输入参数,而是利用出样外验证(Out-of-Sample, OOS) dynamically 动态重新校准设置,从而确保显示的 信号代表真正的统计优势,而非历史巧合。 核心机构级架构 前瞻优化引擎(Walk-Forward Optimization Engine): 核心算法持续扫描数千种回溯周期(lookback)与阈值组合,严格将数据划分为样本内(in-sample)和样本外(out-of-sample)。只有当参数配置在未知数据环境中证明具备数学优越性时,系统才会对其进行 adoption。 量化目标函数(Quantitative Objective Functions): 优化引擎不一味追求绝对毛利,而是聚焦于机构级的稳定性指标。用户可针对系统质量数(SQN)、期望值(每笔交易的平均 R 倍数)或净 R 值进行优化,从而优
Volatility Master for MetaTrader is a real-time dashboard tool that scans up to  50 symbols  to identify high-volatility , trending markets instantly. With bullish/bearish signals, customizable alerts, and a user-friendly interface, it helps you avoid range-bound conditions and focus on high-probability trades. Clarity leads to confidence. Trade confidently and protect your capital effectively with this powerful dashboard. We don't offer free or bonus indicators in exchange of reviews from you.
PZ Trend Trading MT5
PZ TRADING SLU
3.8 (5)
许多盈利交易者不仅知道如何识别市场趋势,而且也能把握趋势建立后的交易机会。 Pz 趋势交易 指标设计用来在趋势行情中尽可能的赚取利润。 已建立的趋势提供了一揽子交易机会,但大多数趋势交易指标完全忽视了它们,让交易者在趋势行情时完全不知道该如何做!一般趋势指标只通知有关的趋势变化,但根本不足以得到卓越的回报. Pz 趋势交易 指标比一般趋势指标显示多达 20 倍的交易 , 因为它注重所谓的市场时机。它不仅显示当前的市场趋势,也有回调,内柱线的突破和调整。它令您在趋势回调之后介入,安全的柱线内突破金字塔加仓,以及发现潜在的反转,和已知的调整。 趋势改变 一个趋势改变在市场方向变化时发生。趋势变化在图表上用带数字的彩色圆圈显示。蓝色 (1) 信号为上涨开始, 而红色 (1) 信号为下跌开始。趋势变化并非评估当前价格动作的结果, 它意味着交易设置是不定时地。如果您正确使用本指标, 在趋势变化时, 您将将已经入场 (参看下面的调整)。 回调 但凡趋势在运动中,行情上下抖动,盈利者收割利润,且其它参与者入场。趋势回调代表好的买入机会,通常是由主力获利离场导致。如果行情在回调后回归上行, 指标将
Power Candles MT5
Daniel Stein
4.58 (12)
Power Candles V3 - 自我优化的强度指标 Power Candles V3 把货币与品种的强度直接转化为图表上可执行的交易方案。指标不再仅根据强度给K线着色,而是在后台持续运行实时自动优化,为您正面对的品种给出最佳 Stop Loss、Take Profit 与信号阈值。一键采用,Entry、Stop Loss、Take Profit 线就以精确价格绘制在图表上,提醒消息中直接包含方向。 本工具是 Stein Investments 生态系统的一部分 - 18+ 款工具,加上 Max,您的一对一 AI 交易导师。  随时在线,深入了解每一款指标,在您需要梳理思路的那一刻就在那里。  立即认识他: https://stein.investments 每根收盘K线运行 3,000+ 次交易模拟。9 种强度状态。2 种策略并行测试。一键采用最优配置。 为什么需要这个 大多数强度指标只给您一个数值,然后留下三个问题:相信哪个阈值、用哪个 Stop Loss、走哪个交易方向。Power Candles V3 在每根收盘K线上自动回答这些问题。结果就是一个完整的交易方案 -
IQ FX Gann Levels a precision trading indicator based on W.D. Gann’s square root methods . It plots real-time, non-repainting support and resistance levels to help traders confidently spot intraday and scalping opportunities with high accuracy. William Delbert Gann (W.D. Gann) was an exceptional market analyst, whose trading technique was based on a complex blend of mathematics, geometry, astrology, and ancient mathematics which proved to be extremely accurate. We don't offer free or bonus indic
RelicusRoad Pro MT5
Relicus LLC
4.96 (24)
RelicusRoad Pro: 量化市场操作系统 终身访问限时 70% 折扣 - 加入 2,000+ 交易员社区 为什么大多数交易者即使拥有“完美”指标也会失败? 因为他们在真空中交易 单一概念 。没有背景的信号是赌博。要持续获胜,您需要 共振 (CONFLUENCE) 。 RelicusRoad Pro 不是一个简单的箭头指标。它是一个完整的 量化市场生态系统 。它描绘价格运行的“公允价值之路”,区分市场噪音和真实的结构性突破。 停止猜测。开始用机构级“路”逻辑进行交易。 核心引擎:“Road” (路) 算法 系统的核心是 Road Algo ,一个实时适应市场条件的动态波动率通道。它投射出 安全线 (平衡) 和价格可能反转的 扩展水平 。 Simple Road: 典型市场的标准结构映射。 Smooth Road: 针对震荡盘整的降噪计算。 Breakout Road: 专为识别波动率扩张和爆发性走势而调整。 1. 算法动量与确认 我们的“剥头皮箭头”不只是简单的交叉。它们利用 高阶多项式逻辑 过滤噪音,确保信号与主周期一致。我们检测动量、价格行为和 Road 结构汇聚的精确入场
ATstrong
Zaha Feiz
5 (1)
ATSTRONG PRO: 市场结构与突破指标 突破检测引擎 | 5个动态TP目标 | 实时仪表板面板 | 不重绘 首发价格 当前价格: $59 — 每售出10份价格增加$10。 ATSTRONG PRO 是一款专为 MetaTrader 5 设计的高级突破和机构市场结构指标。 它能够检测高概率波段枢轴,识别集群的支撑和阻力堆积区,并实时发送结构破坏(BOS)和特征改变(CHoCH)信号。 该指标会自动在您的图表上绘制动态止损和5个不同的止盈水平(TP1到TP5), 并配有风险回报预测框、星级信号质量评级以及图表上的实时绩效分析仪表板。 交易提示: 这是一款用于手动交易和市场分析的指标。它在K线收盘时显示清晰的视觉信号、水平和警报,并且 完全不重绘 。它不执行自动交易。 核心亮点与特性 智能突破引擎: 同时检测集群水平区域突破和单波段枢轴突破(BOS / CHoCH)。 突破强度评分: 评估动能、成交量/K线实体大小和枢轴质量,以过滤虚假突破和诱多/诱空。 5阶段止盈水平: 预测可自定义的R倍数目标(TP1: 0.5R, TP2: 1.0R, TP3: 1.5R, TP4:
PZ Divergence Trading MT5
PZ TRADING SLU
3.71 (7)
棘手的发现和频率稀缺是最可靠的交易方案之一。该指标使用您喜欢的振荡器自动查找并扫描常规和隐藏的发散。 [ 安装指南 | 更新指南 | 故障排除 | 常见问题 | 所有产品 ] 容易交易 发现常规和隐藏的分歧 支持许多知名的振荡器 根据突破实现交易信号 显示适当的止损和获利水平 可配置的振荡器参数 可自定义的颜色和尺寸 按条形过滤大小差异 实现绩效统计 它实现了电子邮件/声音/视觉警报 为了提供广阔的市场前景,可以使用不同的振荡器在同一张图表中多次加载该指标,而不会产生干扰。该指标支持以下振荡器: RSI CCI MACD OSMA 随机 动量 很棒的振荡器 加速器振荡器 威廉姆斯百分比范围 相对活力指数 由于差异可能会扩大很多,尤其是在外汇市场中,因此该指标产生了转折:它在等待交易突破之前等待donchian突破确认差异。最终结果是带有非常可靠的交易信号的重新粉刷指示器。 输入参数 幅度:用于寻找差异的之字形周期 振荡器-选择要加载到图表的振荡器。 突破期-交易信号的突破期,以柱为单位。 发散类型-启用或禁用发散类型:隐藏,常规或两者。 最小散度单位为条形-最小散度单位为条形
作者的更多信息
OrderBlockDetector
Basharat Umar Khan
Short description: Automatically detects bullish and bearish Order Blocks from volume-pivot analysis and draws them as clean, flicker-free boxes with an average price line. Full description Overview OrderBlockDetector locates institutional Order Blocks — the last opposing candle before a strong volume-driven move — using a volume-pivot algorithm instead of simple candle-pattern heuristics. Each detected block is drawn as a shaded zone with a border and a midline (average price), and is automati
FREE
Short description   Right-anchored, flicker-free Volume Profile with POC/VAH/VAL lines, tick-throttled updates, and zero measurable lag even on fast, high-volume symbols. Full description Anchored Volume Profile draws a fixed-range volume histogram from a chosen start date through to the live, forming bar — pinned to the right edge of your chart like the panels in TradingView, and built to stay smooth even on fast-moving, high-tick-volume symbols. KEY FEATURES - Fixed-range profile anchored to a
FREE
Draggable Volume Profile
Basharat Umar Khan
5 (1)
Short Description Drag two lines to any chart range for an instant Fixed-Range Volume Profile (POC, Value Area VAH/VAL) featuring Delta Coloring, Developing Profile tracking, Initial Balance, HVN/LVN, and Retest Rays. Detailed Description The Fixed-Range Volume Profile & Delta Analyzer answers a foundational market structure question: At which price did the most trading activity actually occur within a specific timeframe? Simply drag the two vertical reference lines ( START and END ) anywhere o
FREE
Short description GBPUSD Gamma Exposure (GEX) Profile from CME B6 Options — Call Wall, Put Wall & Zero-Gamma Flip, Live on Chart Reads a Barchart CME British Pound (B6) options CSV, solves Black-76 implied volatility per strike, and renders a right-anchored dealer GEX profile directly on your GBPUSD chart — with continuously updating Call Wall, Put Wall, and Zero-Gamma flip levels. Full description See where dealer hedging flow is likely to pin, accelerate, or reverse price — before it happens.
FREE
Session Profiles
Basharat Umar Khan
Short Description Draws rolling Time-Price-Opportunity (TPO) and footprint volume profiles for the Asia, London, and New York sessions with POC/VAH/VAL levels, delta volume bias, order flow overlays, liquidity heatmaps, developing rolling lines, Naked POC (NPOC) tracking, Initial Balance breakouts, multi-session confluence zones, and automatic broker GMT-offset detection. Full Description Plots separate market-profile and volume-profile style histograms for the three major trading sessions (Asi
FREE
HTF Open Markers + ICT Silver Bullet Zones — Usage & Strategy Guide What it draws Session 1 / Session 2 lines : vertical lines at the open of every bar on two independently configurable higher timeframes (defaults: H4 and D1), including a projected line for the rest of today's not-yet-opened bars on sub-daily timeframes, so you can see where the next candle will open before it happens. ICT Silver Bullet zones : shaded rectangles over the three classic ICT kill-zone windows, converted from New Yo
FREE
Short description Plots a repeating grid of round-dollar levels on ETHUSD — labeled Wall / Hot Zone / Exit / Trap by their typical institutional role — tuned for lower timeframes (M1 through H1). Full description Draws horizontal reference lines at 10 intervals around the current ETHUSD price, based on the idea that round-dollar levels (multiples of $100, and near-round levels like $X20/ X80, $X50, $X10/$X90) tend to act as psychological reaction zones where liquidity and stop-hunts commonly clu
FREE
Volume Zone Analyzer
Basharat Umar Khan
Volume Zone Analyzer — VSA-Based Volume, Delta & Spread Reader Turn any price zone into a Volume Spread Analysis. Drop two draggable lines on your chart to mark a Zone Start and Zone End , and Volume Zone Analyzer instantly breaks down what happened inside that zone: Total Volume for the selected range Buy / Sell Delta — estimated from where each candle closes within its own high-low range Delta % with a visual buy/sell ratio bar Average Spread , plus a count of wide vs. narrow-spread candles (t
FREE
PriceLevels HTF
Basharat Umar Khan
Short description: A higher-timeframe round-number grid for major Forex pairs — major whole-number levels, monthly midpoints, and quarter levels (with optional eighths), spanning a wide configurable pip range. Built for H4 and above. Full description: Plots a large-scale psychological-level grid across whole numbers, half-levels, and quarters — the higher-timeframe counterpart to intraday round-number analysis. Designed for swing and position-level context on H4 and above , not for scalping time
FREE
PriceLevels
Basharat Umar Khan
NOTE:   DONT BUY THIS PRODUCT, THIS IS INDICATOR IS ALREADY AVAILABLE FOR FREE YOU CAN CHECK IT WITH NAME -  PRICE LEVELS LTF     BUY ONLY IF YOU LIKE THE OTHER INDICATORS AND WANT TO SUPPORT US!!!     IF YOU DONT LIKE THE INDICATOR PLEASE LEAVE A COMMNET ON THAT SO THAT OTHERS WILL NOT WASTE TIME ON THAT INDICATOR This indicator draws horizontal reference lines at fixed 100-pip intervals, based on the classic idea that round numbers (.000, .500) and near-round numbers (.100/.900, .200/.800) ten
筛选:
无评论
回复评论