Lattice Vision

LATTICE VISION™


THE MOST ADVANCED ORDER-NETWORK ANALYSIS TOOL ON MQL5.


Not a claim. A position backed by published, independently testable fidelity data.


Discover with Lattice Vision™. Deploy with Lattice Command™. One engine. Two instruments. One continuous workflow.


Lattice Vision is the original level-trading analysis tool — Grid Trading 2.0, engineered properly. When you find a configuration in Vision, the matching live engine produces the same trades. Eighteen test configurations covering filters, signal modes, stop-loss variants, consolidation, ghosting, and direction control — tested on MetaQuotes-native 1-minute USDJPY data with the platform's default symbol properties and a constant 2-pip spread. Eighteen of eighteen tests match exactly between Vision's predicted trade count and Command's true engine output. Zero aggregate drift across 3,790 trades. One hundred percent directional and mechanism alignment. Reproducible by any MT5 user with a generic MetaQuotes USD demo account — no third-party data downloads required.


→ Read the full Fidelity Report (published openly, free to download):

https://drive.google.com/drive/folders/19txtz0FCf2AitpHxllzG8OxELexszbrV?usp=sharing


That isn't marketing language. The full methodology and complete results are published below. Read it before you spend money on any execution suite that doesn't show you the same proof.


Lattice Vision is the analysis layer — years of price data, dozens of configurations, real-time recalculation, every metric that matters. Lattice Command is the execution layer — same engine, same outputs, full risk-control architecture. Use Vision standalone for parameter discovery. Pair it with Command for the only end-to-end workflow on MQL5 with a publicly documented fidelity matrix between the two engines.


Latest update — session-timing filters added for study isolation across configurable days and hours. Compare configurations against full sessions, weekday-only windows, or specific trading hours.


If you need help getting set up to perform a study, message us directly. Cave & Fire Lab is hands-on with every customer.


(Contact via DM after purchase for full PDF guide.)


Professional Order-Network Analysis & Parameter Discovery Tool for MetaTrader 5.


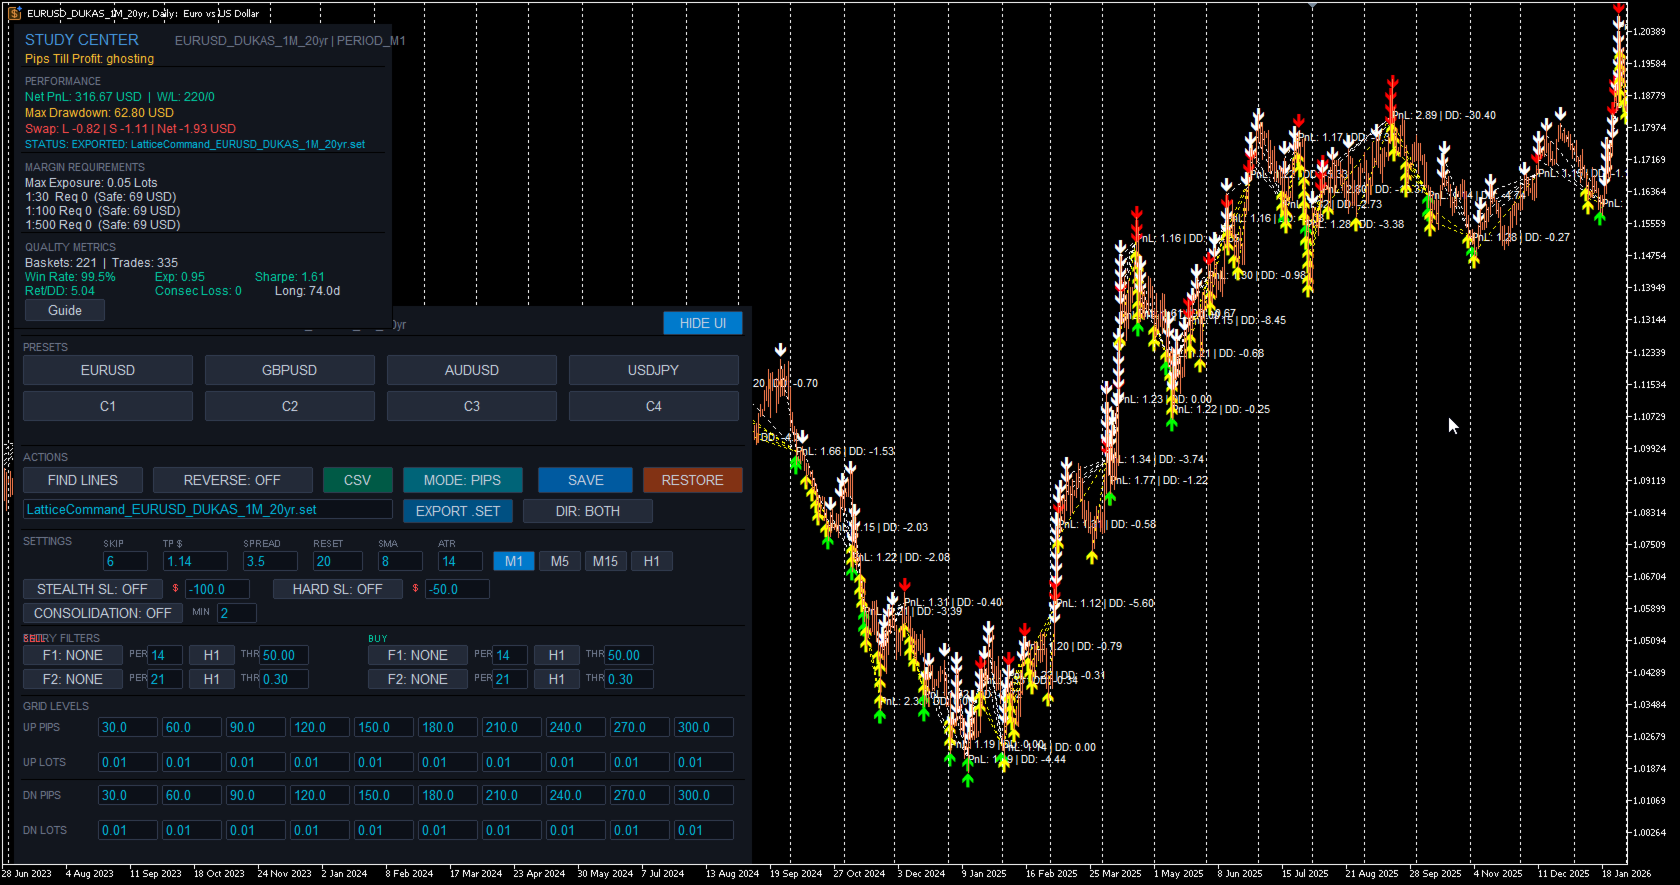
Lattice Vision™ is a visual analysis and parameter-discovery tool for MetaTrader 5. It simulates how price interacts with configurable order-network structures across historical data — allowing you to observe basket behaviour, measure risk characteristics, and refine your configuration before committing capital.


No orders are placed. No signals are generated. This is a professional analysis instrument.


---


OVERVIEW


Lattice Vision™ provides a structured, non-executing environment for observing how price interacts with order networks across any amount of historical data.


It provides:


- Instant visual simulation of order-network basket behaviour across years of data


- Ghosting Technology™ — a proprietary trigger-filtering system that lets you observe how skipping early interactions changes outcome profiles


- Comprehensive analytics with colour-coded risk thresholds


- Dual distance mode: fixed-pip or ATR-adaptive level spacing


- Real-time parameter adjustment with immediate recalculation


- CSV export for external analysis


- Preset system for saving and comparing configurations


Instead of waiting hours for backtests, you get a bird's-eye view of how your parameters behave across different market conditions — years of data rendered instantly on a single screen. Adjust a distance, change a lot size, toggle a mode, and watch the impact ripple across the entire dataset in real time.


---


FIDELITY REPORT — VISION ↔ COMMAND


This is the proof that defines the Lattice category.


Lattice Vision and Lattice Command share a single level-trading engine running in two different environments. Vision processes historical bars in a study window. Command runs in MT5's strategy tester or live account, executing on closed bars and using ticks only for measuring price drift and tracking account balance. These are fundamentally different execution contexts — and we engineered the pair from day one to deliver the same outcome from the same configuration. What you see in the study is what you get in the deploy.


The proof:


- 18 configurations tested across filters, signal modes, stop-loss variants, consolidation, ghosting, and direction control


- 12 months of MetaQuotes-native USDJPY 1-minute data (9 March 2025 → 9 March 2026) — the bars every MT5 user has access to from their generic MetaQuotes USD demo account


- MetaQuotes-default symbol properties — contract size, tick value, margin requirements, swap rates all sourced from the same platform that supplies the bars


- Constant 2-pip spread applied throughout, Open Prices Only tester model


- 18 of 18 tests match exactly between Vision's predicted trade count and Command's true engine output


- Zero aggregate drift across 3,790 trades


- 100% directional alignment — every test produces trades in the expected direction


- 100% mechanism alignment — every filter, signal mode, stop-loss variant, and lattice mode behaves correctly in both engines


Why MetaQuotes-native data: engine-vs-engine fidelity is a measurement of whether Vision and Command run the same logic on the same input. For that measurement to be clean, the input must be unambiguous — bar data and symbol properties must come from the same source. MetaQuotes-native data satisfies this condition: the bars and the USDJPY symbol specs both come from the MetaQuotes platform, so the engines are operating on a self-consistent input. Imported third-party historical bars (Dukascopy etc.) introduce a second variable — bars from one source, symbol specs from whichever broker the platform is configured for — and any drift observed there could be either an engine difference or a bar-vs-spec mismatch. Native data isolates the measurement to engine fidelity. That is why the matrix is run this way and that is why the result is 18 of 18.


A note on the MT5 Strategy Tester Results pane: the closed-position count shown in the Results pane reflects MetaTrader's own deal-level event accounting and may differ from the engine's structural trade count due to broker-side execution artefacts. The Results pane is useful for evaluating live-trading execution conditions; the journal's structural counter is the figure that aligns with Vision's panel. Both numbers are documented in the report so you can see exactly how each one is constructed.


The complete report — methodology, full test matrix, per-test results, account/symbol-property conditions, and the why-MetaQuotes-native interpretation — is published openly and free to download:


https://drive.google.com/drive/folders/19txtz0FCf2AitpHxllzG8OxELexszbrV?usp=sharing


This is an engineering position, not a marketing promise. Any future change to either engine that breaks the matrix beyond reported tolerances blocks release until resolved. The methodology is reproducible by any MT5 user — you don't have to take our word for it.


When fidelity between analysis and execution matters — and it should — this is what the bar looks like.


---


INTENDED USE


Designed for:


- Order-network and basket traders seeking a visual parameter-discovery tool


- DCA traders refining entry spacing and lot progression


- System developers designing and validating execution parameters


- Prop-firm traders testing configurations against drawdown constraints


- Risk-focused traders who want to understand drawdown characteristics before deploying


- Anyone who wants to see how an order-network structure behaves before committing capital


This is not a beginner signal tool. It assumes familiarity with position sizing, price movement, spread impact, and drawdown management.


---


GHOSTING TECHNOLOGY™ — PROPRIETARY TRIGGER FILTERING


Ghosting Technology™ is the defining innovation of Lattice Vision™. It fundamentally changes how you evaluate order-network configurations by letting you observe the impact of filtering early interactions.


The problem: when price first enters an order network, the initial interactions are often noise — premature triggers during unstable conditions before price has committed to a direction. Traditional analysis treats every crossing equally. Ghosting Technology™ lets you define how many initial interactions are observed but excluded from active simulation.


These "ghost" triggers are tracked and displayed on the chart as distinct markers (yellow/white arrows), but no simulated position is created. Only after the ghost threshold is reached do subsequent interactions become active. All P&L and metrics are calculated only from the live (non-ghosted) interactions.


The result: you can instantly observe how different ghost counts change your outcome profile, drawdown characteristics, and win rate across the entire dataset. Find the threshold where filtering noise produces a tighter, more resilient configuration — before risking a single dollar.


The ghost count is fully adjustable in real time. Change it and watch the entire study recalculate instantly. This makes Ghosting Technology™ tangible and intuitive — not just a number in a settings panel, but a visual filter you can see working on the chart.


---


CORE FEATURES


Visual Study Range


Define your analysis window using two draggable chart markers. Everything updates dynamically as you move them. Extend the range into live price action for forward observation, or narrow it to isolate a specific market regime. The FIND LINES button snaps markers to your current chart view with a single click.


20-Level Order-Network Configuration


Up to 20 price interaction levels — 10 upper (sell side) and 10 lower (buy side). Every level has independent spacing and independent lot sizing. Build uniform structures, progressive configurations, regressive profiles, or fully asymmetric layouts. Complete control over the shape of your order network.


ATR Adaptive Mode


Switch between fixed-pip distances and ATR-based multiples with a single toggle. In ATR mode, level spacing automatically widens in volatile conditions and tightens in calm markets, keeping your order network proportional to actual market movement. The ATR period is configurable. Basket TP can also be expressed in ATR multiples, with the effective dollar value shown in the Study Center. Compare both modes across the same data range to understand which suits each instrument.


Multi-Timeframe Anchor


Lock the SMA reference calculation to any timeframe (e.g. M1) while viewing results on any chart resolution. Watch simulated baskets on Daily, Weekly, or Monthly charts for the macro view while maintaining lower-timeframe precision. Analyse decades of data without sacrificing calculation accuracy.


Periodic Lattice Recalibration


The order network automatically recentres on the SMA reference at configurable intervals measured in bars. This keeps the structure aligned with evolving price action rather than anchored to a stale level. The recalibration interval is adjustable in real time.


Direction Inversion


Reverse the simulation direction with a single toggle. Upper crossings become buy signals, lower crossings become sell signals. Instantly observe how a contrarian approach performs across the same data range and network structure.


---


ANALYTICS & MEASUREMENT


Real-Time Study Center


A comprehensive analytics panel that updates instantly as you adjust any parameter. Displays: net PnL, win/loss count, win rate, maximum drawdown, peak exposure, expectancy, return-to-drawdown ratio, Sharpe ratio, maximum consecutive losses, and longest basket duration. All values in account currency with colour-coded risk thresholds — green for healthy, amber for caution, red for elevated.


Pips Till Profit


Shows exactly how many pips the current simulated basket needs to move to reach the target threshold, along with the precise target price level. Gives you an intuitive, real-time feel for how close or far each cycle is from completion.


Swap Cost Simulation


Estimated swap costs are calculated and included in basket PnL based on long and short swap rates. Provides more realistic outcome measurements for configurations that hold positions across multiple days.


Margin & Capital Requirements Guide


Reference estimates for capital requirements under common leverage conditions — 1:30, 1:100, and 1:500. Calculates margin required for maximum possible exposure based on your configured lot sizes across all 20 levels. Informational guidance only — not a broker guarantee.


Configurable Spread Assumption


Set a spread value to include transaction cost modelling in all measurements. Adjustable in real time — observe how sensitive your configuration is to transaction costs.


Integrated Metric Guide


Built-in explanations for every measurement in plain language with colour-coded threshold values: what it represents, why it's relevant, how to interpret it, and what typical acceptable ranges look like. Accessible directly from the interface with a single click.


---


VISUAL ANALYSIS


Basket Lifecycle Visualisation


Every completed basket cycle is rendered directly on the chart with colour-coded markers — green for profitable closures, red for losses, with PnL annotations. See at a glance where clusters of success or failure occur, which market regimes produce favourable outcomes, and how behaviour changes across different conditions.


Ghost vs Active Markers


Ghosted (filtered) interactions are visually distinct from active ones directly on the chart. You can see exactly which price crossings were observed but filtered during the Ghosting Technology™ phase, and which resulted in simulated positions.


Order-Network Level Display


Upper and lower interaction levels are displayed as colour-coded horizontal lines on the chart, showing exactly where the order network sits relative to current and historical price action. The structure updates in real time as parameters change.


Interactive Study Range


Define and adjust your analysis window visually using draggable chart markers. All calculations update immediately as you move them.


---


PRESET SYSTEM


Three-Profile Preset System


Each symbol supports three independently saved configuration profiles. Store conservative, moderate, and aggressive setups — or any three configurations you want to compare. Save distances, lot sizes, ghost count, target threshold, and distance mode with a single click. Recall and compare instantly. Presets persist across sessions.


One-Click CSV Export


Export complete study results in CSV format. Each row represents one basket cycle with: basket ID, timestamps, total volume, PnL, maximum drawdown, and interaction count. Files saved to MQL5/Files/ — compatible with Excel, Google Sheets, Python, R, or any CSV reader.


SET File Export & Import


Export your full configuration as an MT5-compatible .SET file ready to load directly into Lattice Command™ or the MT5 strategy tester. Import .SET files saved from Command back into Vision to re-examine live configurations on historical data. The export/import bridge is what makes the discover-deploy loop seamless.


Save & Restore


Save your current working configuration or restore factory defaults at any time. Experiment freely knowing you can snap back to a known-good state with one click.


---


INTERFACE & CONTROLS


Bloomberg-Inspired Terminal Design


Clean, professional dark interface designed for extended use. Structured sections with clear headers and visual dividers. Parameters, presets, actions, and study results all accessible from a single on-chart panel without opening dialogs or restarting the tool.


Live Parameter Editing


All key parameters are editable directly from on-chart input fields: distances, lot sizes, ghost count, target threshold, spread assumption, reset interval, and SMA period. Change any value and the entire study recalculates instantly across your full data range.


Collapsible UI


Toggle the entire interface on and off with a single button. When hidden, your chart is completely unobstructed. When shown, every control and metric is immediately accessible.


---


STUDY PARAMETERS


SKIP — Number of initial interactions to ghost before live counting (Ghosting Technology™)


TP $ / TP ATRx — Basket profit target (account currency or ATR multiples)


SPREAD — Assumed spread in pips for transaction cost modelling


RESET — Minimum bars between order-network repositioning


SMA — Anchor SMA period for reference calculation


ATR — ATR lookback period (ATR mode only)


MODE — Toggle between PIPS and ATR adaptive mode


Timeframe — Study timeframe for SMA anchor (M1, M5, M15, H1)


SCHEDULE — Optional session-timing filter with per-day toggles, hour-of-day window, and midnight buffer (disabled by default)


All changes recalculate immediately.


---


BASKET LOGIC


Price crosses an order-network level and an interaction is recorded. If within the ghost threshold, the interaction is tracked but no simulated position is created. Once past the ghost threshold, subsequent crossings create simulated positions. The basket accumulates as price expands through additional levels. When combined profit of active (non-ghosted) positions reaches the basket TP, the basket closes. One basket active at a time. After closure, the engine waits for the reset-bar cooldown before forming a new anchor.


Each basket tracks entry prices, running PnL, drawdown, lot exposure, and interaction count.


---


USE CASES


Rapid Parameter Discovery — Test configurations in seconds instead of hours. Adjust distances, lot sizes, ghost counts, and modes and watch outcomes update instantly across years of data.


Ghost Count Optimisation — Experiment with different Ghosting Technology™ thresholds to find the sweet spot between filtering noise and maintaining enough active interactions. See exactly how each ghost count changes the outcome profile across your entire dataset.


Volatility Mode Comparison — Toggle between PIPS and ATR distance modes to compare fixed versus volatility-adaptive spacing across the same market data.


Drawdown & Exposure Profiling — Identify exactly when and where configurations produce maximum adverse movement. Use this to set appropriate risk thresholds or to eliminate configurations that exceed your tolerance.


Parameter Sensitivity Testing — Nudge individual parameters and watch the impact across the entire dataset. Find stable zones where small changes don't dramatically alter outcomes — a sign of robustness rather than curve-fitting.


Multi-Instrument Screening — Rapidly evaluate the same configuration across multiple symbols. Use presets to store per-symbol optimised settings. Export CSV results for cross-instrument comparison.


Prop-Firm Parameter Validation — Review maximum drawdown, peak margin usage, and capital requirements against funded-account constraints.


---


COMPATIBILITY NOTE


Lattice Vision™ is a complete, standalone analysis and parameter-discovery tool. The visual insights, analytics, and exported data are fully valuable on their own — whether you execute manually, use your own EA, or any other method.


For users who also use Lattice Command™ (available separately), parameter structures are compatible between the two products and engine fidelity is independently documented in our published Fidelity Report (link above). This is a convenience, not a requirement — Lattice Vision™ is designed to inform any execution approach, not just one.


---


EXAMPLE WORKFLOW


1. Visualise on any timeframe


2. Lock the SMA anchor to your chosen SMA timeframe


3. Set your study range across sufficient historical data


4. Configure order-network distances and lot sizes and adjust, see your changes dynamically


5. Use Ghosting Technology™ to test whether filtering early interactions produces a tighter, more resilient profile


6. Try ATR mode on instruments with variable volatility


7. Compare configurations using presets


8. Export results for deeper analysis


Focus on drawdown before profit.


---


WHAT LATTICE VISION IS NOT


Lattice Vision™ is not an Expert Advisor — it does not place orders.


It is not a signal service.


It is not a profit guarantee.


It is not financial advice.


It is a professional analysis and parameter-discovery tool.


---


SYSTEM REQUIREMENTS


MetaTrader 5 (build 2000+), any compatible broker, any symbol with sufficient price history.


---


RISK DISCLAIMER


This tool is for analysis and parameter discovery. It does not guarantee profits and does not place trades.


Simulated results are based on historical data and user-defined parameters. They do not represent actual trading and may not reflect real market conditions including slippage, requotes, liquidity constraints, and execution delays.


Users are responsible for understanding the risks involved, validating any configuration with proper testing, testing on demo accounts before live deployment, and never trading with money they cannot afford to lose.


Trading forex and CFDs involves substantial risk of loss and is not suitable for all investors. Past performance — whether observed through this software or any other method — is not indicative of future results.


---


TRADEMARKS & LEGAL


Lattice Vision™, Lattice Command™, and Ghosting Technology™ are common law trademarks of Cave and Fire Group Pty Ltd.


© 2025–2026 Cave and Fire Group Pty Ltd. All rights reserved.


Cave & Fire Lab is a trading name of Cave and Fire Group Pty Ltd., a software development company. We are not a financial services provider, broker, fund manager, or advisory firm. We do not provide financial advice, trading signals, or recommendations of any kind.


MetaTrader 5 and MQL5 are registered trademarks of MetaQuotes Ltd. This product is not affiliated with, endorsed by, or sponsored by MetaQuotes Ltd.


All other trademarks are the property of their respective owners.


推荐产品
Pump Liquidity Refueling
Konstantin Meshcheriakov
PUMP V3_0 Liquidity Refueling — Refueling Your BalanceWhat is "Liquidity Refueling"? Think of the Forex market as a highway and liquidity as the fuel.  When institutional players "pour" massive volume into the market, the price makes a sharp surge — an impulse or a "pump."  The PUMP V3_0 EA acts as a smart fueling station: it identifies moments of maximum market energy and "pumps" that momentum directly into your trading account.   Performance Metrics (Strategy Tester Data):Net Profit "Pumped"
FREE
MT Monster
MASSINISSA AINOUZ
This EA has been backtested with real ticks since January 2012 untill March 2025, with no delay in execution, and then with a delay of 1000ms, the backtest showed a drawdown of 30% with a 10k USD backtest account. The EA default parameters are optimised to work best on EURUSD pair, but can work on other currencies and metals like XAUUSD. Before using this EA and in order to not lose all your money make sure you have at least 5000USD in your account. Do not use another EA with this one on the sam
Free automatic Fibonacci is an indicator that automatically plots a Fibonacci retracement based on the number of bars you select on the BarsToScan setting in the indicator. The Fibonacci is automatically updated in real time as new highest and lowest values appears amongst the selected bars. You can select which level values to be displayed in the indicator settings. You can also select the color of the levels thus enabling the trader to be able to attach the indicator several times with differe

FREE
Nikkei225 Gap ContinuationEA
Francesc Jordi Mallol Nolden
Nikkei 225 Gap Continuation EA Automated opening-gap continuation strategy for the Nikkei 225 Nikkei 225 Gap Continuation EA is an automated trading system for MetaTrader 5 designed specifically for the Japanese stock index. It searches for significant opening gaps and enters only when price action confirms a possible continuation in the same direction. The strategy combines the opening gap, a configurable opening range and session VWAP confirmation. It also includes risk-based position sizing,
FREE
Vantage Breakout
Alexandre Vincent Traber
将波动性扩张转化为结构化的分级获利了结 —— Vantage Breakout 交易自适应 ATR/SMA 突破,并通过严谨的三阶段离场系统管理每一笔持仓,已在外汇主要货币对和黄金上验证。 概览 Vantage Breakout 是一款自适应波动率突破型EA。当价格收盘价突破由简单移动平均线(SMA)加上真实波幅(ATR)倍数构建的动态通道时开仓,从而捕捉真正的动量扩张,同时过滤市场噪音。持仓开启后会被主动管理:利润会在三个基于账户余额百分比的阶段逐步锁定,并且在K线收盘时的保护机制会在浮动亏损达到设定阈值时平仓。内置的抗过度拟合评分系统确保优化结果在样本外依然稳健。 工作原理 在所选周期上计算SMA和ATR。 在SMA上下方按ATR的倍数构建突破通道。 当上一根K线收盘价高于上轨时开多单;当收盘价低于下轨时开空单。 持仓期间,浮动利润每达到三个账户余额百分比阶梯之一时,EA平掉约三分之一的仓位,让剩余仓位继续朝最终目标运行。 若在K线收盘时浮动亏损达到账户余额的设定百分比,则作为保护措施直接平仓。 开仓时始终附带硬性止损作为最后防线。 可选的移动止损功能可随行情发展收紧止损位。 输入
FREE
LT Mini Charts
Thiago Duarte
4.88 (8)
This is a utility indicator that creates mini charts on left side of the chart you are looking at. It is very useful to watch many timeframes simultaneously, without having to change between multiple charts. Its configuration is very simple. You can have up to 4 mini charts opened. They automatically load the template of the "parent" chart. If you have any doubt please contact me. Enjoy! This is a free indicator, but it took hours to develop. If you want to pay me a coffee, I appreciate a lot  
FREE
Reversal Composite Candles
MetaQuotes Ltd.
3.69 (16)
该系统的思路是通过计算复合蜡烛来识别反转形态。 反转形态类似日本蜡烛条分析的 "锤头" 和 "吊颈" 形态。但它使用符合蜡烛替代单一的蜡烛,并且不需要复合蜡烛的小实体来确认反转。 输入参数: Range - 最大柱线数量, 计算复合蜡烛时用。 Minimum - 最小复合蜡烛大小 (传统的点数)。 ShadowBig and ShadowSmall - 影线 (复合蜡烛单元)。 Limit, StopLoss and TakeProfit - 开盘价, 止损位和止盈位, 它们是相对于复合蜡烛的收盘价 (复合蜡烛单元)。 Expiration - 订单过期时间 (单位柱线), 用于挂单 (Limit!=0.0)。 反向蜡烛条形态的判别如下。 它计算复合蜡烛参数,其自最后的完整柱线 (索引为 1) 至由 Range 输入参数定义的柱线数量。如果复合蜡烛大小大于由 Minimum 输入参数指定的数值, 它分析复合蜡烛的影线检测反转条件。 空头能量的特征是复合蜡烛的上影线为零, 多头能量的特征是复合蜡烛的下影线为零。 为确认空头趋势反转 (且多头开始),需要以下检查: 下影线的大小 (多头能量
FREE
Prop News Filter
Joao Jara Carvalho
Prop News Filter is a free Expert Advisor that helps traders on prop firm and funded accounts avoid violating the 2-minute news rule that most major prop firms enforce. It uses a precise two-stage protection model: pre-block new trades 15 minutes before the restricted window, then close everything 2 minutes before the news. Most news filter tools either block trading too aggressively and kill your edge, or rely on the MQL5 native calendar which is often disabled on prop firm terminals. This EA u
FREE
Super Trend eu
Emin Ulucanli
4.83 (6)
SUPERTREND; It is a trend following indicator based on the SuperTrend ATR created by Olivier Seban. It can be used to detect changes in trend direction and locate stops. When the price falls below the indicator curve, it turns red and indicates a downtrend. Conversely, when the price moves above the curve, the indicator turns green, indicating an uptrend. Like other indicators, it works well on SuperTrend when used in conjunction with other indicators such as MACD, parabolik SAR, Bollinger Band
FREE
VFI Quantum
Nikita Berdnikov
5 (1)
Introducing VFI (Volume Flow Indicator) – a trading indicator that analyzes the relationship between volume and price movement to identify key trading opportunities. The indicator displays the strength and direction of volume flow, providing clear signals about potential entry and exit points. Signals are formed based on zero line crossovers, crossovers between the VFI line and its exponential moving average (EMA), and when the indicator exits overbought and oversold zones. Attention! This stra
FREE
This Expert Advisor is used to send messages from the PCT Multi indicator to Telegram. The EA has 5 settings: - Channel name: The name of the Telegram channel. - Token: Your bot's Token. - Entries: Entry messages will be sent. - Results: Entry results will be sent. - Alerts: Alerts will be sent. How to set up: In the Tools -> Options menu, in the "Expert Advisors" tab: - Check the "Allow WebRequest for listed URL:" option. - Click "add new URL" and add " https://api.telegram.org " (without the
FREE
Axilgo PipPiper CoPilot
Theory Y Technologies Pty Ltd
5 (2)
Axilgo Pip Piper CoPilot Elevate your trading game with the Axilgo Pip Piper CoPilot, the first in our revolutionary Pip Piper Series. This all-inclusive toolset is meticulously crafted for serious traders, focusing on key areas such as Risk Management, Trade Management, Prop Firm Rule Compliance, and Advanced Account Management . With CoPilot, you’re not just investing in a tool—you’re gaining a strategic partner in the intricate world of trading. Important Notice: To ensure you receive the fu
FREE
(Special New Year promotion - free price!) The indicator displays the actual 'Scale in points per bar' (identical to the manual setting in the Terminal, see screenshot) in the upper right corner of the chart. The displayed value changes INSTANTLY whenever the chart scale is changed! (This is very convenient when planning screenshots). In Settings: Change language (Russian/English), font size of the displayed text, text label offset coefficient from the graph corner, equally in X and Y directi
FREE
Slow RSI
Flavio Javier Jarabeck
4.8 (5)
For those who feel that regular RSI is too fast and too noisy to be used on regular trades or in EAs and want to have an alternative to meter the Momentum of the Price, here is a solution presented on the great article of the Technical Analysis of Stocks & Commodities magazine (April, 2015), by Vitali Apirine, called: Slow Relative Strenght Index . Its reading is almost the same as the regular RSI, but its levels of Overbought and Oversold are 80 and 20 instead. SRSI is very powerful to show div
FREE
Prometheus Analyst
Humphrey Mangera
PROMETHEUS TECHNICAN VERSION Free | By THE SONS A gift from The Sons — no strings, no trial, no expiry. Every trader deserves access to professional-grade market intelligence. That belief is why Prometheus Technical Version exists, and why it costs nothing. Consider it our handshake to the trading community. What You're Getting This is not a simplified tool dressed up as a gift. Prometheus Technican Version is a fully built, institutional-quality technical analysis indicator running a dual-model
FREE
Donchian Breakout And Rsi
Mattia Impicciatore
4.5 (2)
概述 本指标是经典 Donchian 通道 的增强版,增加了多种实用的交易功能。 除了标准的三条线(最高、最低和中线),系统能够检测 突破 ,并在图表上用箭头进行可视化标记,同时只显示 与当前趋势方向相反的那条线 ,让图表更加简洁。 功能包括: 可视化信号 :突破时在图表上绘制彩色箭头 自动通知 :弹窗、Push 推送和 Email 邮件 RSI 过滤 :根据市场相对强弱验证信号 个性化设置 :颜色、线条粗细、箭头符号、RSI 阈值等 工作原理 Donchian 通道计算: 上轨线 :最近 N 根已收盘 K 线的最高价 下轨线 :最近 N 根已收盘 K 线的最低价 中线 :最高价和最低价的平均值 看涨突破 :收盘价高于上轨线 看跌突破 :收盘价低于下轨线 指标会: 绘制三条 Donchian 通道线 仅在 方向变化后的首次突破 绘制箭头 隐藏顺应趋势方向的那条线(上涨趋势: 只显示红色下轨线;下跌趋势: 只显示绿色上轨线) 可选用 RSI 过滤突破信号,减少虚假突破 支持实时发送通知 参数说明 Donchian 通道设置 indPeriod :计算通道高低点的已收盘 K 线数量 Lin
FREE
Follow The Line MT5
Oliver Gideon Amofa Appiah
4.6 (35)
This indicator obeys the popular maxim that: "THE TREND IS YOUR FRIEND" It paints a GREEN line for BUY and also paints a RED line for SELL. (you can change the colors). It gives alarms and alerts of all kinds. IT DOES NOT REPAINT and can be used for all currency pairs and timeframes. Yes, as easy and simple as that. Even a newbie can use it to make great and reliable trades. NB: For best results, get my other premium indicators for more powerful and reliable signals. Get them here: https://www.m
FREE
Strong movement levels
Nikolay Mitrofanov
5 (2)
Looks for strong price movements and draws levels upon their completion. You determine the strength of the movement yourself by specifying in the settings the number of points and the number of candles of the same color in a row in one direction. There are 2 types of building in the settings: extrenum - high / low close - close price You can also adjust the number of displayed levels and the number of candles for calculations. By default, the settings indicate 5 levels for 360 candles. That
FREE
Inverse Liquidity Grab Ultimate EA
Stephen Muriithi Muraguri
5 (1)
This EA finds Fair Value Liquidity (FVL) on the chart, tracks when they get mitigated , and then looks for an inversion signal (price “fails” through the zone). When that inversion happens, it places a trade in the opposite direction of the original Liquidity gap (an Inverse FVG approach). It also lets you control when it trades using market sessions , and it can auto-close positions at New York open (all positions or profitable-only). Key advantages Clear, rule-based entries (no guessing): trad
FREE
Simple Weis Wave
Jean Jacques Huve Ribeiro
3.67 (3)
One of the best tools for analyzing volume, Weis Wave was idelized by David Weis, to facilitate the reading of directional flow. For the VSA method disciples it is an evolution of the practices created by Richard Wycoff, facilitating a predictive reading of the market, always seeking an accumulation and distribution of the negotiated contracts. Cumulative wave volume  Range of wave ( removed) Average Wave volume Ref "Tim Ord lectures" ( removed)
FREE
Hi you, I need your help! Be my Patron, let's make it possible! https://www.patreon.com/joaopeuko https://github.com/Joaopeuko/Mql5-Python-Integration Channel: English version - Versão Inglês: https://www.mql5.com/en/channels/Mql5_Python_Integration_EN Portuguese version - Versão Português: https://www.mql5.com/en/channels/Mql5_Python_Integration_PT Free version with 5 indicators: https://www.mql5.com/en/market/product/57574 This version has 38 indicators, 5 from the free version plus
FREE
Gold VWAP Drift
Ubaldo Barranco Jimenez
Gold VWAP Drift is a complete, self-contained trading system for XAUUSD , engineered around one of the most reliable structural relationships in intraday gold: the interaction between price, the session Volume-Weighted Average Price, and a dynamic trend filter. It does not chase breakouts and it does not guess tops or bottoms. It waits for the market to show its hand, then acts with precision. The system establishes a clear directional bias using a long-term trend filter, then engages only when
FREE
Echelon EA
Daniel Suk
5 (1)
Echelon EA – Chart Your Unique Trading Constellation Like the celestial guides that lead explorers through the vast universe, Echelon EA empowers you to create and optimize your very own trading strategies. This versatile system combines advanced grid and martingale techniques with cutting‐edge indicators, offering you an endless palette for designing a strategy that is truly your own. Craft Your Personal Strategy: Infinite Possibilities – Customize every parameter to build a trading system t
FREE
Wallstreet Pro EA
Leonit Ajvazi
3 (2)
Symbol                                       XAUUSD, AUDUSD Period                                        H1 timeframe Retail support                            YES Minimum deposit                       1000 USD (or the equivalent amount in another currency) Compatible with all brokers      YES (supports any account currency) Works without preset                YES Symbol XAUUSD, AUDUSD Period (Timeframe) H1 timeframe Retail support YES Minimum deposit 1000 USD (or the equivalent amount in ano
FREE
Correlation Matrix Pro - 多货币相关性分析 实时了解货币对之间的相关性! 一款强大的分析工具,可帮助您同时可视化多达6个货币对之间的统计关系。非常适合投资组合管理、风险分散和对冲策略。 主要功能 - 使用对数收益率的实时皮尔逊相关性 - 同时监控多达6个货币对 - 自动时间框架检测 - 可调回溯周期(5-200根K线) - 自动对冲机会检测 - 简约可折叠面板设计 - 颜色编码矩阵,即时解读 颜色编码 绿色 (+0.70 至 +1.00) = 强正相关 浅绿色 (+0.50 至 +0.69) = 中等正相关 灰色 (-0.49 至 +0.49) = 弱/无相关 橙色 (-0.50 至 -0.69) = 中等负相关 红色 (-0.70 至 -1.00) = 强负相关(对冲) 为什么要关注相关性? 风险管理 避免通过高度相关的头寸使风险加倍。 对冲策略 自动找到具有强负相关性的货币对进行有效对冲。 投资组合多元化 使用低相关性货币对构建多元化投资组合。 相关性突破 检测背离——通常是即将到来的市场变动信号。 输入参数 显示设置: - 面板 X/Y 位置 - 启动时
FREE
Advanced MTF High Low
Felipe Monteiro Rodrigues
Advanced MTF High Low 是一款多时间周期结构分析指标,可自动识别不同周期(月线、周线、日线、H4、H1 等)的重要高点和低点,并将这些水平投射到当前较低时间周期的图表中。 该指标旨在帮助交易者快速识别重要的机构支撑与阻力区域,通过使用高时间周期的真实极值点来分析市场。水平线将持续显示,直到被价格触及并消化,从而为交易者提供清晰的流动性和市场结构视图。 主要功能 自动检测多个时间周期的高点和低点。 同时显示月线、周线、日线和日内关键水平。 直观显示每个水平的来源时间周期。 动态高效更新,CPU 占用低。 智能消化系统,自动移除已被测试或突破的水平。 兼容 MetaTrader 5 的所有品种和时间周期。 可配置快捷键,一键显示或隐藏所有指标水平(当前为 N 键)。 共振系统 当两个或多个时间周期的高点或低点非常接近时,指标会自动识别并形成更具结构意义的共振区域。 细线 表示仅来自一个高时间周期的高点或低点。 例如:仅 H4 高点或仅日线低点。 粗线 表示来自两个或多个时间周期的高点或低点集中在较低时间周期同一根K线附近的共振区域。 例如:周线高点接近月线高点,或日线低
FREE
Rise of the Beasts
Bin Jumahat Johan
Rise of the Beasts – SuperTrend Auto-Trading EA Rise of the Beasts is a powerful, fully automated Expert Advisor that unleashes trend-following precision using the legendary SuperTrend indicator . Built for traders who want clean entries, smart exits, and consistent results, this EA dominates markets by identifying trend shifts with accuracy and acting instantly. Whether you trade forex, indices, metals, or crypto , Rise of the Beasts adapts to any market with strong risk control and volatili
FREE
Expert Advisor (EA) that utilizes the basic Dow Theory strategy along with RSI for take profit, and employs support and resistance levels from the Zigzag indicator as stop-loss and take-profit points, you can follow these guidelines: Dow Theory Strategy : This involves analyzing trends using the Dow Theory principles, mainly focusing on identifying primary trends (bullish or bearish) and secondary trends (corrections). You'll need to implement rules for identifying these trends based on price ac
FREE
Lot Size Ruler
Joshua Akinetos Malik
SI Ruler A clean, one-click price ruler that shows points and exact dollar cost between any two levels on your chart. Every trader needs to quickly measure the distance between two price levels and know what it costs in real money. Most platforms make this harder than it should be. SI Ruler puts a single icon in the corner of your chart — click it, click your entry level, and drag to your stop or target. The label tells you instantly how many points that distance is and exactly what it costs in
FREE
DataFeeder
Joao Paulo Euko
Hi you, I need your help! Be my Patron, let's make it possible! https://www.patreon.com/joaopeuko https://github.com/Joaopeuko/Mql5-Python-Integration Esse Expert Advisor copia os dados("symbol,last,bid,ask") dos ativos que foram colocados na lista e só funciona enquanto o mercado esta aberto. Esse EA não é um link DDE ou RTD, as informações não são passadas em tempo real ao excel. O EA tem um delay de 30 segundos e o Excel tem um delay de 1 minuto. A vantagem desse EA é que ele dispensa o
FREE
该产品的买家也购买
Trade Assistant MT5
Evgeniy Kravchenko
4.43 (216)
它有助于计算每笔交易的风险,容易安装新的订单,具有部分关闭功能的订单管理, 7 种类型的追踪止损和其他有用的功能。   附加材料和说明 安装说明   -   应用程序说明   -   模拟账户应用程序的试用版 线条功能  - 在图表上显示开仓线、止损线、止盈线。 有了这个功能,就可以很容易地设置一个新的订单,并在开仓前看到它的附加特性。   风险管理  - 风险计算功能在考虑到设定的风险和止损单的大小的情况下,计算新订单的成交量。它允许你设置任何大小的止损,同时观察设定的风险。 批量计算按钮 - 启用 / 禁用风险计算。 在 " 风险 " 一栏中设置必要的风险值,从 0 到 100 的百分比或存款的货币。 在 " 设置 " 选项卡上选择风险计算的变量: $ 货币, % 余额, % 资产, % 自由保证金, % 自定义, %AB 前一天, %AB 前一周, %AB 前一个月。   R/TP 和 R/SL - 设置止盈和止损的关系。 这允许你设置相对于损失的利润大小。 例如, 1 : 1 - 这决定了 TP = SL 的大小。 2 : 1 - 这意味着 TP 是 SL 的两倍。 RR -
欢迎来到 Trade Manager EA——这是一个终极风险管理工具,旨在使交易变得更直观、精准和高效。它不仅仅是一个下单工具,而是一个用于无缝交易计划、仓位管理和风险控制的全面解决方案。不论您是新手交易员、资深交易员,还是需要快速执行的剥头皮交易员,Trade Manager EA 都可以满足您的需求,适用于外汇、指数、大宗商品、加密货币等各种市场。 借助 Trade Manager EA,复杂的计算已成过去。只需分析市场,在图表上用水平线标记入场、止损和止盈,设置您的风险水平,Trade Manager 就会立即计算出理想的头寸规模,并实时显示以点、账户货币计价的止损和止盈。每笔交易都得以轻松管理。 主要功能: 头寸规模计算器 :根据定义的风险瞬间确定交易规模。 简单的交易计划 :在图表上用可拖动的水平线直接计划交易,设置入场、止损和止盈。 实时显示 SL 和 TP :以账户货币、点或分显示止损和止盈,便于分析。 高级保护工具 盈亏平衡选项 : 基本盈亏平衡 :当您的交易达到设定水平时自动保护利润。 多级盈亏平衡 :设置多达 4 个级别以逐步保护利润。 尾随止损选项 : 基本尾随
Local Trade Copier EA MT5
Juvenille Emperor Limited
4.94 (149)
Local Trade Copier EA MT5 是一款快速、灵活的交易复制工具,用于在同一台 Windows 电脑或 Windows VPS 上的多个 MetaTrader 5 账户之间复制和管理交易。 它将本地交易同步与 Receiver 端的手数管理、风险管理、交易过滤、品种映射、交易管理和账户保护功能结合在一起。 只需约 1 分钟 即可完成 Transmitter 和 Receiver 终端的设置,并可在同一经纪商或不同经纪商的账户之间复制手动交易或 EA 交易。在合适的条件下,本地 MetaTrader 终端之间的交易信息可以在 0.5 秒以内 完成同步。实际交易执行速度取决于经纪商延迟、网络状况、电脑/VPS 性能以及终端负载。 购买前先试用免费演示版 您可以在 MT5 模拟账户上测试 功能完整的 Local Trade Copier EA MT5 免费演示版 ,每次可使用 4 小时 : 下载 Local Trade Copier EA MT5 免费演示版 将下载的文件放入: MT5 → 文件 → 打开数据文件夹 → MQL5 → Experts 然后重新启动 MT
Telegram to MT5 Multi-Channel Copier   可将您 Telegram 和 Discord 频道中的交易信号自动复制到 MetaTrader 5。无需机器人、无需浏览器扩展、无需手动复制。信号一到 Telegram 或 Discord,EA 几秒内就在您的终端开仓。 在复制某个频道之前,内置回测器还能告诉您该频道在您的账户上会有怎样的表现。 产品包含两个组件:一个监听您 Telegram 频道的 Windows 应用程序,以及在 MT5 终端执行信号的本 EA。同时提供 MT4 版本   点此 . 设置指南与应用下载:   https://www.mql5.com/en/blogs/post/768988 了解如何 回测任何 Telegram 信号频道 。 当前价格将来会上调。 工作原理 应用通过您自己的 Telegram 账号连接,因此能看到您关注的所有频道、群组、话题和机器人,包括私密和 VIP 频道。信号到达时,应用读取它,EA 按您的手数和设置在终端中开仓。 整个过程全自动,无需守在电脑前。专为 24/7 无人值守运行设计:Telegram 连接
================================================================================ POC BREAKOUT - V20.72. Full Professional Grade Toolkit ================================================================================ POC Breakout is a full MetaTrader 5 trading dashboard for discretionary traders who want breakout signals, Point of Control (POC) context, volume profiles, order flow, market structure, news, alerts, and advanced trade planning in one professional workspace. Attached directly to you
Strategy Ledger Pro
Abdullah Uygar Tuna
5 (9)
现已支持中文。 Strategy Ledger Pro 是一款适用于 MetaTrader 5 的只读账户分析面板。它按智能交易系统(EA)、策略、品种和魔术号拆分账户结果,让您看清每一个的真实贡献。 面板支持 11 种语言:English、Français、Deutsch、Español、Italiano、Português、Русский、Türkçe、中文、日本語 和 한국어。 下载演示版之前请注意。 Market 仅在策略测试器中运行任何付费产品的演示版。本面板分析的是您自己账户上的交易,而策略测试器中没有可读取的账户历史,因此演示版会打开一个空面板并加以说明。这是演示机制的工作方式,并非产品的限制。 本描述中的视频展示了面板在真实账户上的运行效果。 详细的 使用手册 (英文)介绍了每项功能, AureusAI Trading Suite 群组欢迎交流讨论并发布公告。 MetaTrader 对整个账户只显示一个余额。当多个 EA 同时交易时,这个余额无法说明每个 EA 的贡献。Strategy Ledger Pro 读取账户历史,重建已平仓头寸,将其归入各个策略,并在一个
TradePanel MT5
Alfiya Fazylova
4.88 (170)
交易面板是一款多功能交易助手。该应用包含超过50种手动交易功能,并允许您自动执行大多数交易任务。 应用程序说明 : https://www.mql5.com/zh/blogs/post/761102 用于模拟账户的应用程序试用版: https://www.mql5.com/zh/blogs/post/762579 如何安装应用程序: https://www.mql5.com/zh/blogs/post/762580 如何在可视化模式下测试应用程序: https://www.mql5.com/zh/blogs/post/770278 如何在VPS MetaTrader上安装应用程序: https://www.mql5.com/zh/blogs/post/770196 贸易. 只需单击一下即可执行交易操作: 打開掛單和頭寸,並自動計算風險。 一鍵打開多個訂單和頭寸。 打開訂單網格。 按組別關閉掛單和頭寸。 反轉頭寸方向(關閉買入>打開賣出,關閉賣出>打開買入)。 鎖定頭寸(通過開啟缺少的頭寸,使買入和賣出頭寸的數量相等)。 一鍵部分關閉所有頭寸。 將所有頭寸的止盈和止損設置在同一價格水平。
按照自己的交易规则复制 Telegram 信号 Telegram to MT5 Signal Trader 可将 Telegram 公开及私密频道和群组中的文字交易信号自动复制到 MetaTrader 5。通过一个桌面应用管理多个信号提供者和 MT5 账户,并为 每个提供者单独设置风险和交易参数 。 复制信号无需 Telegram 机器人,也无需配置 API。 只需通过手机号或二维码登录您自己的 Telegram 账户,然后选择您已加入的频道或群组。您无需创建机器人,也无需提供 Telegram API 令牌、API ID 或 API hash。 自行选择仓位大小,将平仓分配到多个止盈价位,并自动执行保本止损和移动止损。在跟随信号提供者的同时,掌握信号的实际交易方式。 本产品由这款 MT5 EA 和必须配合使用的 Windows 桌面应用组成。请参阅 安装指南及应用下载 。 管理多个信号提供者和账户 为每个提供者单独设置: 为每个频道设置专属的仓位计算方式、入场规则、止损、止盈和交易管理参数。 灵活分配至不同账户: 将同一提供者的信号复制到多个已连接的 MT5 账户,并为每个账户使用不
Power Candles 策略扫描器——自优化多符号设置查找器 Power Candles策略扫描器 采用与Power Candles指标相同的自优化引擎,可同时扫描您“市场观察”中的所有交易品种。一个面板即可显示当前哪些品种在统计上具备交易价值、每种策略的最佳应用方向、最优止损/止盈组合,并在新信号触发时立即向您发送提醒。 本工具是 Stein Investments 生态系统的一部分 - 18+ 款工具,加上 Max,您的一对一 AI 交易导师。  随时在线,深入了解每一款指标,在您需要梳理思路的那一刻就在那里。  立即认识他: https://stein.investments 您的全面市场监控。每个交易品种超过3,000次自动优化。2种警报类型。一键切换图表并采取行动。 为何您需要此工具 大多数多标的扫描器仅展示价格 波动 。每只股票的波动率、百分比变化、RSI。您仍需自行摸索正确的策略、合适的止损位以及理想的入场阈值。Power Candles策略扫描器针对每只股票自动解答这些问题,仅在数学验证过的交易设置中触发实际入场信号时才会向您发出提示。这就是全部卖点。 自动
Grid Manual MT5
Alfiya Fazylova
4.73 (22)
Grid Manual是一个交易面板,用于处理订单网格。 该实用程序是通用的,具有灵活的设置和直观的界面。 它不仅可以在亏损方向上设置订单网格,还可以在盈利方向上设置订单网格。 交易者不需要创建和维护订单网格,实用程序会这样做。 打开一个订单就足够了,Grid manual会自动为它创建一个订单网格,并伴随它直到非常关闭。 完整说明和演示版 此處 。 该实用程序的主要特性和功能: 伴隨以任何方式打開的訂單,包括從移動終端打開的訂單。 適用於兩種類型的網格:“限制”和“停止”。 使用兩種方法計算網格間距:固定和動態(基於 ATR 指標)。 允許您更改未結訂單網格的設置。 顯示圖表上每個網格的盈虧平衡水平。 顯示每個網格的利潤率。 允許您一鍵關閉網格中的盈利訂單。 讓您一鍵關閉每個訂單網格。 允許您對訂單網格應用追踪止損功能。 允許您在訂單網格上應用將訂單網格的止損轉移到盈虧平衡水平的功能。 相對於訂單網格的盈虧平衡水平自動重新排列止盈(僅在限價網格模式下,距離取決於所選的計算類型:“保守”或“激進”)。 最多可管理 20 個訂單網格,每個網格最多可包含 100 個訂單。 計算初始手數時,
MT5 to Telegram Signal Provider 是一个易于使用且完全可自定义的工具,它允许向 Telegram 的聊天室、频道或群组发送 指定 的信号,将您的账户变为一个 信号提供商 。 与大多数竞争产品不同,它不使用 DLL 导入。 [ 演示 ] [ 手册 ] [ MT4 版本 ] [ Discord 版本 ] [ Telegram 频道 ]  New: [ Telegram To MT5 ] 设置 提供了逐步的 用户指南 。 不需要了解 Telegram API;开发者提供了您所需的一切。 关键特性 能够自定义发送给订阅者的订单详情 您可以创建分层的订阅模型,例如铜、银、金。其中金订阅获得所有信号等。 通过 id、符号或评论过滤订单 包括执行订单的图表截图 在发送的截图上绘制已关闭的订单,以便额外核实 延迟发送新订单消息的可能性,以便在发送前对位置进行调整 订单详情完全透明: 新的市场订单*带截图 订单修改(止损、获利) 已关闭的订单*带截图 部分关闭的订单** 新的挂单 修改的挂单(进场价格) 挂单激活(作为新的市场订单附加) 已删除的挂单 历史订单报告
Welcome to ENTRY IN THE ZONE AND SMC MULTI TIMEFRAME  SPECIAL BENEFIT / FOR OUR MQL5 CUSTOMERS FREE ACCESS TO THE NEW TOOL  — COMING SOON — Learn more on our official website  : https://www.fableedge.net Entry In The Zone and SMC Multi Timeframe is a real-time market analysis tool based on Smart Money Concepts (SMC), designed to analyze market structure, price direction, and key trading zones. It supports both Single-Timeframe Analysis and Multi-Timeframe Analysis, providing a clearer view of th
Footprint Chart Pro — Professional OrderFlow EA for MetaTrader 5 Version 6.34 | Professional tool for real traders | Institutional-Grade Visualization DEMO USERS - PLEASE SELECT EVERY TICK / REAL TICK WHEN TESTING AND YOU HAVE DOWNLOADED HISTORICAL DATA. IF YOU SEE A WAITING SCREEN AND IT IS NOT DOWNLOADING, IT MEANS YOU HAVE LOW HISTORICAL DATA. TRY 1 MIN AND 5 MIN FIRST ON 1 DAY DATA. ONE DAY DATA SHOULD BE THE NEWEST AND MOST CURRENT DATE. PLEASE WAIT UNTIL THE MARKET HAS ROLLED OVER PERIOD.
Signal TradingView to MT5 Pro Automator TradingView 与 MetaTrader 5 之间的即时专业执行 使用最强大的桥梁,将 TradingView 警报与 MT5 中的实际执行连接起来,实现交易策略的自动化。这款 Expert Advisor 专为要求速度、灵活性和完美风险管理的交易者设计,可将任何警报消息转化为精确的市价或限价订单。 优势与特点 通用解析引擎(专有): 先进技术,能够自动识别并提取任何警报格式中的数据。您不再受限于单一的死板格式;系统会自动理解交易品种(Symbol)、操作(Action)、价格(Price)、止损(SL)和止盈(TP)。 实时执行: 极速轮询技术(低于 1 秒),经过优化可将延迟降至最低。接收到信号后,订单将在毫秒内执行。 机构级风险管理: 基于以下方式自动精确计算手数: 净值/余额百分比(% of Equity/Balance): 每笔交易承担固定账户百分比的风险。 风险金额(Risk Amount): 设定在触发止损时损失的固定货币金额(例如:100 美元)。 固定手数(Static Lots)
Trade copier MT5
Alfiya Fazylova
4.61 (56)
Trade Copier 是一种专业实用程序,旨在复制和同步交易账户之间的交易。 复制发生从供应商的帐户/终端到收件人的帐户/终端,安装在同一台计算机或 vps 上。 在购买之前,您可以在演示帐户上测试演示版本。 演示 这里 。 完整说明 这里 。 主要功能和优点: 支持复制MT5>MT5、MT4>MT5、MT5>MT4,包括МТ5 netting账户。 供应商和收件人模式在同一产品中实现。 简单直观的界面,允许您直接从图表中实时控制复制。 连接中断或终端重新启动时不会丢失设置和位置。 允许您选择要复制的符号,也可以替换接收者的符号,例如 EURUSD> USDJPY。 允许为每个符号设置个性化的复制设置。 支持回拷贝。 能够仅复制某些订单。 允许您设置开仓交易价格的最大差异和最大时间延迟。 正确复制部分订单关闭的执行。 计算复制手数的几种方法。 同步止盈和止损。有几种方法可以计算它们的位置。 支持通过执行在“Market account”上工作,其中 SL / TP 仅在开仓后设置。 如何使用简单的设置复制交易 将供应商终端和接收终端安装在同一台计算机或 VPS 上。 在供应商终端上
Copy your MT5 trades to Interactive Brokers You keep using MT5. Every order you open or close is sent to your IB account. In real time. No coding. No changes to your strategy or EA. Try it first Rent 1 month: $30. Test on a live or paper account. What it does Real-time copying: same direction, reverse, or one side only. Map any MT5 symbol to any IB symbol. Set a lot ratio for each. Forex, Futures, Stocks, CFDs, Metals and Crypto. Position sync: both accounts checked, any difference fixed. Optio
Exp COPYLOT CLIENT for MT5
Vladislav Andruschenko
3.97 (35)
适用于 MetaTrader 5 的专业交易复制器 快速、专业、稳定可靠的 交易复制器 ,适用于 MetaTrader 。 COPYLOT 可在 MT4 和 MT5 终端之间复制 Forex 交易,并支持 Hedge 和 Netting 账户。 COPYLOT 的 MT5 版本支持: - MT5 Hedge → MT5 Hedge - MT5 Hedge → MT5 Netting - MT5 Netting → MT5 Hedge - MT5 Netting → MT5 Netting - MT4 → MT5 Hedge - MT4 → MT5 Netting MT4 版本 完整说明 + DEMO + PDF 如何购买 如何安装 如何获取日志文件 如何测试和优化 Expforex 的所有产品 您也可以将交易复制到 MT4 终端(MT4 → MT4,MT5 → MT4): COPYLOT CLIENT for MT4 COPYLOT 是一款专业的交易和持仓复制器,可同时与 2、3 甚至 10 个终端协同工作。 支持从 模拟账户和投资者账户 复制,也支持同时在多个终端上运行。 您可以使
Trading Chaos Expert
Hennadii Stanilevych
5 (11)
世界上没有本软件的同等产品,它代表一个覆盖交易信号的通用交易 "控制台",自动入场,设置止损和止盈,还有在单一窗口里同时进行多交易尾随终止。EA 的 "三次点击" 直观控制,确保在不同计算机上全方位使用所有功能,包括平板电脑。 与附加的信号指标交互来标记图标,给出实际市场的全貌,EA 令您做出正确的选择,以及在大多数情况下成为胜者一方。内置资金管理算法, 还有自动计算手数, 虚拟订单交易, 以及一些其它从崩溃账户里挽救交易者的 "诀窍"。它不是一个 "黑盒子"。而是一个深思熟虑的交易员的不可或缺的助理, 至少要尝试一次它的动作。 注,在面板上形成的 EA 不能在策略测试员中测试。可以在您的模拟账户里以实时模式检查它, 您可以下载本 EA 的免费版 - 混沌交易 EA 演示 。 EA 表现为一个面板,带有内置功能的交易机器人的,自动基于交易者可直观检查的交易信号入场,完全按照比尔·威廉姆斯的策略“混沌交易:第二版”和“新贸易维度”。在单独的窗口里,EA 识别价格走势的导向,用于指定品种和时间帧的全自动交易模式,也可以多品种并发。 它同时分析 MetaTrader 5“市场观察”窗口中显示
Anchor Trade Manager
Kalinskie Gilliam
5 (9)
Your EAs cannot see each other, but Anchor can. Anchor gives you one place to coordinate your EAs, manage risk, and decide when trading is allowed. It works alongside the trading bots you already use without any changes to them. The Problem One EA opens a trade. Then another starts trading. The next thing you know, you wake up to multiple grids built across your account. Each EA may be doing exactly what it was designed to do, but together they can place far more risk on your account than you in
Farmed Hedge Yield Farming | All Markets (Manual - Hybrid - Semi/Automated EA) VERIFIED TRADING RESULTS - Farmed Hedge Yield Axi Copy:  https://www.mql5.com/en/signals/2356376 - Farmed Hedge Yield Exn Copy:   https://www.mql5.com/en/signals/2356404 - Farmed Hedge Yield V Copy:  https://www.mql5.com/en/signals/2357156 IMPORTANT NOTICE: FarmedHedge is a MANUAL-FOCUSED TRADING UTILITY ,not a fully automated EA. Results shown on this Signal include manual trades and overall strategic management.
The News Filter MT5
Leolouiski Gan
4.78 (23)
这个产品在新闻时间过滤所有的专家顾问和手动图表,因此您不必担心突然的价格波动会破坏您的手动交易设置或其他专家顾问输入的交易。此产品还带有完整的订单管理系统,可在任何新闻发布前处理您的持仓和挂单。一旦您购买了   The News Filter ,您将不再需要依赖以后的专家顾问内置的新闻过滤器,因为这个产品可以从此过滤它们所有。 新闻选择 新闻来源于Forex Factory的经济日历。 选择可以基于任何一种货币,如USD,EUR,GBP,JPY,AUD,CAD,CHF,NZD和CNY等。 选择也可以基于关键识别,例如Non-Farm (NFP),FOMC,CPI等。 能够选择新闻影响级别的筛选,从低、中、到高影响。 自动模式只选择与图表相关的新闻。 新闻来源每小时自动刷新,以确保最新的新闻数据。 为每个新闻影响级别提供单独的输入,以确定您要过滤掉的新闻发布前后的分钟数。 订单管理选项 在新闻发布前关闭未平仓头寸的选项,并在新闻发布后恢复它们。 在新闻发布前删除挂单的选项,并在新闻发布后恢复它们。 在新闻发布前移除止损和止盈水平的选项,并在新闻发布后恢复它们。 在新闻发布前移动止损和
MetaTrader 5 专业交易面板 —— 图表与键盘一键交易的高效控制中心 一款面向主动交易者的专业 Trading Panel,可让您比标准 MetaTrader 操作方式更快、更直观地完成开仓、平仓、修改、管理与控制。 这不是一个普通的小工具,而是一个为高频手动操作、仓位管理、挂单控制与利润管理而设计的完整交易工作台。 通过这套面板,您可以直接在图表上一键执行交易,通过键盘快速触发核心操作,并借助自动参数计算、图形提示、信息标签以及可视化管理功能,大幅减少重复性操作,让整个交易流程更加流畅、高效且专业。 使用我们的交易面板,您可以直接从图表上一键下单,执行交易操作的速度可比标准 MetaTrader 控件快约 30 倍。 全新高级版本现已推出: 使用 VirtualTradePad PRO SE 升级您的交易流程 — 适用于 MetaTrader 5 和 MetaTrader 4 的新一代专业交易面板。 MT4 版本 | 完整说明 + DEMO + PDF | 如何购买 | 如何安装 | 如何获取日志文件 | 如何测试与优化 | Expforex 的所有产品 为什么交易者会
HINN MagicEntry Extra
ALGOFLOW OÜ
4.74 (19)
HINN MAGIC ENTRY – the ultimate tool for entry and position management! SIMPLE. FASTEST. INTUITIVE. MAX AUTOMATED. Place orders by selecting a level directly on the chart! full description   ::  demo-version  :: 60-sec-video-description Key features: - Market, limit, and pending orders - Automatic lot size calculation - Automatic spread and commission accounting - Unlimited partitial take-profits  - Breakeven and trailing stop-loss and take-profit  functions - Invalidation leves - Intuitive, a
保留您信赖的指标。 让围绕指标的交易操作自动运行。 您是否已有信赖的 MT5 指标,却仍需盯盘、等待信号、计算手数、下单并手动管理每个持仓? Stratiora Signal Engine MT5 旨在衔接这些步骤。它可将兼容的 Buy 和 Sell 缓冲区信号转化为完整的自动化流程:入场、交易量计算、Stop Loss、Take Profit、过滤、持仓管理和账户保护。 每当更换指标或交易思路时,您无需重新定制一款 EA;同一套灵活的执行引擎即可按您的规则处理各类信号。 您的信号。您的规则。您的执行方式。 上线优惠 当前价格:199 美元。  购买 Stratiora Signal Engine MT5 后,您将 获赠 10 款指标。 计划每售出 10 份提价 50 美元,直至价格达到 999 美元。下单时以 Market 页面显示的价格为准。 为什么开发 Stratiora 许多交易者已有自己熟悉并信赖的指标,却仍需盯盘、等待信号、计算手数、下单和手动管理持仓。 Stratiora 将这些步骤连接起来。 指标负责产生交易信号。Stratiora 按您设定的执行和管理规则处理信号。
Trade Copier Ultimate
Janitha Sandaruwan Amaradasa Wickramasingha Arachchilage
5 (5)
Trade Copier Ultimate - Telegram 到 MT5 信号复制器 Trade Copier Ultimate 可将 Telegram 交易信号自动复制到 MetaTrader 5。EA 能读取信号消息,识别交易品种、订单类型、入场价格、止损、止盈目标以及部分更新指令,然后根据您设置的手数和风险参数,在 MT5 中执行或管理交易。 它不只是一款基础的 Telegram 到 MT5 跟单工具。TCU 还支持 Telegram Bot API 和用户账户 Bridge 工作流程、Discord 信号路由、本地 MT5 到 MT5 跟单、将 MT5 交易广播到 Telegram 或 Discord、图片信号识别、最多 TP5 的多止盈执行、TP OPEN 跑单仓位、虚拟多止盈模式、入场区间处理、挂单、经纪商交易品种匹配以及 Prop Firm 风险控制。 其他资料与使用说明 下载免费演示版  -  快速设置与使用手册  -  下载 NTS Bridge    点击这里测试您的信号格式 --->>> 免费演示版:   购买前可在模拟账户上测试完整的 EA 和 Brid
Trade Indicator Assistant   is a powerful MT5 utility designed to turn indicators into automated trading systems. Its main feature is the ability to automatically detect an indicator’s   BUY and SELL signal buffers , without requiring you to know the buffer numbers, search through indicator settings, or modify the indicator source code. Bonus Indicator:   After purchasing Trade Indicator Assistant, contact me to receive   Trade Signal Pro   completely free as a bonus indicator. [Download Demo V
EA Overfitter
Stephen J Martret
5 (1)
回测看起来很漂亮。但它明天、下周、下个月还能继续赚钱吗? EA Overfitter 让您的 EA 在 100 段它从未见过的价格历史上重新运行。一个分数告诉您这个优势是否真实。 回测告诉您的,是 EA 在某一段价格历史上的表现——那段恰好发生过的历史。您无法从中判断,这个结果有多少来自策略本身,又有多少只是那一条特定路径带来的。 EA Overfitter 回答的正是这个问题。它构建最多 100 段您的 EA 从未交易过的合成价格历史,让策略在全部这些历史上重新运行,并展示它所产生的完整结果区间。您得到的不再是一条幸运或不幸路径上的单个数字,而是一幅真实的图景:策略在陌生数据上多久能赚钱、典型结果是什么样(而不是最好的那一次),以及您的回测离它有多远。 这些世界是由您自己的近期历史重建而成,因此这不是预测——任何从历史数据出发的检验都不可能是预测。它告诉您的是:这个优势是否依赖于价格的某一种特定排列,以及回测数字距离典型结果有多远。在投入资金之前,这才是值得回答的问题。 三个步骤 1. 构建。在图表上选择时间区间和世界数量,然后按 Build。EA Overfitter 会
Trade Manager DaneTrades
Levi Dane Benjamin
4.23 (30)
交易管理器可帮助您快速进入和退出交易,同时自动计算风险。 包括帮助您防止过度交易、报复性交易和情绪化交易的功能。 交易可以自动管理,账户绩效指标可以在图表中可视化。 这些功能使该面板成为所有手动交易者的理想选择,并有助于增强 MetaTrader 5 平台。多语言支持。 MT4版本  |  用户指南+演示 交易经理在策略测试器中不起作用。 如需演示,请参阅用户指南 风险管理 根据%或$自动调整风险 可选择使用固定手数或根据交易量和点自动计算手数 使用 RR、点数或价格设置盈亏平衡止损 追踪止损设置 最大每日损失百分比,在达到目标时自动平仓所有交易。 保护账户免遭过多提款并阻止您过度交易 最大每日损失(以美元为单位)在达到目标时自动关闭所有交易。 保护账户免遭过多提款并阻止您过度交易 一键实现所有交易的盈亏平衡 自动计算从手机/电话发送的交易的风险 OCO 在设置中可用 交易和头寸管理 通过设置每月、每周、每天、每小时或每分钟的最大交易次数,停止过度交易和报复性交易。 高级挂单管理。 调整何时关闭挂单的规则 追踪挂单 支持市价订单和挂单 每日最大利润目标(以美元为单位)以确保头寸并停止
Telegram To MT5 Ultra
Mirel Daniel Gheonu
5 (5)
Telegram To MT5 — 信号复制器 将您的 Telegram 频道中的交易信号变成真实的 MT5 订单 — 自动执行,可用于任意数量的账户,风险与规则完全由您掌控。 Telegram To MT5 将您已在 Telegram 关注的 VIP / 信号频道连接到您的 MetaTrader 5 终端。一个免费的配套桌面应用读取消息(即使是禁止机器人的频道),而本 EA 在您的账户上执行这些信号 — 应用您自己的风险设置、品种映射、止盈处理、交易时段与新闻过滤。 它是一个信号复制器,而非黑箱策略:由您决定信任哪些频道,以及每笔交易如何计算手数和管理。 分步设置与配套应用安装指南 工作原理 [您的 Telegram 频道] -> [配套桌面应用] -> [MT5 + 本 EA] -> 订单 配套桌面应用(免费,已包含)使用您的 Telegram 账户登录并监视您所选择的频道。即使是禁止机器人的 VIP 频道也能正常工作,它通过一个私有、加密的本地桥接转发每条消息。 本 EA 挂在一个图表上,在 MT5 接收这些信号,并按照您的规则开仓 / 管理交易。 应用与 EA 之间的连接是位于
Quant Panel
Kevin Craig E Gittins
量化面板专业版 量化交易者的终极多EA性能仪表盘 无需再在多个图表或外部工具之间切换来监控您的算法策略!Quant Panel Pro 通过一个简洁专业的界面,为您提供机构级的投资组合监控体验。 核心功能 触手可及的量化分析 所有智能交易顾问(EA)的实时盈亏汇总 带有交易频率指标的胜率统计分析 高级回撤跟踪(已实现和未实现) 风险回报分析——最佳盈利与最大亏损对比 连续亏损监控及警报 专业量化界面 无限滚动——同时监控无限制策略 彩色编码性能矩阵——即时可视化投资组合健康状况 完全可定制布局——适应您的分析流程 现代金融风格设计——专为专业交易者打造 机构级功能 实时数据流——毫秒级精准更新 魔术编号策略筛选——按算法类型组织 多品种性能跟踪——跨市场分析 投资组合级统计——全面的绩效总结 完全可定制 专业配色方案和排版 可调整的刷新率和显示行数 可配置的列布局和指标 个性化仪表盘偏好 改变您的交易操作方式 之前: 手动表格、分散的MT4窗口、延迟分析 之后: 实时投资组合仪表盘、自动化分析、专业报告 “我的量化交易系统中缺失的一环——终于有了机构级的监控工具!” 简单设置流程 将
作者的更多信息
LATTICE COMMAND THE MOST ADVANCED ORDER-NETWORK EXECUTION SYSTEM ON MQL5. Not a claim. A position backed by published, independently testable fidelity data. Discover with Lattice Vision. Deploy with Lattice Command. One engine. Two instruments. One continuous workflow. Lattice Command is the original level-trading execution engine — Grid Trading 2.0, engineered properly. When you find a configuration in Vision, Command produces the same trades. Eighteen test configurations covering filte
筛选:
无评论
回复评论