PriceLevels LTF
- 지표
- 버전: 2.13
- 업데이트됨: 25 9월 2026

Short Description
PriceLevel LTF is an all-in-one price-structure suite for the major Forex pairs: a round-number ("big figure") reaction grid — Wall, Hot Zone, Exit, Trap — layered with volume-profile confluence, HTF Monthly/Weekly key levels, a session liquidity-sweep/stop-hunt detector, dual liquidity heatmaps, and automatic Wyckoff Method and Elliott Wave phase detection. Built and tuned for the M15 timeframe. Updates in place with no flicker and refreshes instantly on new bars and fast price moves.
Full Description
Overview
This indicator started as a simple round-number grid and has grown into a full institutional price-structure toolkit, built specifically around standard Forex broker pip conventions (auto-adjusting for 3/5-digit pricing). Because the grid, key levels, and sweep detector are all built from that shared pip logic rather than any single pair's quirks, they work identically across the major Forex pairs — EUR/USD, GBP/USD, USD/JPY, USD/CHF, AUD/USD, USD/CAD, NZD/USD — with no manual recalibration per pair. This indicator is designed for the major Forex pairs; it is not intended for metals, indices, crypto, or exotic-pair use.
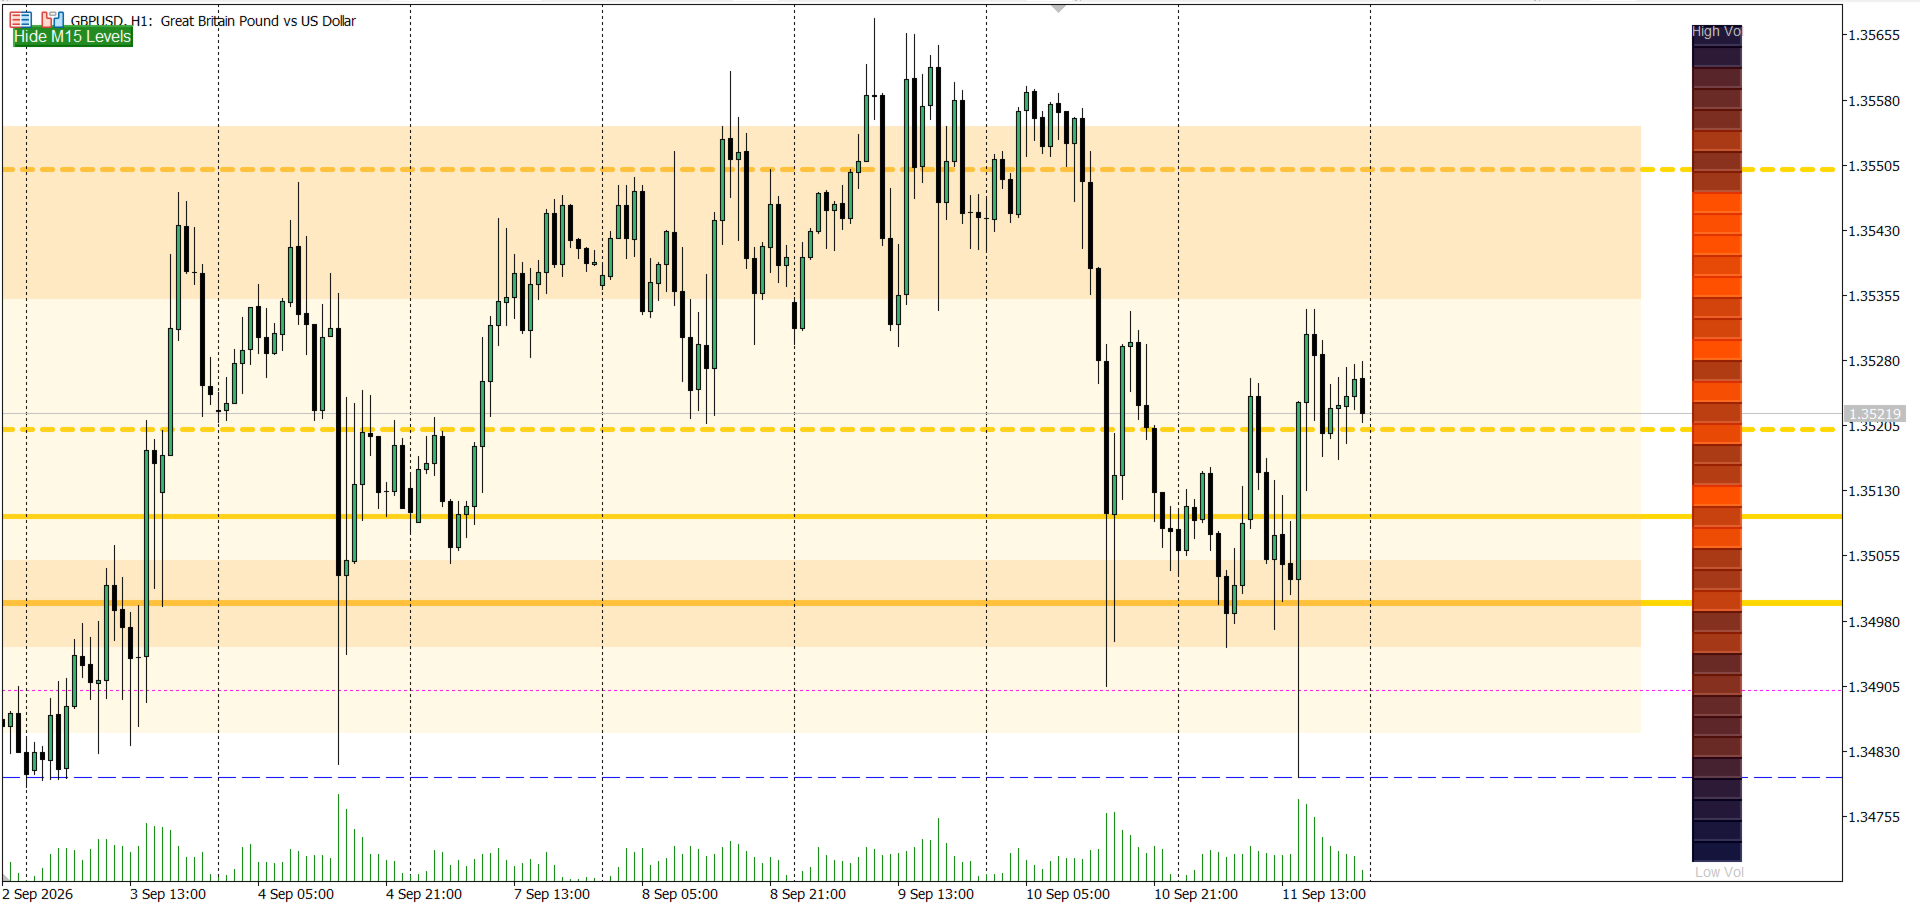
The core grid plots horizontal reference lines at 100-pip intervals, based on the idea that round numbers and near-round numbers tend to act as psychological reaction zones where stop hunts, liquidity grabs, and reversals commonly cluster:
- .000 — The Wall: major round number, often a zone of rejection.
- .200 / .800 — The Hot Zone: a common area to watch for entry confirmation.
- .500 — The Exit: mid-level, often used as a partial take-profit reference.
- .100 / .900 — The Trap: prone to fakeouts and stop hunts — a caution zone, not an entry signal.
- Optional minor grid lines at every remaining .X00 level.
Everything else builds context around that grid: which levels line up with real volume, which sit at a higher timeframe's own key level, which just got swept and reclaimed, and where the broader wave/phase structure of the market currently stands.
Best timeframe
This indicator is built and tuned for the M15 chart — its session windows, sweep-reclaim logic, and default lookback settings are calibrated around 15-minute bars, and that's the timeframe it's most accurate and most tested on. It remains usable down to M5 and up to H4 for the grid, key-level, and sweep features. The Wyckoff and Elliott Wave detectors (below) are structure-based and will run on any timeframe, but read most reliably from M15 up to H4, where a full phase or wave cycle has enough bars to form cleanly — very low timeframes (M1) tend to produce noisier, faster-invalidating counts.
Feature set
Grid & core display
- Feature 1 — Right-margin text labels combining level name, live metrics, and suggested action.
- Feature 2 — Automatic pip/step scaling for correct spacing across all 3/4/5-digit major FX pairs.
- Feature 3 — Configurable proximity alerts (popup/push/email) when price approaches a chosen level type.
- Feature 4 — An on-chart Hide/Show toggle button for the whole grid.
Confluence & context
- Feature 5 — Bounce/Break tracker: counts how many times each level has been respected vs. broken, shown right on the label.
- Feature 6 — Volume-profile confluence: builds a lightweight session volume profile and highlights grid levels that sit on a genuine high-volume node (POC-relative), not just a round number.
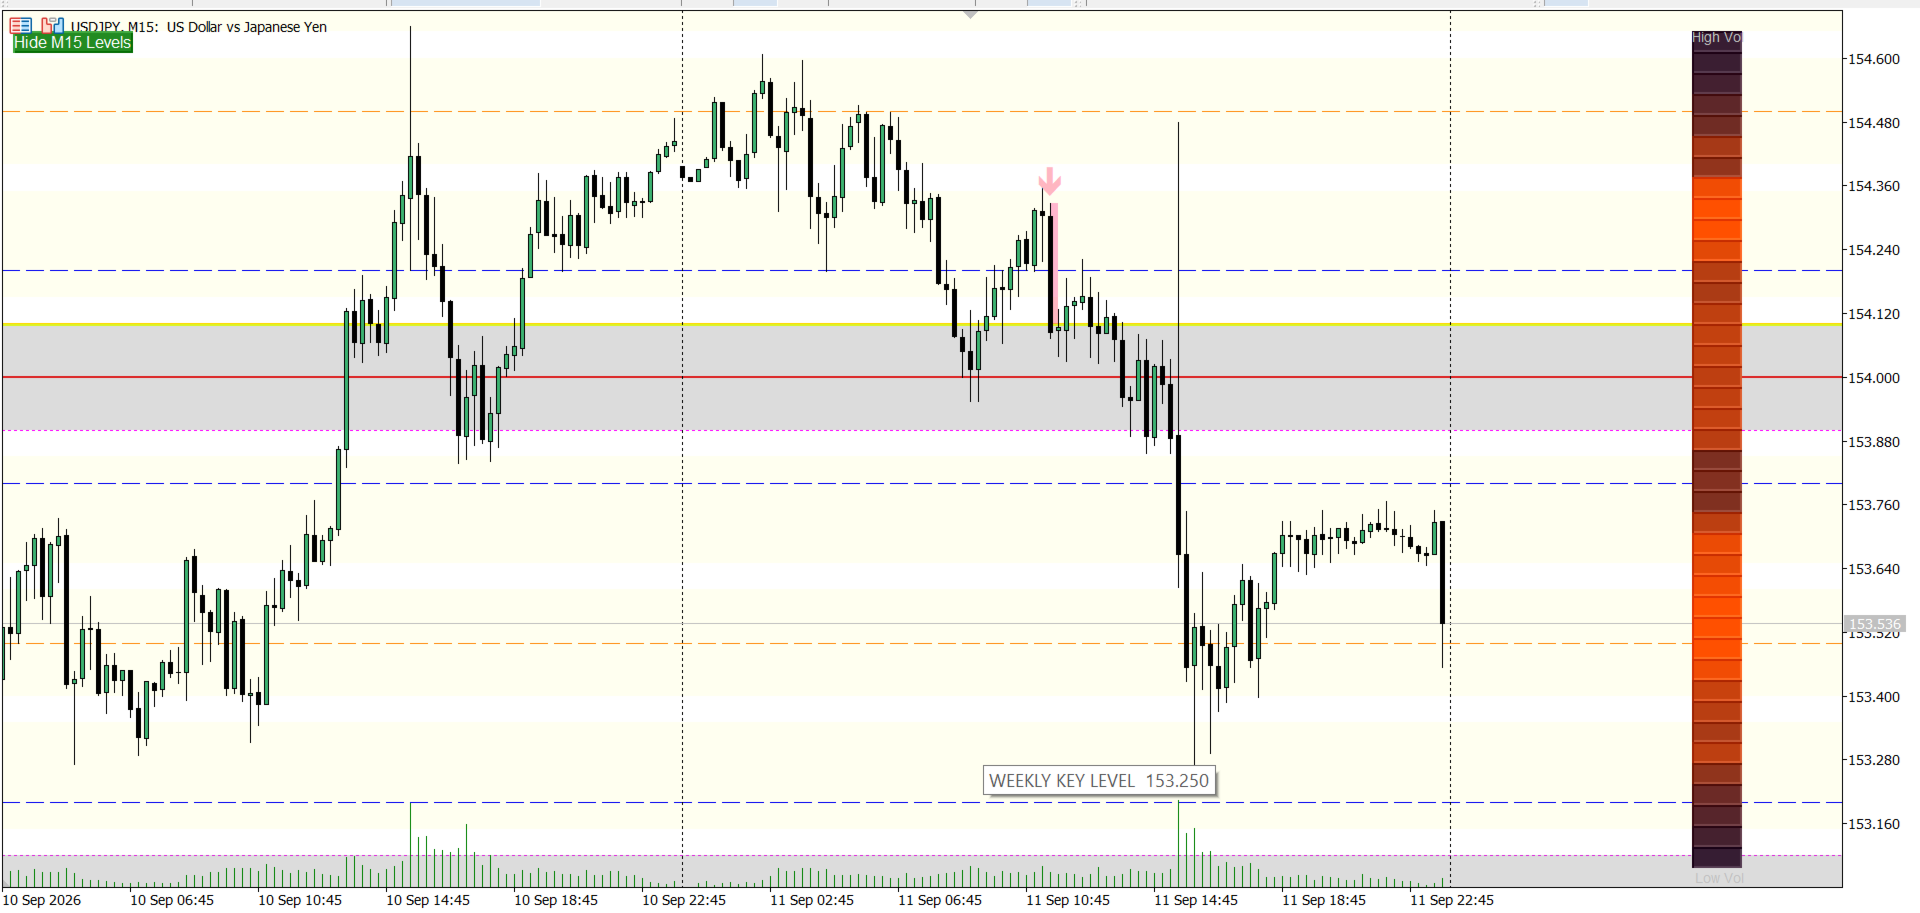
- Feature 7 — Multi-timeframe institutional key levels: auto-detected (or manual) Monthly big-figure and Weekly quarter-figure zones drawn independently of the intraday grid.
Signal detection
- Feature 8 — Session liquidity sweep / stop-hunt detector: watches configurable session windows (London/New York open, etc.) for a wick through a Trap level followed by a same-bar-or-N-bar reclaim, and marks it with a box and arrow. Ambiguous, two-sided (bilateral) sweeps are deliberately left undecorated rather than forced into a directional read.
Heatmaps
- Feature 9 / 9b — Liquidity heatmap panel: a screen-anchored density strip built from tick volume, with an optional Daily/Weekly/Monthly range mode.
- Feature 10 — Hybrid liquidity heatmap: blends tick-volume density with open-interest data from an imported options CSV (Barchart-style export, columns matched by name so a reordered file still parses correctly), and plots Call/Put "wall" lines at the strikes with the heaviest interest.
Structure detection — Wyckoff Method
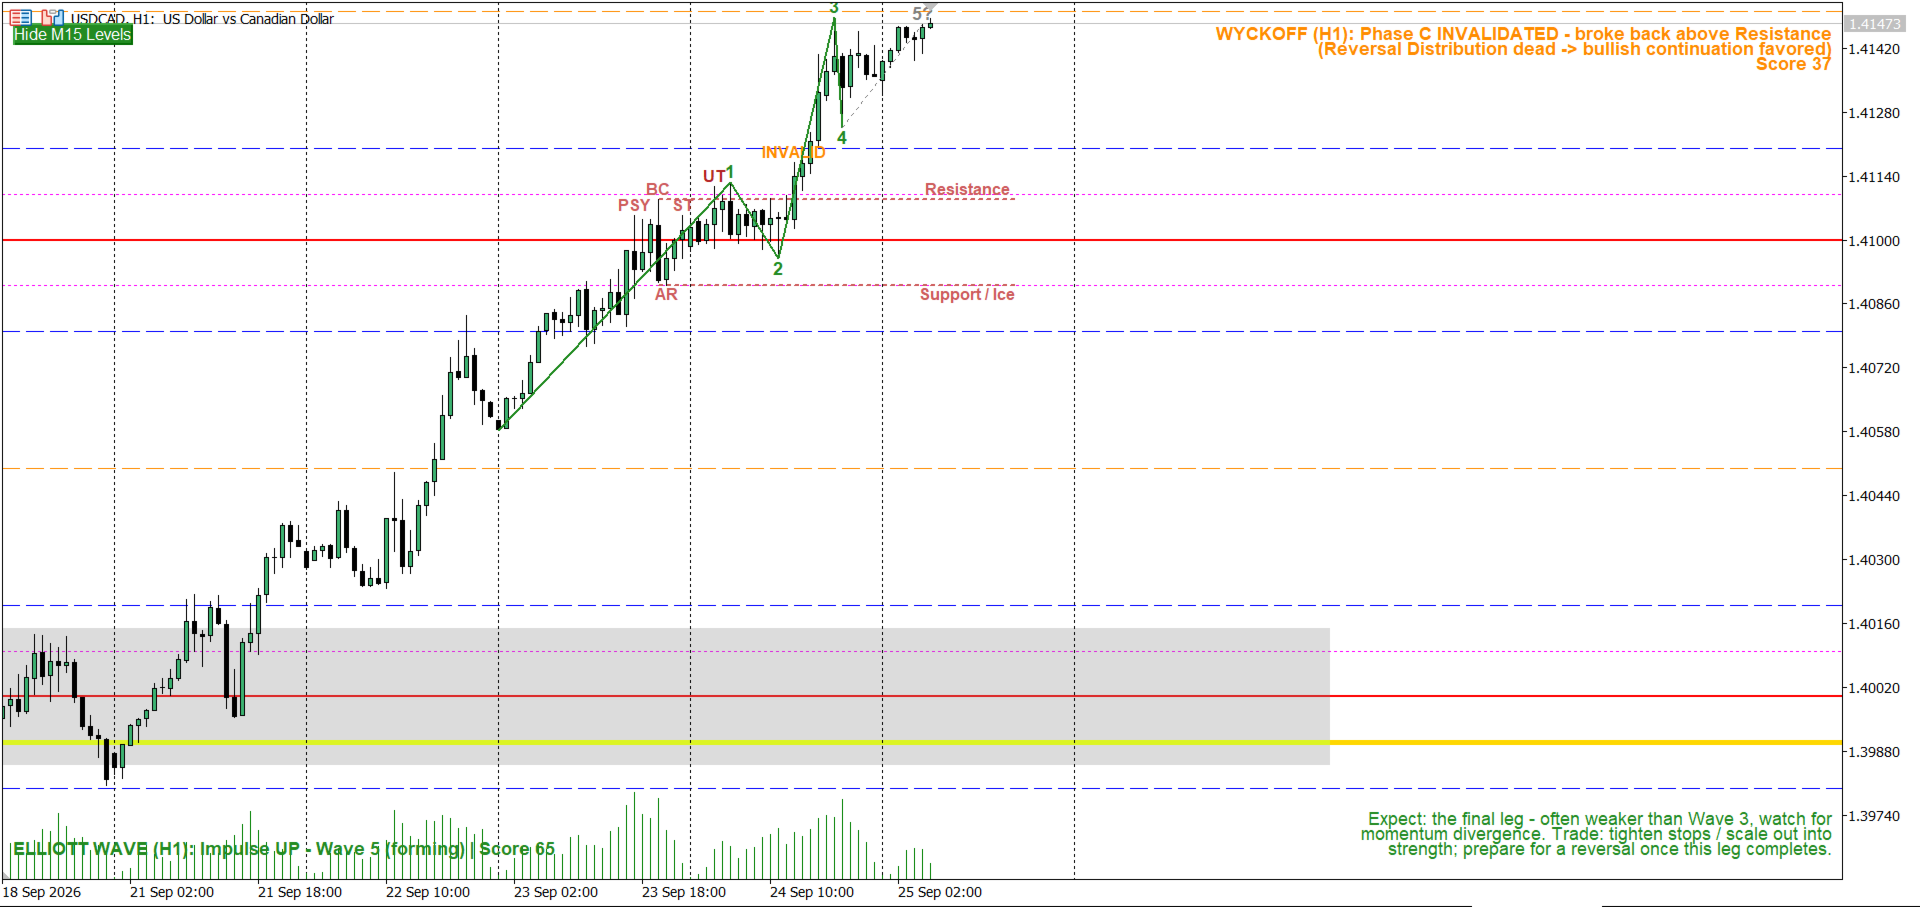
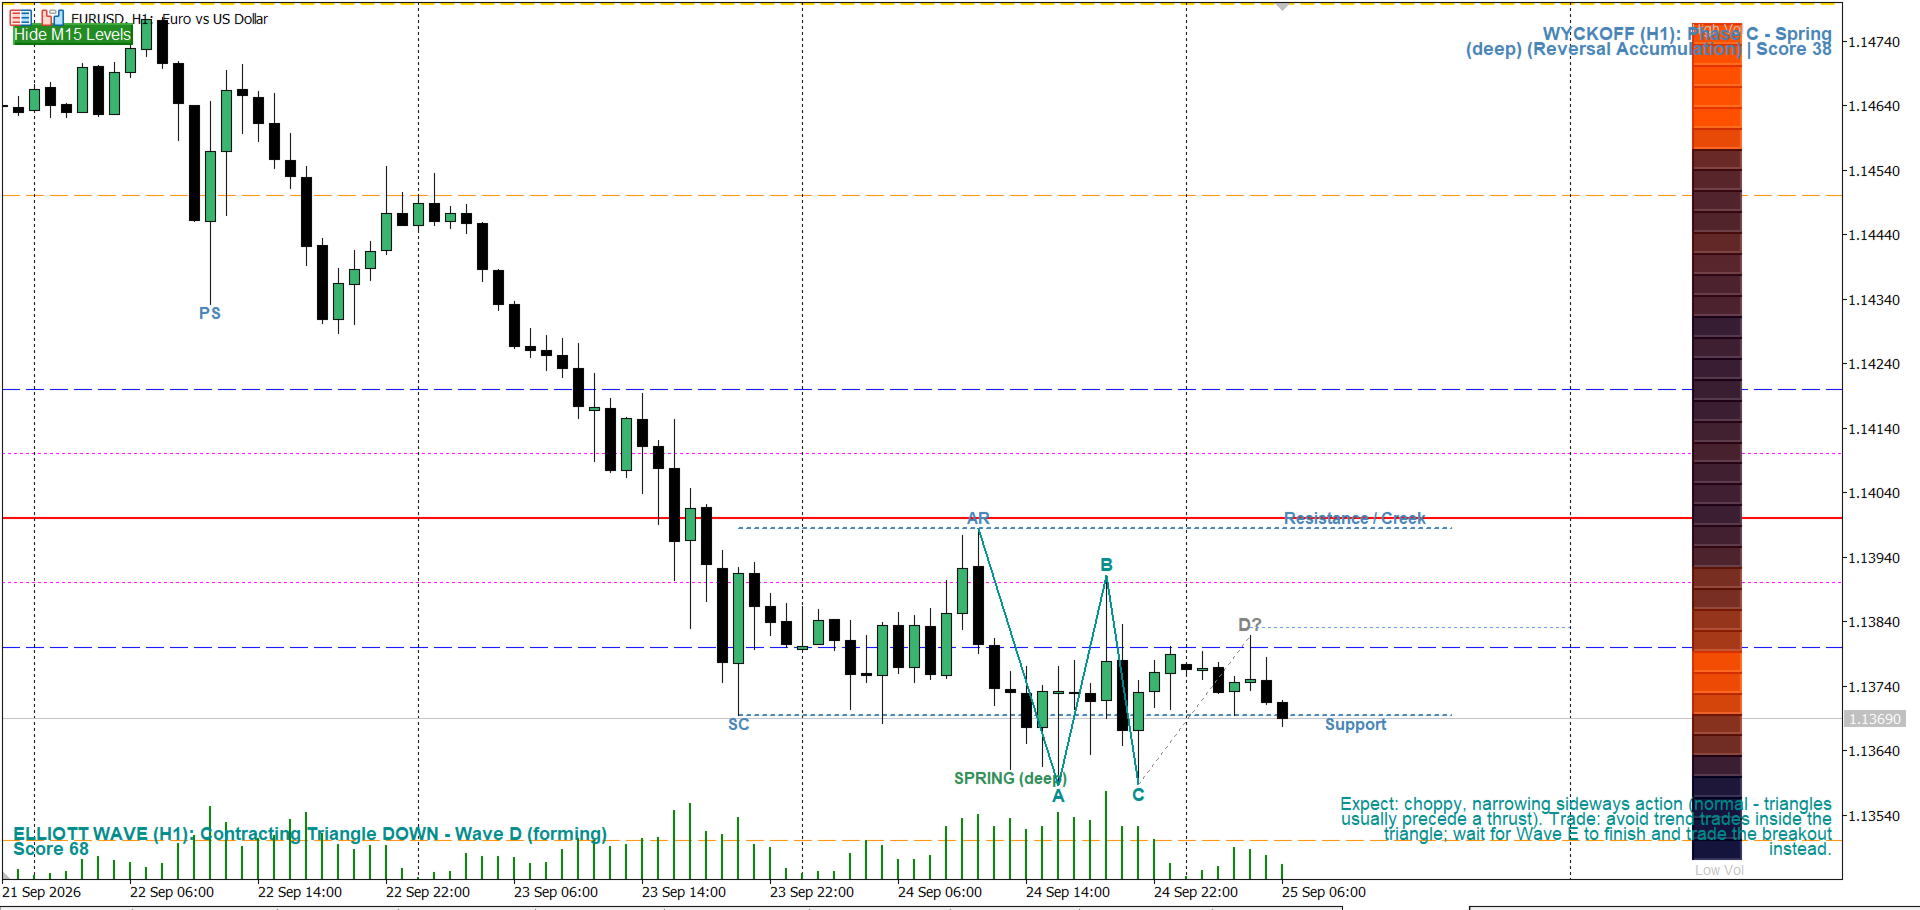
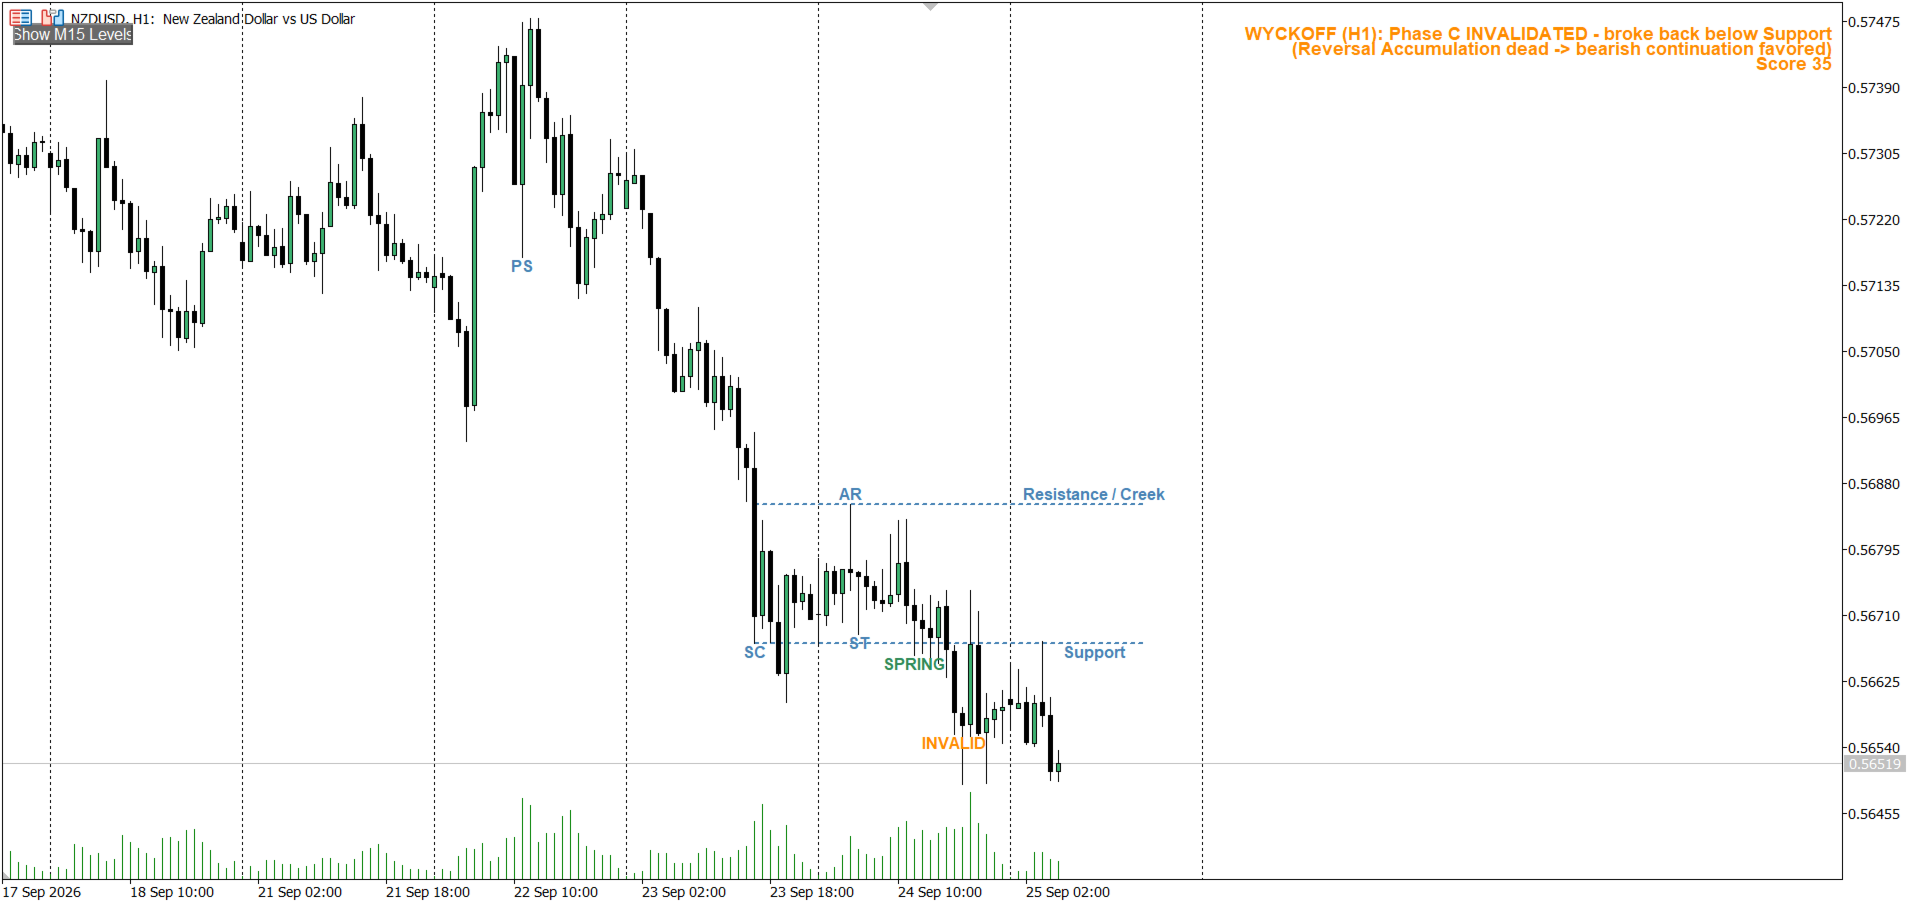
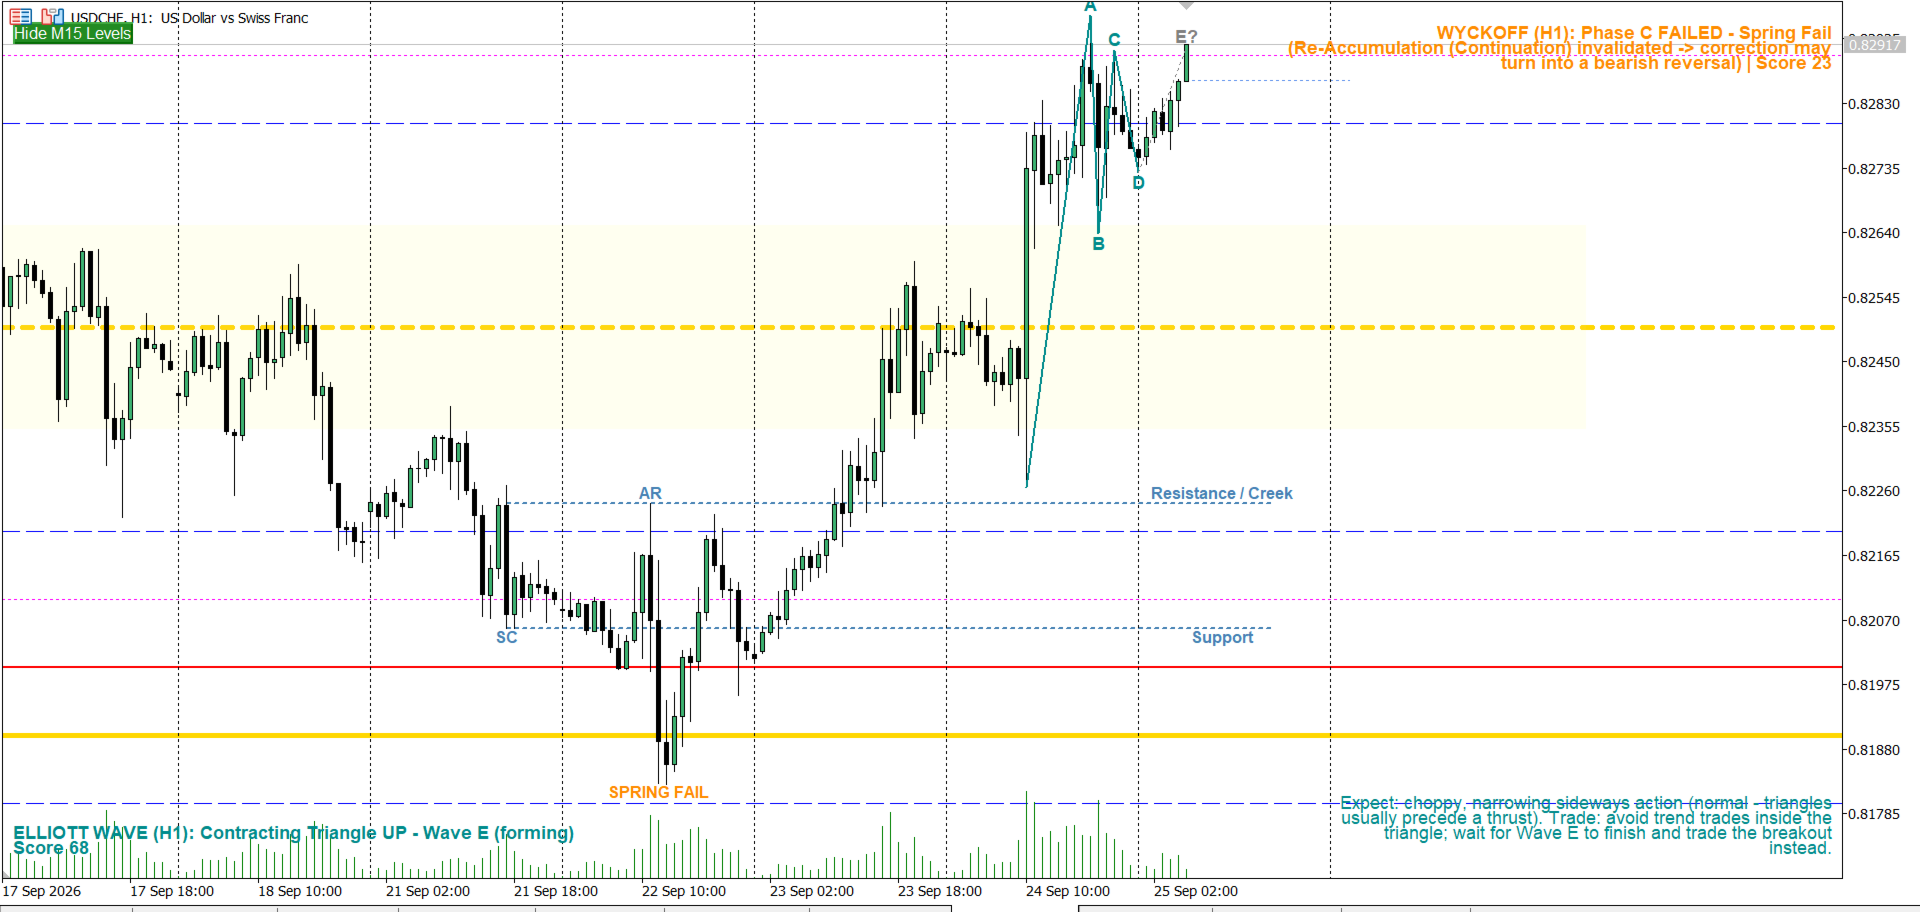
Feature 11 identifies an active Accumulation or Distribution cycle in real time, on any timeframe, and scores it with a probability-weighted status panel. It tracks the full classic sequence:
- Preliminary Support/Supply and the Selling/Buying Climax
- Automatic Rally / Automatic Reaction (AR)
- Secondary Test (ST)
- Spring (or Upthrust) — the shakeout below/above the range
- Sign of Strength / Sign of Weakness (SOS/SOW)
- Last Point of Support / Last Point of Supply (LPS/LPSY), with a real, bounded zone rather than a single price
- Invalidation of a failed SOS/SOW back into the range
The panel shows which phase (A–E) the current range is in, whether the cycle is accumulation or distribution, and a confidence score based on volume behavior at each stage — using a median/trimmed-mean volume baseline so a single spike doesn't distort the read.
Structure detection — Elliott Wave
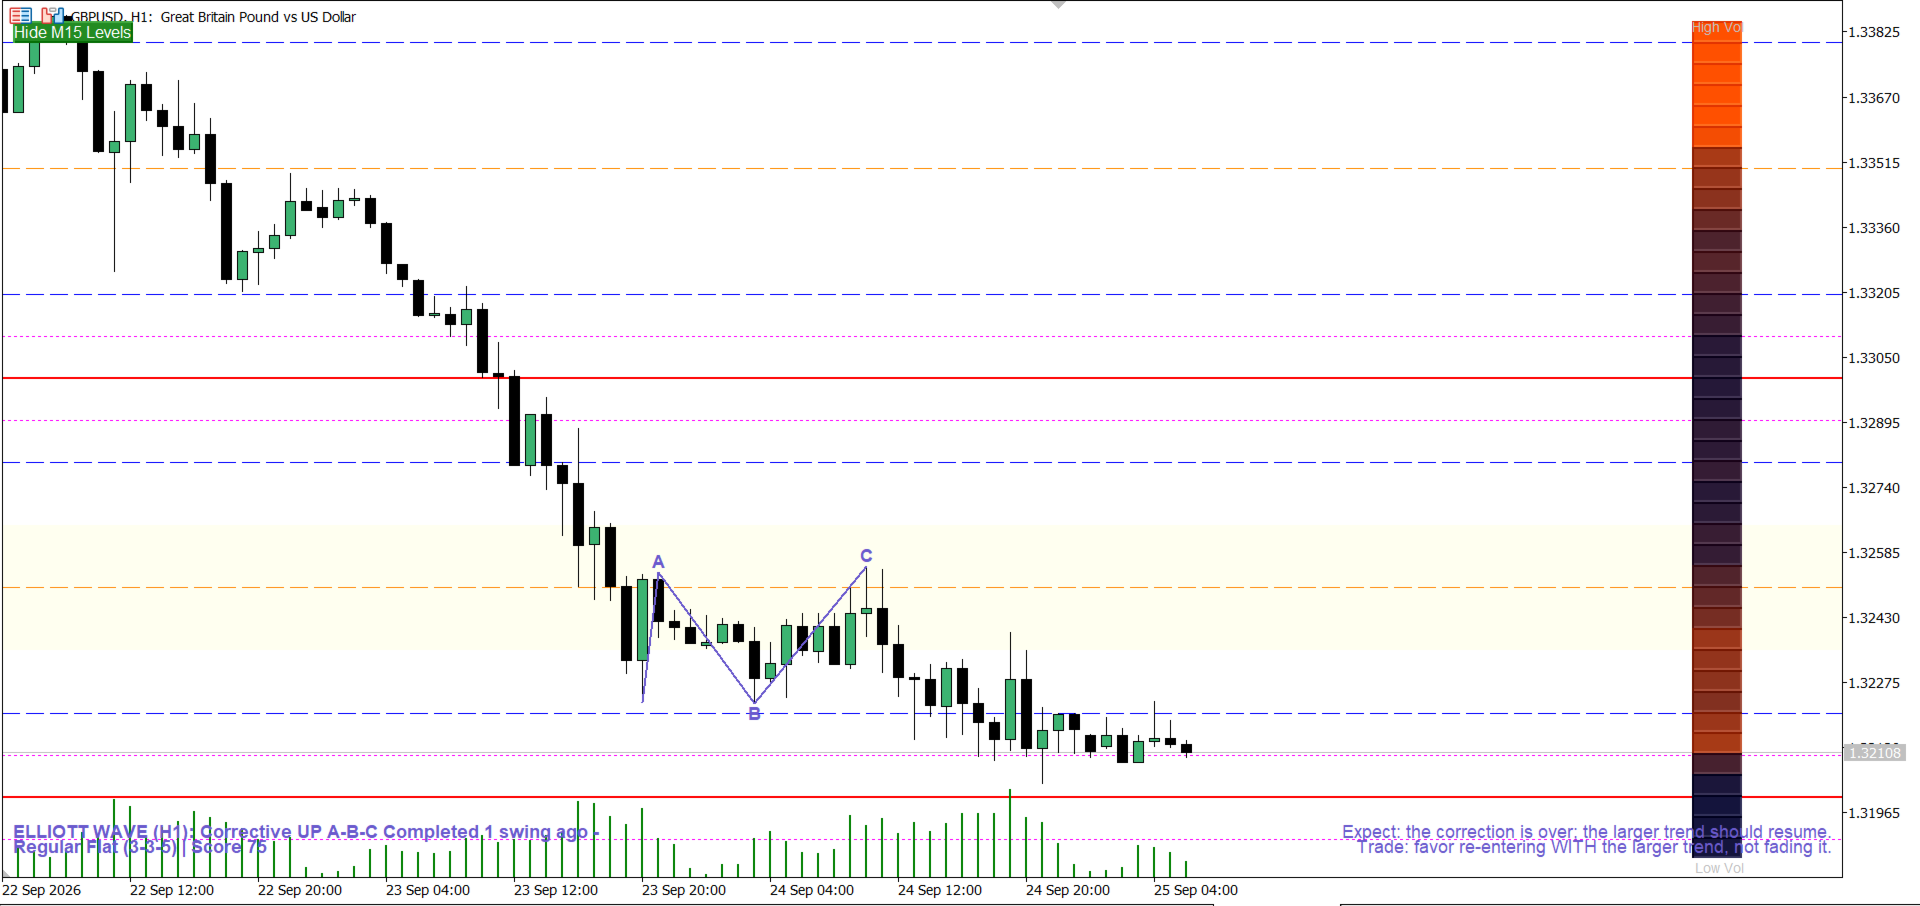
Feature 12 runs a full Elliott Wave scan on any timeframe, scoring candidates against classic Fibonacci guideline ratios and keeping the display stable via continuity/hysteresis (it won't jump between unrelated counts bar-to-bar). It detects:
- Impulse waves (1-2-3-4-5), including Contracting and Expanding Diagonal variants
- Corrective structures: Zigzag, Regular/Expanded/Running Flat, and Shallow/Irregular corrections
- Triangles: both Contracting and Expanding, full A-B-C-D-E
- Both a fully complete count and a live/forming count at once, so you can see both "what just finished" and "what's building right now"
For whichever count is active, it draws Fibonacci-based projection targets for the next wave and a plain-English guidance panel — e.g. Wave 2 = classic retrace entry zone, Wave 3 = hold/trail rather than take early profit, Wave 4 = avoid the chop, Wave 5 = tighten stops and watch for divergence, a Triangle = wait for the Wave E breakout. This is a textbook read of the detected geometry, not a signal or a recommendation.
Performance
Every visual element updates in place — grid lines, zone boxes, heatmap cells, and status panels are found and modified, not deleted and redrawn, so there's no flicker as price moves. The heavier scans (Wyckoff, Elliott, the sweep detector) only run once per new closed bar. The grid and HTF-zone window refreshes instantly on every new bar and also recenters automatically, on a short throttle, the moment price moves far enough intrabar — so a sudden news spike doesn't leave the chart stale while waiting on a timer.
How to use
- Watch for price approaching a Wall or Hot Zone level on your chosen major pair — these are the two level types that qualify as entry candidates; Trap levels are caution zones.
- Check whether the level also carries volume confluence (Feature 6) or sits on a Weekly/Monthly key level (Feature 7) — either raises its significance.
- If a Trap level was just swept and reclaimed (Feature 8), treat that as a stop-hunt warning rather than a reason to chase the wick.
- Use the Wyckoff and Elliott panels (Features 11/12) for broader phase/structure context — are you inside accumulation, or partway through an impulse — rather than as standalone entry triggers.
- Layer in your own confirmation (price action, order flow, or a separate volume/VSA tool) before acting on any level.
Inputs
Organized into input groups per feature (Visual Settings, then one group each for Features 1 through 12, plus the Feature 10 CSV/quote settings), so every feature can be tuned or disabled independently. All zone colors, styles, and widths are configurable, as are alert conditions, session windows, lookback depth, and detection thresholds for each detector.
Risk note
Tick volume is used as a proxy for real volume (no centralized tape exists for spot Forex), so treat volume-based reads as directional-pressure estimates rather than certainty. Wyckoff and Elliott Wave readings are the detector's structural interpretation of price, not a guarantee of what happens next. Always combine with your own risk management and trade plan.
Disclaimer
This indicator is provided for informational and educational purposes only. It does not constitute financial advice, and past price behavior at these levels or structures is not indicative of future results. Trading involves risk of loss.