VPEO Volume Statistics

  • 指标
  • Paolo Ruffini
    Paolo Ruffini
    我是一名拥有超过15年实战经验的交易员,长期活跃于外汇和大宗商品市场,专注于流动性动态、成交量压力以及价格方向性结构的研究。
    多年来,我逐步将主观分析与自主开发的量化工具相结合,开发了一系列专注于衡量真实市场参与度的技术指标。
    目前,我的研究重点集中在 LMPX – Liquidity Momentum Pulse 系列指标的开发上。该系列指标旨在分析归一化成交量与价格加速度之间的关系。
    开发理念
    LMPX 方法基于一个简单而核心的原则:
    价格只有在获得高于平均水平的市场参与支持时,才能实现可持续的运动。
    因此,LMPX 结合了:
  • 版本: 1.20
VPEO Volume Statistics

VPEO Volume Statistics is a customizable volume-analysis indicator for MetaTrader 5. VPEO stands for Volume Pressure and Efficiency Oscillator. The indicator combines directional volume pressure, a statistical analysis of rising or falling market participation, volume-efficiency conditions, optional BUY and SELL markers, and a compact dashboard in one interface.

The indicator is designed to answer three separate questions:

  1. Is current volume pressure mainly positive or negative?

  2. Is overall trading activity increasing, decreasing, or remaining stable?

  3. Is high activity producing directional price movement, or is price showing low efficiency relative to volume?

VPEO Volume Statistics is an analytical indicator. It does not open, modify, or close trades. It does not include position sizing, stop-loss, take-profit, or money-management functions. All displayed entry markers are technical conditions intended for chart analysis, testing, and integration into a separate trading process.

VPEO Pressure Wave

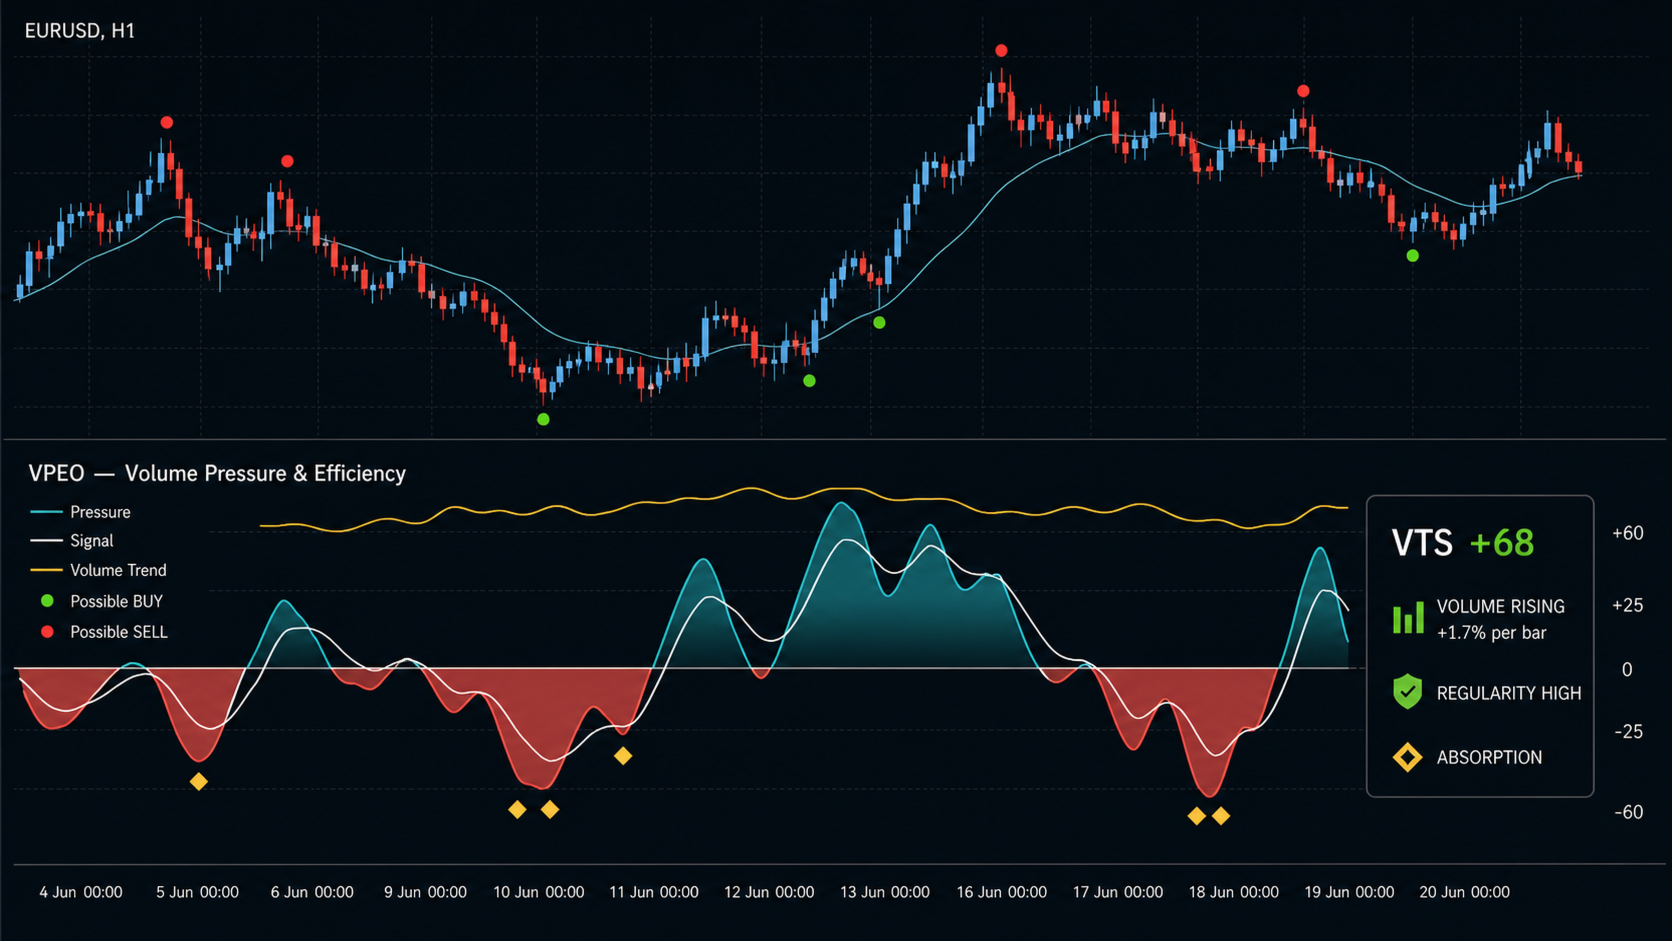
The main VPEO wave measures signed volume pressure on a scale from -100 to +100.

The calculation combines candle-body direction with the location of the close inside the candle range. This helps distinguish a candle that closes with directional conviction from a candle that contains substantial activity but finishes near the middle of its range. Volume is transformed logarithmically to reduce the excessive influence of isolated extreme values.

The resulting directional flow is normalized using the median and median absolute deviation over a configurable historical window. This robust approach is less sensitive to occasional volume spikes than a standard mean and standard-deviation calculation.

General interpretation:

  • Positive VPEO values indicate positive directional volume pressure.

  • Negative VPEO values indicate negative directional volume pressure.

  • Values close to zero indicate limited directional pressure or balanced activity.

  • Increasing absolute values indicate that directional pressure is becoming more unusual relative to recent history.

  • A return toward zero indicates that directional pressure is normalizing or losing intensity.

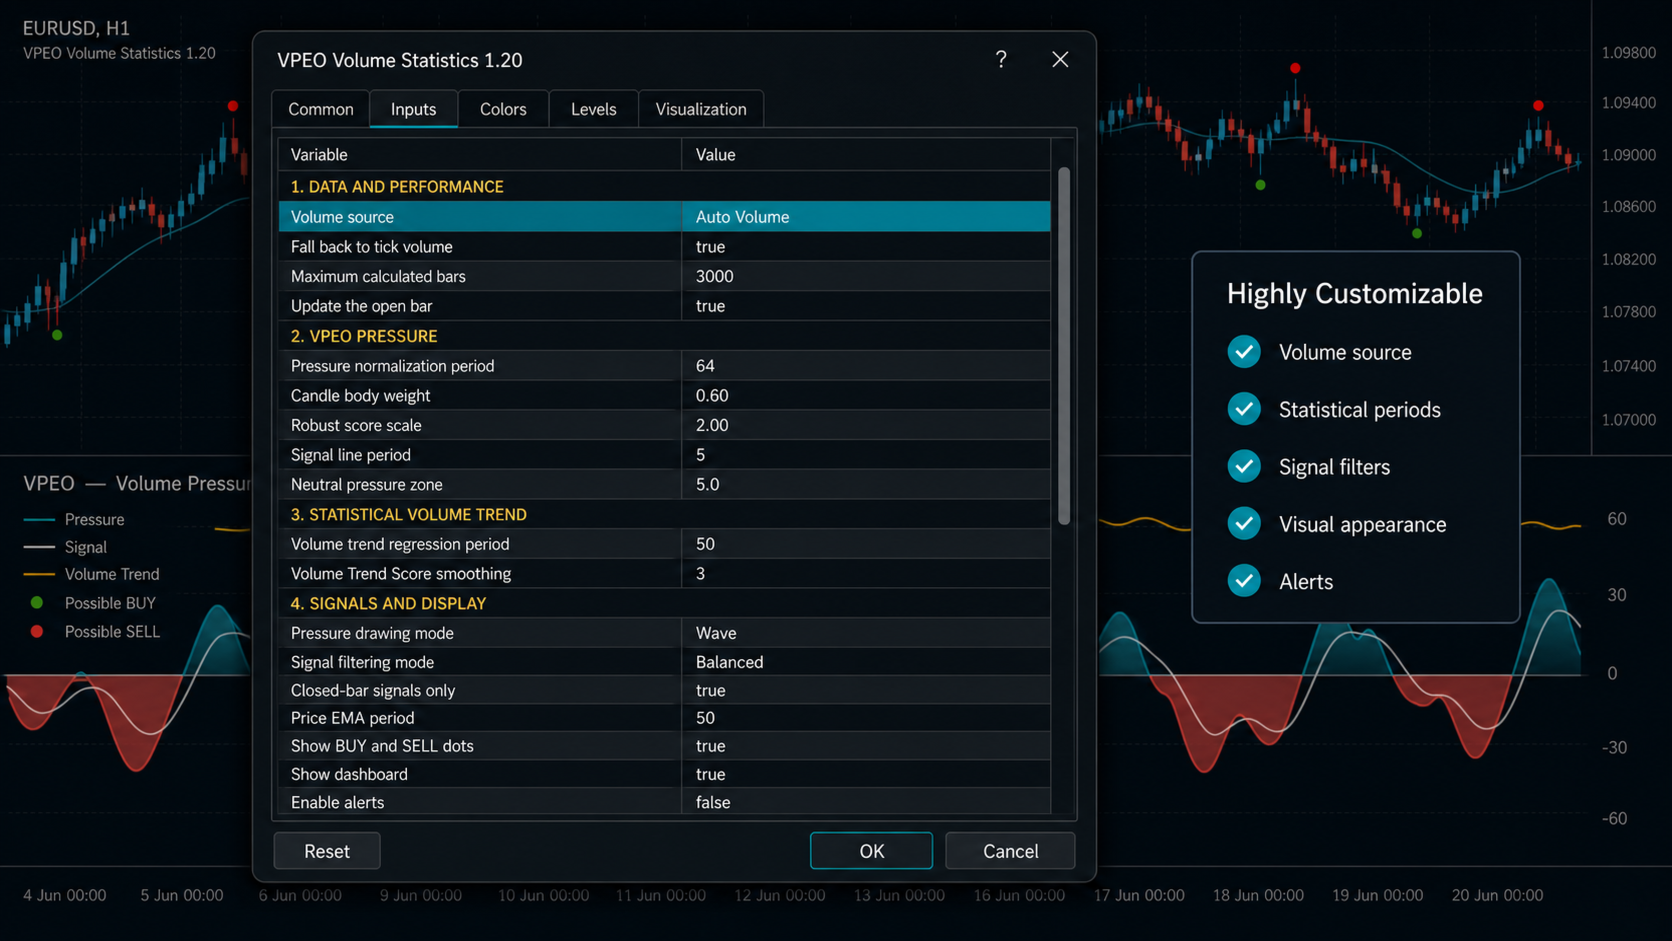
The default display is a continuous colored wave. Users can switch to a classic color histogram from the Inputs tab. The bullish, bearish, neutral, signal, trend, and absorption colors are individually configurable.

Signal Line

A smoothed signal line is calculated from the VPEO pressure wave. Its period is configurable and defaults to 5 bars.

The signal line helps identify changes in short-term pressure. Crosses between the VPEO wave and its signal line are used as one component of the optional entry-marker logic. A cross alone is not treated as a complete market decision in the default Balanced mode. Additional participation and price-trend conditions are applied before a marker is displayed.

Statistical Volume Trend Score

The Volume Trend Score, or VTS, measures whether volume is statistically rising or falling over the selected analysis period.

The indicator applies linear regression to logarithmic volume. The regression slope is evaluated relative to its estimated variability and transformed into a bounded score between -100 and +100. The VTS line is then smoothed to improve readability.

VTS measures the direction of market participation, not the direction of price:

  • A positive VTS indicates that volume is generally increasing.

  • A negative VTS indicates that volume is generally decreasing.

  • A VTS near zero indicates stable or statistically unclear volume behavior.

  • Values above the moderate or strong positive levels indicate increasingly consistent volume expansion.

  • Values below the corresponding negative levels indicate increasingly consistent volume contraction.

The dashboard also displays the estimated average percentage change in volume per bar. This value is derived from the regression slope and provides a more intuitive description of the current participation trend.

Regression regularity is reported as LOW, MEDIUM, or HIGH. This classification is based on the regression R-squared value. A high value means the recent volume trend is comparatively consistent. A low value means volume is irregular, even if the current slope is positive or negative.

Absorption and Low-Efficiency Activity

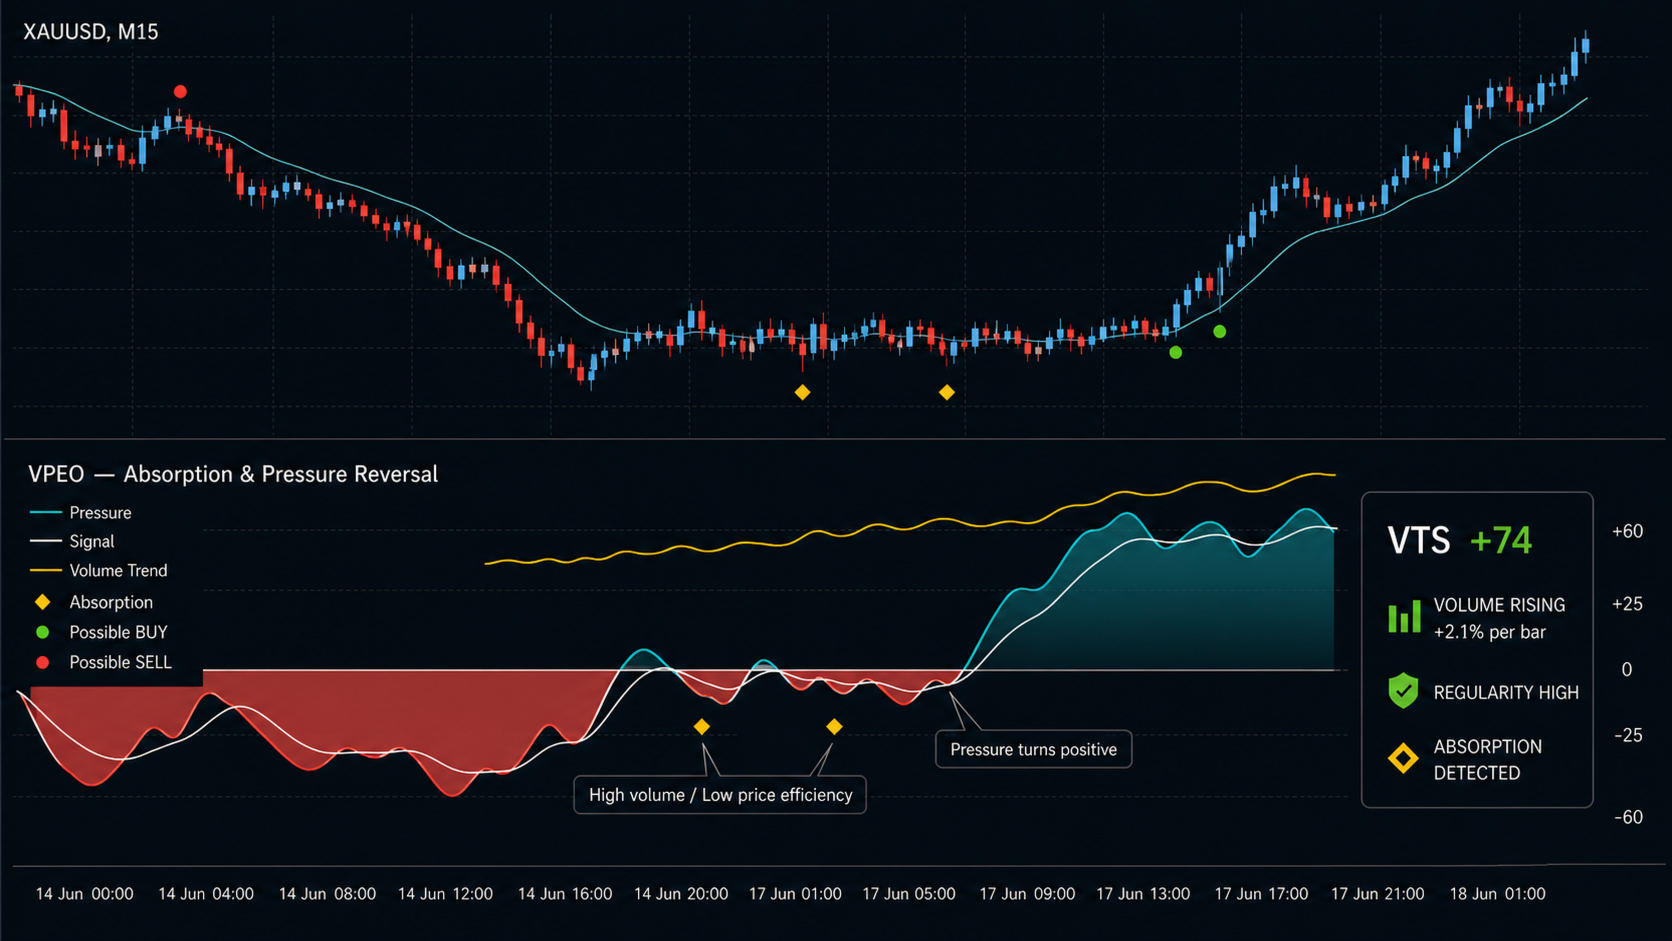
The indicator can mark potential absorption conditions.

An absorption marker requires two elements:

  • volume that is unusually high relative to its recent robust distribution;

  • limited candle-body movement relative to the complete high-low range.

This combination means that considerable activity occurred while the candle produced limited directional progress. It may represent absorption, two-sided trading, indecision, or an exhaustion phase. The marker does not determine bullish or bearish direction by itself and should be interpreted together with price structure, VPEO pressure, and the Volume Trend Score.

The absorption lookback, minimum volume z-score, maximum price efficiency, marker color, and marker position are all configurable.

Optional BUY and SELL Markers

BUY markers are displayed as green dots below price bars. SELL markers are displayed as red dots above price bars. Their colors, size, ATR-based distance from price, and historical display range can be changed.

Three signal modes are available.

Cross Only

This is the least restrictive mode. It uses a VPEO signal-line cross or pressure-threshold event together with the minimum pressure requirement. It produces more signals but does not require confirmation from the statistical volume trend or price trend.

Balanced

Balanced is the default mode. It requires:

  • a qualifying VPEO cross or pressure-threshold event;

  • the configured minimum directional-pressure value;

  • a Volume Trend Score above the configured minimum;

  • price alignment with the internal EMA when the price-trend filter is enabled;

  • no absorption condition on the same bar when absorption blocking is enabled;

  • compliance with the minimum number of bars between consecutive signals;

  • compliance with the optional maximum-spread filter.

For a BUY marker, pressure must be positive and price must be above the internal EMA when the trend filter is enabled. For a SELL marker, pressure must be negative and price must be below the EMA. The minimum VTS condition remains positive for both directions because VTS measures expanding participation rather than bullish or bearish direction.

Strict

Strict mode applies all Balanced conditions and adds:

  • a minimum positive volume anomaly;

  • a minimum regression R-squared value.

This mode is intended for users who prefer fewer conditions with stronger volume expansion and more consistent volume-trend statistics.

Closed-Bar Behavior

Closed-bar signal calculation is enabled by default. Entry markers are evaluated after the relevant candle has closed and do not use future price data.

The VPEO wave and dashboard can still update on the active candle when current-bar updating is enabled. The open candle is therefore expected to change as new ticks arrive. Users who require a completely static visual display can disable current-bar updating.

The indicator also includes an optional alert-on-attach setting. It is disabled by default to prevent an alert from being generated immediately for a signal that already existed before the indicator was added to the chart.

Volume Source Selection

Three volume-source modes are available:

  • Auto Volume: uses real trade volume when the feed provides a positive value and otherwise falls back to tick volume.

  • Tick Volume: always uses the number of price updates reported for each bar.

  • Real Volume: uses reported trade volume, with an optional fallback to tick volume when real volume is unavailable.

On decentralized Forex and many CFD symbols, tick volume may be the only available volume source. Exchange-traded instruments may provide real trade volume. Volume data can differ between brokers, servers, and liquidity feeds. Users should therefore validate the indicator with the same data source they intend to use in practice.

The active source is shown in the dashboard as REAL, TICK, or REAL N/A.

Dashboard

The optional dashboard displays a compact statistical summary:

  • current Volume Trend Score;

  • volume state: rising strongly, rising, stable, falling, or falling strongly;

  • estimated percentage change in volume per bar;

  • regression regularity;

  • active volume source.

Dashboard visibility, corner, horizontal and vertical offset, text color, background color, and border color are customizable.

Reference Levels

The oscillator uses five reference levels:

  • strong positive level;

  • moderate positive level;

  • zero line;

  • moderate negative level;

  • strong negative level.

The default moderate level is 25 and the default strong level is 60. These levels help describe pressure and volume-trend intensity. They are analytical references rather than automatic overbought or oversold levels.

Alerts

The indicator supports optional:

  • terminal popup alerts;

  • mobile push notifications;

  • email alerts;

  • sound alerts.

All alert channels are disabled by default. Alerts use the selected signal mode and the same conditions as the chart markers. The sound file can be changed through the Inputs tab.

Default Configuration

The default setup is a balanced starting point for liquid symbols, particularly on M15 to H1 charts:

  • Auto volume source with tick-volume fallback;

  • 3,000 calculated bars;

  • 64-bar VPEO normalization period;

  • 0.60 candle-body weight;

  • 2.00 robust pressure scale;

  • 5-bar signal-line period;

  • 5-point neutral zone;

  • 50-bar statistical volume-trend period;

  • 3-bar VTS smoothing;

  • moderate and strong reference levels at 25 and 60;

  • 50-bar absorption analysis period;

  • absorption volume z-score of 2.0;

  • maximum absorption price efficiency of 0.20;

  • Balanced signal mode;

  • minimum entry pressure of 10;

  • minimum Volume Trend Score of 15;

  • EMA 50 price-trend filter;

  • 5-bar minimum distance between signals;

  • ATR 14 entry-dot positioning with a 0.25 ATR offset;

  • closed-bar signals enabled;

  • continuous pressure-wave display;

  • dashboard enabled;

  • alerts disabled.

These parameters are starting values, not universal settings. Lower timeframes may require longer normalization, stronger thresholds, or a longer cooldown to reduce noise. Higher timeframes may use shorter periods when users want a more responsive display. Parameter changes should be evaluated on separate calibration and out-of-sample periods rather than optimized only on one historical interval.

Interpreting Common Conditions

Price rising, positive VPEO, and rising VTS indicate that positive directional pressure is accompanied by expanding participation.

Price rising while VTS falls indicates that the advance is occurring with decreasing participation. This is not an automatic reversal signal, but it describes weaker volume confirmation.

Price falling, negative VPEO, and rising VTS indicate increasing participation in a negative directional move.

Price falling while VTS also falls indicates that the decline is occurring with contracting activity. This can be consistent with a low-participation pullback, but market structure should be considered.

Rising VTS with VPEO near zero indicates increasing activity without clear directional efficiency. When an absorption marker is also present, the market is processing high activity with limited candle-body progress.

A strong VPEO value combined with a weak or negative VTS means that the current directional bar is notable relative to recent flow, but broader participation is not expanding consistently.

Integration with Expert Advisors

The indicator exposes data buffers that can be accessed through iCustom:

  • Buffer 0: VPEO pressure;

  • Buffer 1: VPEO color index;

  • Buffer 2: signal line;

  • Buffer 3: Volume Trend Score;

  • Buffer 4: zero line;

  • Buffer 5: absorption condition;

  • Buffer 6: BUY signal, value 1.0 on a qualifying bar;

  • Buffer 7: SELL signal, value 1.0 on a qualifying bar.

For closed-bar operation, an Expert Advisor should normally read BUY and SELL buffers at shift 1. EMPTY_VALUE indicates that no signal is present on the selected bar.

VPEO Volume Statistics does not include a trading engine. Any Expert Advisor using its buffers must separately implement order validation, position sizing, stop management, spread and slippage controls, account-mode handling, and risk limits.

Suggested Workflow

  1. Select the required volume source or keep Auto Volume enabled.

  2. Start with the default Balanced mode.

  3. Confirm that the dashboard reports the expected volume source.

  4. Observe the relationship between price, VPEO pressure, and the Volume Trend Score.

  5. Review absorption markers in the context of nearby support, resistance, or consolidation.

  6. Adjust normalization and threshold parameters only after collecting enough observations.

  7. Test the selected configuration across different market conditions.

  8. Include spread, commission, slippage, and risk-management rules in any strategy evaluation.

Important Information

VPEO Volume Statistics is intended for technical and statistical market analysis. It does not predict future prices and does not guarantee trading results. BUY and SELL dots are conditional chart markers, not personalized investment advice or complete trading instructions.

Results depend on symbol characteristics, timeframe, market regime, broker data, and the selected volume source. Historical behavior may not continue in future conditions. Users remain responsible for evaluating the indicator, defining risk controls, and deciding whether any displayed condition is suitable for their own trading process.
推荐产品
VWAP Simple
Deibson Carvalho
4.24 (29)
The Volume Weighted Average Price is similar to a moving average, except volume is included to weight the average price over a period.    Volume-Weighted Average Price [VWAP] is a dynamic, weighted average designed to more accurately reflect  a security’s true average price over a given period . Mathematically, VWAP is the summation of money (i.e., Volume x Price) transacted divided by the total volume over any time horizon, typically from market open to market close. VWAP reflects the capitali
FREE
SMC Structure Markup
Seyed Mohammad Hosseini Hejazi
4.67 (15)
Overview The Smart Money Structure Markup Indicator for MetaTrader 5 is a powerful tool designed to help traders identify key market structures based on popular Smart Money Concepts (SMC) strategies. This indicator detects micro-market structures, providing insights into price movements and potential trend changes. It highlights important elements such as valid Break of Structure (BOS), Change of Character (CHoCH), and Inducement (IDM), helping traders to make informed decisions. Key Features Ma
FREE
Weis Waves(魏斯波浪) 是由大卫·魏斯 (David Weis) 开发的技术指标,灵感来源于理查德·威科夫 (Richard Wyckoff) 的原理。 与传统逐根显示的成交量不同,Weis Waves 将成交量累积为连续的上涨或下跌“波浪”,当价格方向反转时重新开始计算。 这种方法使交易者能够清晰地看到市场运动的 真实力度 ,因为每一波浪都反映了支撑一系列K线的成交量强度。 主要特点: 将成交量分组为买入波浪和卖出波浪。 突出显示市场的主导力量(买方或卖方)。 有助于识别 趋势延续 或 潜在反转 。 基于威科夫方法论,被广泛应用于成交量与资金流分析。 Weis Waves 被众多专业交易者使用,用于分析价格与成交量之间的平衡,提供更深入的市场动态视角。
FREE
KVO Indicator
Saullo De Oliveira Pacheco
Klinger Volume Oscillator (KVO) - A Powerful Trend & Momentum Indicator This is an enhanced version of the Klinger Volume Oscillator (KVO) , a widely used indicator designed to help traders identify momentum shifts, trend direction, and overbought/oversold conditions in the market. How the KVO Indicator Works: Volume-Based Trend Identification – Unlike traditional oscillators that rely solely on price movements, the KVO uses both price and volume to detect market trends and momentum shifts .
FREE
VWAP + Volume Profile Combined Indicator FREE Launch Offer OVERVIEW Professional combination of VWAP (Volume Weighted Average Price)  and Volume Profile in a single MT5 indicator. This powerful tool  combines two of the most respected institutional trading tools  into one seamless display. KEY FEATURES 1. VWAP with 6 calculation modes 2. Volume Profile with Value Area analysis 3. Point of Control identification 4. Standard deviation bands 5. Dynamic color changing 6. Separate buy/sell vol
FREE
Graphic Alignment Context
Ricardo Alexandre Laurentino
The Graphic Alignment Context (GAC) Technical Indicator measures the vertical difference of the simple average price of a financial instrument in the context of three different timeframes determined by a defined number of bars or candles (periods) to determine the strength of the buy or sell trend. sale. Ascending average prices indicate Buying strength (1), Descending average prices indicate Selling strength (-1) and any scenario different from the previous two conditions indicates Neutrality
FREE
XAU Anchored VWAP Pull H4 Expert Advisor for MetaTrader 5 — Gold / XAUUSD focus Version: 1.00 What it is XAU Anchored VWAP Pull H4 is an Expert Advisor for gold on the H4 chart. Anchored VWAP pullback continuation style for gold H4. Built for structured automated participation — not grid , not martingale . Evaluate on your broker and risk profile before any live use. This product is a technical system . Exact thresholds and entry equations remain internal product design and are not published he
FREE
Weis Waves
Flavio Javier Jarabeck
2.83 (18)
The original author is David Weis, an expert in the Wyckoff Method. The Weis Wave is a modern adaptation of the 1930's Wyckoff Method, another expert in Tape Reading techniques and Chart Analysis. Weis Waves takes market volume and stacks it into waves according to price conditions giving the trader valuable insights about the market conditions. If you want to learn more about this subject you can find tons of videos in YouTube. Just look for "The Wickoff Method", "Weis Wave" and "Volume Spread
FREE
White Weis Volume Ticks
Ricardo Almeida Branco
5 (4)
White Weis Volume This indicator shows the sum of the volume in each wave, bulish or bearish, as idealized by David Weis , but it brings an important addition , which is the marking of the bar with the highest volume of the wave (White Bar)! In coding the indicator, it was sought to optimize the code to require minimal processing during use and not to overload mt5. The indicator can be used for pre-trading analysis and study, where the trader analyzes possible points of support and resistance
VWAP Indicator
LUC JACOBUS A VERHEECKE
4.11 (27)
Volume Weighted Average Price (VWAP) The volume weighted average price (VWAP) is a  trading   benchmark  used by traders that gives the average price a security has traded at throughout the day, based on both volume and price. It is important because it provides traders with insight into both the trend and value of a security. This indicator VWAP V2 is free and is the manual version of the extended Easy VWAP indicator (30 Euro), where the date and time properties are automatically entered. With
FREE
Quantora Fair Value Gap Pro MT5 is a MetaTrader 5 indicator that detects bullish and bearish Fair Value Gap zones created by price imbalances. Detected zones are displayed on the chart and can be extended until the selected mitigation condition is met. The indicator tracks active, mitigated and fully filled zones according to its input settings. Fair Value Gap Detection Bullish and bearish Fair Value Gap detection Active, mitigated and fully filled zone tracking First Touch and Full Fill mitigat
FREE
KD MTF Dashboard
Dien Du Khanh Duong
KD MTF Dashboard displays ADX, RSI, MACD and EMA trend readings for the current chart's symbol across any combination of timeframes from M1 to D1 (up to 6 at once, M1/M5/M15/H1 by default), in a single table. It is designed to show whether a symbol's timeframes agree with each other, without needing to switch between charts. Key Features Multi-Timeframe Indicator Table: Displays ADX(14), RSI(14), MACD Main/Signal comparison, and EMA(20)/EMA(200) comparison for the current symbol, one column per
FREE
Market Momentum
Flavio Javier Jarabeck
4.43 (7)
The Market Momentum indicator is based on the Volume Zone Oscillator (VZO), presented by Waleed Aly Khalil in the 2009 edition of the International Federation of Technical Analysts journal, and presents a fresh view of this market valuable data that is oftenly misunderstood and neglected: VOLUME. With this new approach of "seeing" Volume data, traders can infer more properly market behavior and increase their odds in a winning trade. "The VZO is a leading volume oscillator; its basic usefulness
FREE
Daily VWAP Indicator
Rafael Gazzinelli
5 (7)
Daily VWAP Indicator (Volume Weighted Average Price) Special Deal! Leave a review and get the indicator  Long & Short Cointegration Analyzer for free — just send me a message! Description The Daily VWAP (Volume Weighted Average Price) indicator is an essential tool for traders seeking to identify the true average price of an asset throughout the day, adjusted by traded volume. Primarily used by institutional and professional traders, the daily VWAP serves as a reference point to identify the av
FREE
==================================================================== SMT DIVERGENCE - NASDAQ vs S&P500 (NAS100 / US500) MQL5 Market Product Description ==================================================================== PRODUCT NAME: SMT Divergence Nasdaq vs S&P500 | Smart Money Index Scalper SHORT DESCRIPTION (max 63 chars): Spot Nasdaq reversals using SMT Divergence with S&P500 ---------------------------------------------------------------------- FULL DESCRIPTION ---------------------
FREE
Super Trend eu
Emin Ulucanli
4.83 (6)
SUPERTREND; It is a trend following indicator based on the SuperTrend ATR created by Olivier Seban. It can be used to detect changes in trend direction and locate stops. When the price falls below the indicator curve, it turns red and indicates a downtrend. Conversely, when the price moves above the curve, the indicator turns green, indicating an uptrend. Like other indicators, it works well on SuperTrend when used in conjunction with other indicators such as MACD, parabolik SAR, Bollinger Band
FREE
Cloud Trend Martrix
Alvaro Garcia Batelli
Cloud Trend Matrix: The Trend Indicator That Adapts to the Market Tired of indicators that work well in strong trends but generate dozens of false signals in sideways markets? The Cloud Trend Matrix was designed to solve this exact problem. It's not just another trend follower; it's an intelligent system that reads market volatility and adapts its entry triggers to deliver signals with a higher probability of success. ️ The Concept: A Low-Latency Cloud Unlike traditional indicators, the Cloud T
FREE
Scalping PullBack Signal
Quang Huy Quach
5 (1)
1. Overview The Scalping PullBack Signal indicator is a powerful technical analysis tool designed to help traders identify scalping opportunities based on potential pullback and reversal signals. This tool is particularly useful on lower timeframes (below 15 minutes) but can also be applied on higher timeframes for longer-term trades. This indicator integrates several key analytical components, providing a comprehensive view of trends and potential entry/exit points, helping you make quick and e
FREE
PivoTrack VP 一款适用于MetaTrader 5的枢轴锚定成交量分布指标,在连续的枢轴高点与低点之间绘制成交量分布图,揭示价格接受与拒绝区域。 PivoTrack VP是MetaTrader 5的成交量分析指标。它自动识别任意图表上的枢轴高点(Pivot High)和枢轴低点(Pivot Low),并为它们之间的每个区间绘制完整的成交量分布图。指标显示控制点(POC)、价值区高点(VAH)、价值区低点(VAL)以及价值区背景填充,让交易者清晰了解每次价格波动中成交量的分布情况。另有一个实时发展中的分布图,持续追踪从最近确认的枢轴到当前K线的区间。   概述 指标通过识别具有可配置左右K线数量的枢轴高点和低点,将图表历史划分为多个区间。对于每个已完成的区间,指标计算成交量在可配置数量的价格行上的分布,绘制直方图,将成交量最高的行标记为控制点,并从该行向外扩展以确定价值区。价值区代表用户定义的区间总成交量百分比所对应的价格范围。直方图柱的颜色区分价值区内外的行。从最后一个确认枢轴到实时K线的发展中区间在每根K线上重新绘制,始终显示当前结构。当价格穿越发展中区间的POC、VAH或
FREE
Simple Weis Wave
Jean Jacques Huve Ribeiro
3.67 (3)
One of the best tools for analyzing volume, Weis Wave was idelized by David Weis, to facilitate the reading of directional flow. For the VSA method disciples it is an evolution of the practices created by Richard Wycoff, facilitating a predictive reading of the market, always seeking an accumulation and distribution of the negotiated contracts. Cumulative wave volume  Range of wave ( removed) Average Wave volume Ref "Tim Ord lectures" ( removed)
FREE
Umagads Candle Timer MT5:纪律交易者的专业精准计时工具 在快速波动的市场中,准确掌握蜡烛图收盘时间是区分完美进场与错失机会的关键。 Umagads Candle Timer MT5 是一款专为要求极致精确执行的交易者设计的高效工具。无论您是进行 M1 超短线交易还是日线波段交易,此工具都能为您提供实时的倒计时提醒,确保您始终比市场走势领先一步。 核心功能: 智能时间显示: 根据周期自动调整格式:日内显示“分:秒”,小时图显示“时:分:秒”,长期图表则增加天数显示。 视觉紧急系统: 在最后 10 秒倒计时,计时器颜色自动变为橙色,为您的决策提供直观的视觉信号。 动态位置选择: 支持“跟随价格”显示或固定在图表的四个角落,确保工作区整洁且互不干扰。 多渠道警报: 集成弹窗、手机推送和电子邮件警报,并支持提前 30 秒预警功能。 极致优化: 采用精简代码编写,即便在成交活跃的高频行情下也能确保零延迟运行。
FREE
LC Multi Session VWAP
Juergen Jakob Preusse
LC Multi Session VWAP 全球金融市场会随着交易时段从 Asia 转换到 London ,再进入 New York 而不断变化。每个交易时段都有其独特的价格行为、流动性特征和市场平衡。 LC Multi Session VWAP 的设计目标是清晰地展示这些差异。与使用贯穿全天的单一 VWAP 不同,本指标为每个主要交易时段分别计算独立的 Volume Weighted Average Price (VWAP) 。 可分别显示以下交易时段的 VWAP: Asia London New York 因此,每个交易时段都可以独立分析,帮助交易者更轻松地比较一天中不同阶段的市场变化。 可选的 Sigma Bands 显示价格与当前交易时段 Fair Value 之间的距离,为市场分析提供更多参考信息。 专为日内交易者设计 本指标特别适合希望观察以下内容的交易者: 每个交易时段的 Fair Value 全球交易时段之间的切换 价格相对于 VWAP 的位置 趋势市场与平衡市场 围绕 Fair Value 的价格扩张与回归 LC Multi Session VWAP 专注于市场分析,
FREE
Time Dashboard
Pankaj Kushwaha
Time Dashboard MT5 is a powerful and user-friendly MetaTrader 5 indicator designed to provide real-time time zone and clock information directly on your trading chart. Ideal for forex traders and global market participants, this tool displays server time, local time, and the time difference between them, enhancing your ability to manage trades across different time zones. Key Features : Real-Time Time Display : Shows current server time, local time, and their respective time zones with precise o
FREE
MIDAS Super VWAP
Flavio Javier Jarabeck
4.27 (11)
Imagine VWAP, MVWAP and MIDAS in one place... Well, you found it! Now you can track the movement of Big Players in various ways, as they in general pursue the benchmarks related to this measuring, gauging if they had good execution or poor execution on their orders. Traders and analysts use the VWAP to eliminate the noise that occurs throughout the day, so they can measure what prices buyers and sellers are really trading. VWAP gives traders insight into how a stock trades for that day and deter
FREE
MT5 全球交易时段时间轴仪表板 “全球交易时段时间轴仪表板”是一款实用型指标,可在图表上直观地显示主要外汇市场(悉尼、东京、伦敦和纽约)的交易时段。用户可以通过可拖动的仪表板监控各时段的实时状态,并单独控制图表上显示的各时段垂直线。 [主要功能] 交互式仪表板:配备一个可在图表上自由拖动的面板,利用进度条直观展示四大市场时段的交易时间。 独立时段线条控制:点击仪表板左侧的“ ON/OFF”按钮,即可切换各时段开盘与收盘时间垂直线的显示状态。 状态保存:即使更改图表时间周期,仪表板的位置坐标(X、Y)及各时段按钮的开启/关闭状态仍会保持不变。 高度可定制:用户可设置 GMT 偏移量以匹配经纪商服务器时间,并针对四大时段分别配置开盘时间、收盘时间及显示颜色。 一键移除:点击仪表板右上角的“X”按钮,即可立即从图表中移除仪表板面板及所有时段线条。 [输入参数] SERVER TIME OFFSET(服务器时间偏移):设置经纪商服务器时间的 GMT 偏移量。 SYDNEY / TOKYO / LONDON / NEW YORK SESSION(悉尼/东京/伦敦/纽约
FREE
ADX consolidado
OTAVIO AGUIAR CAMPOS Aguiar
5 (3)
Mostra a média móvel quando ADX > 20 e pinta de verde ou vermelho quando os valores de ADX estão subindo indicando tendência. Quando o ADX é menor que 20 indica movimento lateral consolidado. O indicador não define pontos de entrada, somente mostra a média colorida quando a tendência está se fortalecendo. Faz parte do grupo de indicadores do Indicador Tavim.
FREE
Smart Structure Buy Sell Signals is a visual market structure indicator developed primarily for Gold (XAUUSD) intraday trading on MetaTrader 5. The indicator combines market structure, momentum, liquidity behaviour and supply-demand zones to identify potential Buy and Sell opportunities. It provides clear trading levels while keeping the final trading decision completely under the user’s control. This is a manual trading indicator. It does not open, modify or close real trades. Main Features • C
FREE
AI Forecasts MT5
Suleiman Alhawamdah
AI Forecasts MT5指标: 基于人工智能与深度学习(AI + ML)的未来预测系统 _ 主要特点: 基于动态数据分析,最多可预测未来20根K线 适用于剥头皮交易 多色预测图表反映置信度,当前买卖状态旁显示白色点计数器 概率区间显示预期价格路径及其概率变化范围与方向 主要基于Shock Pullback指标的多变量分析,包括: 回调区域、缺口开盘与收盘的计算研究 黄色箭头生成的斜率、加速、减速与反弹信号 曲折指标角度与突破/上升趋势区域计算 旗形与模式图谱等模型分析 累积区域与缺口的建模分析及其对未来走势影响 图表形态在预测计算中的整合 人工智能: 采用MQL5结构与环境设计的先进神经网络架构"注:学习与AI系统为内置式,不依赖Python等外部环境" _ 5层深度神经网络: • 第一层:32个神经元(24个特征输入) • 第二层:16个神经元 • 第三层:8个神经元 • 第四层:4个神经元 • 第五层:2个神经元(预测值与置信度输出) 智能注意力机制: 动态聚焦关键特征 基于集成计算与模型表现的权重自动更新系统 _ 分析特征(24项进阶特征): 订单流与多
Daily Volatility Tracker MT5
Suvashish Halder
5 (1)
Daily Volatility Tracker   is a practical and lightweight indicator designed to help traders monitor and analyze market volatility based on historical daily price movements. Whether you're a day trader, swing trader, or scalper, understanding how much a market moves per day is critical for: Choosing the right pairs to trade Setting accurate stop-loss and take-profit levels Adapting to changing market conditions MT4 Version -  https://www.mql5.com/en/market/product/134958/ Join To Learn Market De
FREE
Value Chart Candlesticks
Flavio Javier Jarabeck
4.57 (14)
The idea of a Value Chart indicator was presented in the very good book I read back in 2020 , " Dynamic Trading Indicators: Winning with Value Charts and Price Action Profile ", from the authors Mark Helweg and David Stendahl. The idea is simple and the result is pure genius: Present candlestick Price analysis in a detrended way! HOW TO READ THIS INDICATOR Look for Overbought and Oversold levels. Of course, you will need to test the settings a lot to find the "correct" one for your approach. It
FREE
该产品的买家也购买
Trend Sniper X
Sarvarbek Abduvoxobov
4.9 (41)
Trend Sniper X 是一款适用于 MetaTrader 5 的多周期趋势跟踪指标,可帮助交易者清晰精准地识别趋势方向和潜在的反转点。 适用于 MT4: https://www.mql5.com/en/market/product/193245 价格信息: 当前价格为促销价,随着后续更新和新功能的推出,价格可能会有所变动。 赠品优惠: 购买后联系作者,即可免费获取该指标的 Auto-Trade Assistant EA(自动交易助手 EA)。 Code2Profit 频道 通过多时间框架分析掌控市场! 如何使用 Trend Sniper X 最大化您的胜率:核心规则与交易时段技巧 技术规格 平台 MetaTrader 5 指标类型 多时间周期趋势指标 运行时间周期 任何图表时间周期,可独立选择更高的时间周期 (M1–MN1) 主要交易品种 外汇、黄金 (XAUUSD) 及其他差价合约 (CFD) 推荐账户 任何账户类型 可视化 彩色趋势蜡烛 (买入/卖出/微弱/变化) + 买入/卖出箭头 附加模块 交易时段方框 (悉尼、东京、伦敦、纽约) 主要功能 多时间周期趋势分析: 直接在
Smart Trend Trading System — MetaTrader 5 购买后,请在 MQL5 上给我发消息,即可免费获得 Smart Universal Expert Advisor,以及在线课程、PDF 手册和私人群组访问权限。 STTS 将趋势方向、入场和出场信号、反转区域及重要价格水平集中呈现在图表上。您可以根据系统手动交易,也可以连接单独的兼容 EA,按照您选择的设置自动执行交易。 一套系统,四种交易思路 STTS 将交易方法分为四大类: • 剥头皮交易 — 跟踪短期信号和市场波动。 • 趋势交易 — 评估方向,寻找趋势中的交易机会。 • 反转交易 — 识别潜在的转折区域和方向变化。 • 成交量交易 — 利用成交量相关信息评估市场活跃程度。 入场和出场箭头、趋势信息、支撑与阻力位及反转区域,帮助您直接在图表上分析交易形态。 先从一种方法开始。了解其信号和设置后,再探索其他方法。 从信号到自动化 Smart Universal Expert Advisor 可连接 STTS,让您自动执行受支持的交易信号。 启用自动交易前,请配置指标连接、仓位大小和交易管理设置
Zoryk Gold
Reda El Koutbane
5 (16)
折扣将在 24 小时后结束——下一价格为 69 美元 ZORYK — MetaTrader 5 专用高级 XAUUSD 黄金信号系统 你一定熟悉这种感觉。 你花了很多时间分析黄金,等待合适的入场机会。终于开仓后,价格却立刻朝相反方向移动。你过早平仓、移动止损,或者只犹豫了几秒钟。随后,市场却在没有你的情况下到达了你原本预期的目标。 问题并不总是方向判断错误。 真正的问题是缺乏确定性。 你不知道准确的入场位置在哪里。 你不知道什么时候交易逻辑已经失效。 你不知道应该先锁定较近的利润,还是继续等待更大的行情。 你也不知道当前信号是否足够强,还是自己只是在强行寻找交易机会。 黄金市场变化非常快。一个没有明确计划的好想法,可能在几秒钟内变成错误的交易决定。 ZORYK 正是为了解决这个问题而开发。 什么是 ZORYK ZORYK 是一套完整的 XAUUSD 黄金信号与交易计划系统,专门为 MetaTrader 5  和 M5 时间周期 开发。 它不是一个只显示 BUY 或 SELL 箭头,然后让你独自决定其余所有内容的简单指标。 每个确认后的信号都可以在图表上显示完整的可视化交易计划,包
SuperScalp Pro
Van Minh Nguyen
4.56 (36)
SuperScalp Pro - Professional Multi-Layer Confluence Scalping System SuperScalp Pro 是一款高级剥头皮交易指标,在经典 Supertrend 的基础上加入了多个智能确认过滤器。它可以帮助您识别概率更高的 Buy/Sell 交易机会,同时显著减少虚假信号。 清晰的 Buy 和 Sell 箭头会直接显示在图表上,基于 ATR 的 Stop Loss 和 Take Profit 水平会实时自动计算。 购买后,请联系我获取设置指导和推荐配置。 使用 SuperScalp Pro Auto Trader 轻松实现信号自动化: [Auto Trader] 下载推荐设置文件: [Set File] 完整文档请参阅产品博客: [User Guide] 加入官方频道获取最新更新: [Official Channel] SuperScalp Pro 如何工作? 只有当多个确认层同时一致时,指标才会生成交易信号(趋势 + 动能 + 成交量 + 波动率)。 您可以手动交易,也可以连接 SuperScalp Pro Auto Tr
全新王者降临 - 指标 + 订单管理提示(TP1 + TP2 + TP3)+ 可选 Telegram 信号发送器 INCLUDED(免费) (完整交易与信号系统) 我们最强的黄金 EA: Gold Slayer 该指标包含先进的交易策略、可自定义订单管理系统,以及结合 Envelope 扩展的均值回归系统,并通过 RSI 等多重智能确认过滤器进行验证,以捕捉高概率反转入场机会,提供 BUY 与 SELL 信号。 你不仅能够学习如何交易,还能学会如何高效管理多个仓位,并利用之前盈利的持仓来覆盖亏损交易。 专为 M5 周期打造并优化,在 BTCUSD 和 XAUUSD 上表现尤为出色,因为这些市场的流动性能够让信号更加干净、可靠。 该指标会自动生成清晰的多头(Long)与空头(Short)信号,同时基于 ATR 自动计算入场位、止损位和止盈位,让风险管理从一开始就融入系统之中。 多 TP 系统设有三个渐进式目标位,你可以在 TP1 锁定部分利润、在 TP2 继续持仓,并在更大的行情中将仓位持有至 TP3,而这正是平均风险回报比真正开始大放异彩的地方。 默认参数开箱即用,已经针对稳定表现进行
SMC Intraday Formula
VividMind Digital Solutions
5 (26)
让我们先坦诚一点。 没有任何一个指标可以单独让你实现盈利。如果有人告诉你可以,那他是在向你兜售一个梦想。任何显示完美买卖箭头的指标都可以被做得看起来毫无瑕疵——只需要放大历史中的某一段并截取成功交易的截图。我们不会这样做。 SMC Intraday Formula 是一个工具。 它为你读取市场结构,标记出概率最高的价格区域,并用简单直白的语言准确告诉你当前智能资金的行为轨迹。你仍然需要做决定。你仍然需要执行交易。但现在,你是带着精确性执行,而不是靠希望。 我们已经在黄金(XAUUSD)以及主要外汇货币对的日内剥头皮交易中使用该指标将近三年。这是我们在 M1、M5、M15 和 M30 上的日常主力工具。它之所以有效,是因为它不试图预测未来——它展示的是当前正在形成的高概率交易机会,并解释 为什么 。 它与其他所有指标有什么不同? 大多数交易指标只做一件事。移动平均线交叉。振荡指标触及某个水平。出现一个箭头。你进场交易。你亏损。你责怪指标。重复。 SMC Intraday Formula 将多个机构级概念整合为一个统一的市场解读: - 斐波那契共振引擎 不只是普通的斐波那契水平——该指标
GoldenX Entry MT5
VividMind Digital Solutions
5 (16)
GoldenX Entry 是一款用于 MT5 的指标,包含自适应 Smart Entry Trend 算法、信号评分系统、市场状态识别器以及波动率过滤器。每个信号都包含计算得出的入场位、三个止盈位(TP1、TP2、TP3)以及止损位。它基于多个分析层构建,旨在适应不同市场条件,将多层分析系统与内置优化器及统计跟踪系统相结合。该指标基于风险收益比(RR)指标和历史交易行为提供量化分析。 开始使用非常简单——在所选时间周期上运行优化器,然后在图表上开始使用该指标。 核心功能 GoldenX Entry 将信号引擎与内置交易管理及历史统计跟踪整合在同一图表中: - 内置优化器: 优化器可在图表上单击运行。它通过两阶段搜索流程测试200种参数组合——先进行探索,再进行优化——并在完成后自动应用选定配置。结果会按时间周期缓存,因此当返回已优化的周期时,会立即恢复相同设置。 - 黄金品种自动周期识别: 将指标加载到任何 XAUUSD 图表(M1 到月线)。系统会自动识别当前周期并加载对应预设。共包含9个时间周期配置文件,专为黄金在标准周期上优化设计。切换周期时,参数会自动调整。 - 资金参考面
让您的交易优势尽在视野之中! M5 Sniper 是 MeanFX 推出的一款全新指标。它将 精准的交易信号 与 自适应 TP/SL 水平 相结合——从而创造出最佳的统计交易机会! 每售出 5 份,价格上涨一次,下一价格为 69$ 购买后请给我发消息,以获取技巧/指南和奖励 EA 它有哪些突出优势? 经过验证的统计表现 ,适用于 Gold XAUUSD( 几乎适用于每一种资产 ,专注于掌握一个时间周期,而不是试图面面俱到却无法获得稳定的结果) 每天每个交易品种 1 至 8 笔交易 ,具有较高的胜率百分比,并让所有统计优势站在我们这一边 图表上 仅显示已确认的 BUY 和 SELL 信号 自适应 TP 和 SL 水平 ,由指标针对每笔交易生成 平均胜率 75%+ 平均 Signal Ratio 最低 1.1+ 警报 和通知也会发送至 手机 **适合 Prop Firm(资金管理公司)**的交易方式 易于理解——适合 所有经验水平 的交易者 创作者提供的个人支持 100% 不重绘、不重新绘制、不滞后 奖励自动化 Expert Advisor(EA) 背后的策略: M5 Sniper 基于
Auto Optimized SpeedAngle 是一款机构级的动量向量化系统,通过持续的前瞻优化(Walk-Forward Optimization, WFO)彻底消除了曲线拟合(curve-fitting)。该指标没有采用在市场 状态转换时容易失效的静态输入参数,而是利用出样外验证(Out-of-Sample, OOS) dynamically 动态重新校准设置,从而确保显示的 信号代表真正的统计优势,而非历史巧合。 核心机构级架构 前瞻优化引擎(Walk-Forward Optimization Engine): 核心算法持续扫描数千种回溯周期(lookback)与阈值组合,严格将数据划分为样本内(in-sample)和样本外(out-of-sample)。只有当参数配置在未知数据环境中证明具备数学优越性时,系统才会对其进行 adoption。 量化目标函数(Quantitative Objective Functions): 优化引擎不一味追求绝对毛利,而是聚焦于机构级的稳定性指标。用户可针对系统质量数(SQN)、期望值(每笔交易的平均 R 倍数)或净 R 值进行优化,从而优
Entry Points Pro for MT5
Yury Orlov
4.52 (151)
传奇回归:Entry Points Pro 10。 这款传奇指标曾 3 年稳居 MQL5 Market 前三,如今全面重启。 数百条热情好评(两个版本合计 589 条),每天有数千名交易者用它交易,演示版下载 31,000+   MT4+MT5  次。 五年来我读过你们的每一条评价——在第 10 版里,我没有给出许诺,而是把答案直接做进了产品。指标作者自 1999 年入市, 珍视诚信、自己的声誉和自己的客户 。 Entry Points Pro 给出的入场信号严格不重绘。 而且这一次不再只是作者的一面之词,而是可验证的事实:确认信号只在 K 线收盘后标出,自动化测试记录到 零重绘 (在 EURUSD、XAUUSD 和 BTCUSD 上共 2,486,568 次不变量检查——0 次违规)。测试方法完全公开——您可以在策略测试器中自行复现。 购买后请务必第一时间给我发私信。 我会发给您 扩展版说明书《交易者圣经》 ——使用本指标交易的完整指南——并告诉您如何免费获得 赠品:市场扫描器 ,它能同时分析多个品种和多个时间周期,并在一个界面上显示 Entry Points Pro 此刻在哪里表现
Neuro Poseidon MT5
Daria Rezueva
4.75 (52)
Neuro Poseidon is a new indicator by Daria Rezueva. It combines precise trading signals with adaptive TP/SL levels - creating best possible trades as a result! Message me and get  Neuro Poseidon Assistant  as a gift to automize your trading process! What makes it stand out? 1. Proven profitability on all assets and timeframes 2. Only confirmed BUY and SELL signals present on the chart 3. Adaptive TP & SL levels generated by the software for each trade 4. Easy to understand - suitable for al
Gann Made Easy MT5
Oleg Rodin
5 (11)
Gann Made Easy   是一个专业且易于使用的外汇交易系统,它基于使用先生理论的最佳交易原则。 W.D.江恩。该指标提供准确的买入和卖出信号,包括止损和获利水平。您甚至可以使用推送通知在旅途中进行交易。 购买后请联系我,即可免费获得交易指导和超棒的额外指标! 您可能已经多次听说过江恩交易方法。通常 Gann 的理论不仅对于新手交易者而且对于那些已经有一定交易经验的人来说都是非常复杂的东西。这是因为江恩的交易方法在理论上并不那么容易应用。我花了几年时间来完善这些知识,并将最好的原则应用到我的外汇指标中。 该指标非常易于应用。您所需要的只是将其附加到您的图表并遵循简单的交易建议。该指标不断进行市场分析工作并寻找交易机会。当它检测到一个好的入口点时,它会为您提供一个箭头信号。该指标还显示止损和获利水平。 换句话说,当您像先生一样进行交易时,该指标会为您提供最佳江恩建议。江恩亲自告诉你此时此刻该做什么。但最好的部分是您不需要了解任何有关江恩交易原则的知识,因为该指标会为您完成整个市场分析工作。
ARIPoint
Temirlan Kdyrkhan
1 (4)
ARIPoint is a powerful trading companion designed to generate high-probability entry signals with dynamic TP/SL/DP levels based on volatility. Built-in performance tracking shows win/loss stats, PP1/PP2 hits, and success rates all updated live. Key Features: Buy/Sell signals with adaptive volatility bands Real-time TP/SL/DP levels based on ATR Built-in MA Filter with optional ATR/StdDev volatility Performance stats panel (Success, Profit/Loss, PP1/PP2) Alerts via popup, sound, push, or email Cu
Adaptive Price Action Engine 买指标,免费送EA 自适应多时间框架趋势与K线形态智能分析系统 市场环境始终在变化,不同的市场阶段中,并非所有 Price Action 形态都具有相同的参考价值。 Adaptive Price Action Engine 旨在适应不断变化的市场条件,将 趋势结构、多时间框架分析、K线形态与统计优化 整合到一个统一的分析框架中。 两种自适应模式 Dual Alpha Trend Mode(双 Alpha Trend 模式) 自动搜索适合的 Alpha Trend 参数,并结合低周期与高周期市场结构,使指标能够根据近期市场行为动态调整趋势识别。 Candlestick + Alpha Mode(K线 + Alpha 模式) 将 Alpha Trend 市场状态与 22种多空K线形态 相结合。系统不会简单地对所有形态一视同仁,而是对不同的形态组合进行统计评估,并识别在特定市场环境下表现出更强历史统计特征的配置。 主要功能 趋势参数自动优化 多时间框架市场状态分析 22种多头与空头 Price Action K线形态 对数千种可能
Gold Entry Sniper
Tahir Mehmood
5 (21)
Gold Entry Sniper – 专业多周期ATR黄金交易仪表盘,适合黄金剥头皮与波段交易 Gold Entry Sniper 是一款先进的 MetaTrader 5 指标,旨在为 XAUUSD 及其他品种提供精准的 买/卖信号 。基于 ATR 移动止损逻辑 和 多周期分析仪表盘 ,适合剥头皮交易者与波段交易者,帮助识别 高概率黄金入场点 。 主要功能与优势 多周期信号分析 – 同时显示 M1、M5、M15 趋势方向。 基于ATR的动态止损 – 根据波动性自动调整。 专业图表仪表盘 – 展示信号状态、ATR水平、线性回归中线和交易方向。 清晰买卖标记 – 自动箭头与文字标签提示。 离场提示与交易管理 – 自动检测离场信号锁定利润。 全面自定义 – 调整仪表盘位置、颜色、字体及参数。 专为黄金优化 – 适用于 M1至M15 黄金剥头皮 ,也适合外汇、指数与加密货币。 为什么选择 Gold Entry Sniper? 为追求 快速、精准、可视化交易决策 的交易者打造,ATR 与多周期确认结合,帮助你抓住 最佳黄金入场点
您好,交易员! 大多数散户交易者依赖于滞后的网页脚本。真正具有交易优势需要机构化的架构。 Astro AI 指标并非标准的图表叠加层。它是一个编译后的神经网络,包含两个代理,直接运行在您的终端上。 以下是该系统背后的具体技术: 1. 代理 1:分析师(图神经网络 - GNN) 市场并非孤立的价格柱;它们是相互关联的数据网络。 功能:代理 1 使用图神经网络来映射这些复杂的非线性关系。 优势:标准指标仅考虑单一的历史移动平均线,而我们的 GNN 可以实时处理深层的市场结构关系,在散户交易量发挥作用之前揭示隐藏的相关性。 2. 代理 2:执行器(近端策略优化 - PPO) 模式识别只是成功的一半。基于当前市场波动做出正确的决策,才是预测模型与滞后模型之间的区别所在。 功能:代理 2 使用 PPO(一种先进的强化学习算法)来确定最佳入场点。 优势:它持续调整交易策略,而非使用静态的“超买”或“超卖”线。它会分析当前市场状况并计算最可能的成交点。 执行桥接:通过 ONNX 集成到交易终端 如果执行速度慢,模式识别就毫无用处。我们已通过 ONNX(开放神经网络交换平台)
M1 Sniper MT5
Oleg Rodin
5 (7)
M1 SNIPER   是一款易于使用的交易指标系统。它是一个专为 M1 时间框架设计的箭头指标。该指标可以作为独立的系统在 M1 时间框架下进行剥头皮交易,也可以作为您现有交易系统的一部分使用。虽然该交易系统专为 M1 时间框架交易而设计,但它也可以用于其他时间框架。我最初设计此方法是为了交易 XAUUSD 和 BTCUSD。但我发现这种方法在其他市场交易中也同样有用。 指标信号既可以顺势交易,也可以逆势交易。我教授一种特殊的交易技巧,帮助您利用指标信号进行双向交易。该方法基于使用特殊的动态支撑位和阻力位区域。 购买后,您可以立即下载 M1 SNIPER 箭头指标。此外,我还为所有 M1 SNIPER 工具用户免费提供下方屏幕截图所示的 Apollo Dynamic SR 指标!这两个指标的组合可以帮助您更轻松、更准确地利用 M1 时间框架进行交易。 购买后请联系我,免费获取交易提示和奖励指标! 祝您交易成功!
Divergence Bomber
Ihor Otkydach
4.89 (94)
购买该指标的每位用户将额外免费获得以下内容: 原创工具“Bomber Utility”,该工具会自动跟踪每一笔交易,设置止损和止盈点,并根据策略规则自动平仓; 适用于不同交易品种的指标设置文件(Set 文件); 三种不同风险模式下的 Bomber Utility 设置文件:“最低风险”、“平衡风险” 和 “观望策略”; 一套详细的 视频操作手册,帮助您快速完成安装、配置并开始使用本交易系统。 注意: 要获取以上所有赠品,请通过 MQL5 的私人消息系统联系卖家。 我为您介绍原创的自定义指标 “Divergence Bomber”(背离轰炸机),它是一套基于 MACD 背离交易策略 的“全功能”交易系统。 该技术指标的主要任务是识别 价格与 MACD 指标之间的背离,并发出交易信号(包括推送通知),指示未来价格可能的运动方向。平均而言,这些信号的准确率超过 98%。有关该指标如何工作的详细说明,请观看本页面上的视频演示。 该系统使用 止损订单 和 动态回撤平仓机制 来管理交易。 Divergence Bomber 指标的主要特点: 支持交易的品种: AUDCAD、AUDCHF、AUDS
Scalper Vault   是一个专业的剥头皮系统,为您提供成功剥头皮所需的一切。该指标是一个完整的交易系统,可供外汇和二元期权交易者使用。推荐的时间范围是 M5。 该系统为您提供趋势方向的准确箭头信号。它还为您提供顶部和底部信号以及江恩市场水平。无论您拥有何种交易经验,该系统都易于使用。您只需要遵循简单的规则并每天重复该过程。 建议将此系统用于主要货币对。感谢您的关注! 请注意,该指标在策略测试器中可能无法正常工作。因此,我建议仅在模拟或真实账户的真实交易条件下使用该系统。 指示器提供所有类型的警报,包括推送通知。 购买指标后请与我联系。我将免费与您分享我的个人交易建议和出色的奖励指标! 祝您交易愉快,盈利!
Welcome to ENTRY IN THE ZONE AND SMC MULTI TIMEFRAME  SPECIAL BENEFIT / FOR OUR MQL5 CUSTOMERS FREE ACCESS TO THE NEW TOOL  — COMING SOON — Learn more on our official website  : https://www.fableedge.net Entry In The Zone and SMC Multi Timeframe is a real-time market analysis tool based on Smart Money Concepts (SMC) , designed to analyze market structure, price direction, and key trading zones. It supports both Single-Timeframe and Multi-Timeframe Analysis , providing a clearer view of overall m
Unix Scalper
Issam Kassas
4 (4)
Unix Scalper — MetaTrader 5 购买后,请在 MQL5 上给我发消息,即可免费获得 Smart Universal Expert Advisor,以及在线课程、PDF 手册和私人群组访问权限。 发现交易形态,看清交易计划,选择执行方式。 UNIX Scalper 将市场分析、BUY/SELL/WAIT 决策以及 Entry、Stop Loss、TP1 和 TP2 水平集中在一个清晰的面板中。 看清信号与交易计划 • 明确的决策:BUY、SELL 或 WAIT。 • 明确的价格水平:Entry、Stop Loss、TP1 和 TP2。 • 多时间周期概览:比较面板中各时间周期的信号。 • 辅助分析:趋势、动量、成交量、波动率、支撑与阻力,以及市场质量。 • 灵活的布局:Minimized、Compact、Standard 或 Full。 查看信号,检查价格水平,再判断该交易形态是否符合您的交易规则。 从黄金和比特币开始 建议首先使用的交易品种:XAUUSD 和 BTCUSD。 探索短期剥头皮交易和较高时间周期分析。选择历史K线范围,通过表现曲线查看所选设置
Tokyo mt5 Indicator
Vasiliy Strukov
5 (10)
Tokyo Indicator(东京指标)直观地展示了趋势方向、潜在交易信号及市场状况。 其采用颜色编码的阶梯式趋势线,以蓝色标识看涨阶段,以洋红色标识看跌阶段。配套的方向箭头会在趋势发生变化时,标示出潜在的买入与卖出机会。 内置的综合仪表盘将当前信号、市场倾向、动能、波动率及信号质量整合于同一视图中,方便交易者在观察价格走势的同时评估指标数据,无需在不同面板间切换。 凭借清晰的图表显示和简洁的市场概览,Tokyo Indicator 支持以系统化的方式进行趋势分析与交易确认。 适用于任何时间周期及各类交易品种,尤其适合黄金交易。 购买后请立即联系我,以获取专属赠品!您可以免费获得我们的“强力支撑与趋势扫描”(Strong Support and Trend Scanner)指标,请私信我! 设置说明与使用手册请见此处。 请注意:我不会在 Telegram 上出售我的 EA 或特殊参数设置(set files);我的 EA 仅在 Mql5 平台上提供,而参数设置文件仅在我的博客(此处链接)上发布。请务必警惕诈骗,切勿从他人处购买任何参数设置! 设置 ShowHUD —— 在图表上显示
RelicusRoad Pro MT5
Relicus LLC
4.96 (25)
别再凭猜测做交易。 在同一张图表上看清何时入场、何时离场,以及市场的方向。 RelicusRoad Pro 将近二十种工具整合进一个指标,你可以只开启适合自己交易方式的那几项。 入场清晰。出场清晰。每张图表都有计划。 是不是很熟悉? 你刚买入,价格一分钟后就逆着你运行。 你出场太早,然后眼看着行情在你离场后继续走下去。 图表上有五个指标,给出五种不同的答案。 你的止损全凭猜测。 我们为何开发它 我们做外汇交易已有 18 年。RelicusRoad 背后的核心算法最初是在私下为我们自己的专业交易员圈子开发的。 初衷很个人。我们厌倦了一次次手工画同样的线,违反自己定下的规则,错过图表上真正重要的那一点。 对我们有效的是一致性:每天以同样的方式读图,直到它变成肌肉记忆。RelicusRoad Pro 把这种看盘方式带到你的图表上。 之后我们把它开放给更多交易员,因为一个小圈子能看到的东西有限。 每位交易员都会带来新的问题和想法,好的想法会进入下一次更新。今天其中很多工具之所以存在,是因为我们的交易员提出了需求。 这个社区保持私密且规模不大,同时活跃的交易员保持在 2,000 人以内。有些人使
Trend Catcher ind mt5
Ramil Minniakhmetov
5 (18)
趨勢捕捉指標 趨勢捕捉指標結合了作者獨有的客製化自適應趨勢分析指標,用於分析市場價格趨勢。它透過過濾掉短期噪音,並專注於潛在的動能強度、波動性擴張和價格結構行為,來識別真實的市場方向。此外,它還結合了平滑和趨勢過濾等客製化指標,例如移動平均線、相對強弱指標 (RSI) 和波動率過濾器。 您可以在這裡查看實際運行情況以及我的其他產品: https://www.mql5.com/en/users/mechanic/seller 請注意,我不會在 Telegram 上出售 EA 或任何設置,那是騙局。所有設定都可以在我的部落格上免費取得。 重要提示!購買後請立即聯繫我,以獲取使用說明和額外獎勵! 請注意,我不會在 Telegram 上出售 EA 或任何設置,那是騙局。所有設定都可以在我的部落格上免費取得。
FiboSniper Pro
Van Minh Nguyen
5 (3)
FiboSniper Pro – Multi-Filter Fibonacci System with Auto SL/TP and Control Panel FiboSniper Pro 是一款技术指标,将动态 Fibonacci Envelopes 与多个确认过滤器相结合,以生成经过筛选的 Buy 和 Sell 信号。Fibonacci 水平基于 Moving Average 和 ATR 计算,然后通过 ADX、EMA、RSI、ATR、Volume、Time 和 Candle 结构进行过滤。该指标直接在图表上显示基于 ATR 自动计算的 Stop Loss 和 Take Profit 水平,并提供交互式控制面板,以便快速调整参数。 购买后,请联系我以获取推荐的设置文件和详细使用说明。 使用 Auto Trader X 自动执行 FiboSniper Pro 信号: [Auto Trader X] 用户指南和设置文件: [Click here] 完整文档请参阅产品博客: [Click here] 加入官方频道获取最新更新: [Click here] 专为偏好结构化入场和清晰风险管理
Market Structure Order Block Dashboard MT5 是一款专为希望直接在图表上解读市场结构和主要价格反应区域的交易者设计的MT5指标。它结合了BOS、ChoCH、订单块(Order Blocks)、公允价值缺口(FVG)、流动性、Kill Zones、成交量分布图以及一个紧凑的面板,便于快速分析。 本指标面向使用市场结构、ICT和Smart Money概念作为决策框架的交易者。它可以帮助以更结构化的方式识别趋势延续、可能的反转、价格失衡、流动性目标和关注区域。 面向买家的资源 购买后可通过MQL5私信申请获取完整的PDF使用指南和参数配置建议。通过MQL5私信提供直接技术支持。 1.20版本带来两项重要新增: Pending BOS / Pending ChoCH 检测 和 可拖动面板 (按住面板标题栏即可将其拖动到图表任意位置,不影响图表本身)。当K线收于前一摆动点之外时,Pending Breaks 立即显示待确认的结构突破,无需等待经典的摆动确认。 重要 本产品仅为指标。它不会自动开仓、平仓或管理仓位。它不是EA(智能交易系统)。 主要功能 市场
介绍     Quantum Breakout PRO   ,突破性的 MQL5 指标,正在改变您交易突破区域的方式!由拥有超过13年交易经验的资深交易员团队开发,     量子突破 PRO     旨在通过其创新和动态的突破区域策略将您的交易之旅推向新的高度。 量子突破指标将为您提供带有 5 个利润目标区域的突破区域的信号箭头,以及基于突破框的止损建议。 它既适合新手交易者,也适合专业交易者。 量子 EA 通道:       点击这里 重要的!购买后请私信我领取安装手册。 建议: 时间范围:M15 货币对:GBPJPY、EURJPY、USDJPY、NZDUSD、XAUUSD 账户类型:ECN、Raw 或 Razor,点差极低 经纪商时间:GMT +3 经纪商:IC Markets、Pepperstone with Raw 和 Razor 的点差最低 规格: 不重漆! 最多 5 个建议利润目标区域 建议止损水平 可定制的盒子。您可以设置自己的 Box Time Start 和 Box Time End。 接触 如果您有任何疑问或需要帮助,请通过私人消息与我联系。
Volatility Master for MetaTrader is a real-time dashboard tool that scans up to  50 symbols  to identify high-volatility , trending markets instantly. With bullish/bearish signals, customizable alerts, and a user-friendly interface, it helps you avoid range-bound conditions and focus on high-probability trades. Clarity leads to confidence. Trade confidently and protect your capital effectively with this powerful dashboard. We don't offer free or bonus indicators in exchange of reviews from you.
Quantum TrendPulse
Bogdan Ion Puscasu
5 (26)
介绍 Quantum TrendPulse   ,这是一款终极交易工具,它将 SuperTrend   、   RSI 和 Stochastic 的强大功能整合到一个综合指标中,以最大限度地发挥您的交易潜力。该指标专为追求精准和效率的交易者而设计,可帮助您自信地识别市场趋势、动量变化以及最佳进入和退出点。 主要特点: 超级趋势整合: 轻松跟随当前的市场趋势并乘上盈利浪潮。 RSI 精度: 检测超买和超卖水平,非常适合把握市场逆转时机,可用作 SuperTrend 的过滤器 随机精度: 利用随机振荡在波动的市场中寻找隐藏的机会, 用作超级趋势的过滤器 多时间范围分析: 从 M5 到 H1 或 H4,在不同时间范围内关注市场动态。 可定制的警报: 当您的自定义交易条件得到满足时收到通知,这样您就不会错过任何交易。 无论您是新手还是经验丰富的交易员,   Quantum TrendPulse 都能为您提供所需的优势,帮助您增强策略并自信地进行交易。借助这一强大的指标,将洞察力转化为利润 — 掌控您的交易! ***购买 Quantum TrendPulse,即可免费获得 Quantum Tr
Reversal Master for MT5
Alexey Minkov
5 (1)
Reversal Master for MT5 Reversal Master for MT5 是一款适用于 MetaTrader 5 的不重绘反转指标。它可以帮助您识别潜在的市场反转点,并在每一个历史信号之后显示价格的最大有利运动幅度,从而让您更好地理解价格在类似历史情形中的运行方式。 MT5 版本保留了原始 MT4 版 Reversal Master 熟悉的反转信号逻辑,同时增加了更好的可视化效果、历史统计以及基于点值的汇总面板。该指标可在 MetaTrader 5 支持的任意品种和任意时间周期上运行,可用作独立的反转分析工具、作为您交易系统中的附加确认过滤器,或作为智能交易系统(Expert Advisors)的信号来源。 Key Features 自动检测潜在的趋势反转点。 不重绘箭头:信号在 K 线收盘后固定,不会移动或消失。 两个工作模式:Mode 1 Classic(经典 MT4 风格逻辑)和 Mode 2 Advanced(带统计模块)。 Max Potential 数值,用于显示历史信号之后价格的最大有利运动幅度(Mode 2)。 内置点值汇总面板,显示正/负/总计等
作者的更多信息
SR Breakout Trend Detector is a technical indicator for MetaTrader 5 that combines confirmed support and resistance levels with filtered breakout signals. It helps traders assess market structure, identify breaks beyond established levels, and evaluate those breaks against candle strength, volatility and trend direction. The indicator is designed for chart analysis and decision support. It does not open, manage or close trades. SUPPORT AND RESISTANCE STRUCTURE The indicator identifies local high
FREE
ORP Oscillator ORP Oscillator is a free custom indicator for MetaTrader 5, developed around XAUUSD analysis. It displays directional balance through two smooth curves on a fixed scale from −100 to +100, with all intersections occurring at the central zero line. The indicator combines recent price movement with a measure of how observed pullbacks recover. It is a visual analysis tool and does not open, manage or close trades. How to read the oscillator • Green above zero: the calculated bullish s
FREE
HA Metals Flow Chart is a visual MetaTrader 5 indicator designed to make the flow of gold and silver easier to read. It replaces the standard chart display with synthetic Heikin Ashi candles and combines flow classification, normalized momentum, confirmed market structure events and a compact dashboard in a single interface. The indicator is intended for discretionary chart analysis. It does not open, modify or close trades. MAIN FEATURES - Synthetic Heikin Ashi chart for a cleaner view of direc
FREE
WAIT Entry Timing WAIT stands for Weighted Analysis of Ideal Timing. WAIT Entry Timing is a decision-support indicator designed to help traders evaluate whether a detected setup may be ready for entry or whether waiting for a pullback, confirmation, or a potentially better price could be more appropriate. The indicator does not execute trades. It analyzes market conditions and presents the result through three normalized values from 0 to 100: Patience Score measures the potential benefit of wait
FREE
Gold MTF
Paolo Ruffini
Gold MTF Market Dashboard Gold MTF Market Dashboard is a multi-timeframe analytical indicator designed primarily for Gold trading on the M5 chart. The indicator compares M5, M15 and M30 market conditions in a single compact dashboard: M30 provides the broader market context. M15 evaluates structure and direction. M5 provides short-term timing information. Main features Multi-timeframe trend analysis M5, M15 and M30 directional scores Bullish HH/HL and bearish LH/LL market structure EMA trend and
FREE
HA Flow Mean
Paolo Ruffini
HA Flow Mean HA Flow Mean is a free adaptive equilibrium indicator for MetaTrader 5. It brings candle structure, directional persistence and smoothing together in one color-coded line on the main price chart. An optional information panel provides a clear summary of the most recently closed candle. What the indicator measures The calculation combines three elements of each candle: the direction and relative size of its real body, the imbalance between its upper and lower wicks, and the position
FREE
Close All and Orders Close All and Orders by SRBT is a manual trading utility for MetaTrader 5. Its compact chart panel provides three buttons for closing positions and deleting pending orders across the current trading account. Use it to manage exits from one chart, close positions with positive floating profit, or remove pending orders without closing existing positions. Three buttons, three actions CLOSE ALL (pos + orders) — Requests closure of all open positions, then requests deletion of al
FREE
Liquidity Momentum Pulse (LMPX) 产品介绍 Liquidity Momentum Pulse(LMPX)是一款技术指标,用于通过结合市场参与度和价格加速度来衡量真实的市场压力。 该指标计算: 归一化成交量 :成交量 / 成交量移动平均 价格动量 :价格变化率(ROC) 最终数值为归一化成交量与动量(ROC)的乘积,从而生成一个复合信号,可用于: 识别由高于平均水平的成交量支持的价格波动 判断市场处于零轴以上或以下的趋势状态 发现可能的吸筹或派发阶段 主要特点 支持外汇、指数、贵金属及加密货币市场 适用于所有时间周期 可自定义报警阈值 零轴趋势判断 参数完全可调 参数说明 Use Real Volume – 选择使用真实成交量或Tick成交量。 Volume SMA Period – 用于归一化成交量的移动平均周期。 ROC Lookback – 计算价格变化率(ROC)所使用的K线数量。 Price Type – 计算所采用的价格类型(收盘价、典型价、中间价)。 ROC Percent – 启用百分比方式计算ROC。 Output Scale – 输出信
FREE
Gold Spread Traffic Light Gold Spread Traffic Light is a real-time spread monitoring indicator developed for MetaTrader 5. It provides an immediate visual assessment of the current difference between Bid and Ask prices through a clear four-color panel. The indicator is primarily configured for XAUUSD, where spread conditions can change considerably during news releases, market openings, rollover periods and phases of reduced liquidity. It can also be used with Forex pairs, silver, indices, oil
FREE
Titan Adaptive Gold Grid Titan1000 is a configurable Expert Advisor designed for XAUUSD trading. It combines SuperTrend entries, optional trend filters, dynamic ATR-based grid management, fractal support and resistance levels, basket profit management and execution protections. The default configuration uses a permissive entry profile. Titan1000 can open a new basket according to the current SuperTrend direction without requiring a new trend reversal. Traders can activate additional filters t
EMA256 Fourier Cycle Trader EMA256 Fourier Cycle Trader is an advanced MetaTrader 5 Expert Advisor combining a long-term EMA or TEMA trend model, causal Fourier cycle analysis, configurable averaging and a unified basket take-profit system. The Expert Advisor is designed primarily for CENT accounts and for traders who understand basket recovery strategies, geometric lot progression and the risks associated with trading without a mandatory Stop Loss. RECOMMENDED STARTING CONFIGURATION Recommended
筛选:
无评论
回复评论