PriceLevels LTF

Short Description

PriceLevel LTF is an all-in-one price-structure suite for the major Forex pairs: a round-number ("big figure") reaction grid — Wall, Hot Zone, Exit, Trap — layered with volume-profile confluence, HTF Monthly/Weekly key levels, a session liquidity-sweep/stop-hunt detector, dual liquidity heatmaps, and automatic Wyckoff Method and Elliott Wave phase detection. Built and tuned for the M15 timeframe. Updates in place with no flicker and refreshes instantly on new bars and fast price moves.

Full Description

Overview

This indicator started as a simple round-number grid and has grown into a full institutional price-structure toolkit, built specifically around standard Forex broker pip conventions (auto-adjusting for 3/5-digit pricing). Because the grid, key levels, and sweep detector are all built from that shared pip logic rather than any single pair's quirks, they work identically across the major Forex pairs — EUR/USD, GBP/USD, USD/JPY, USD/CHF, AUD/USD, USD/CAD, NZD/USD — with no manual recalibration per pair. This indicator is designed for the major Forex pairs; it is not intended for metals, indices, crypto, or exotic-pair use.

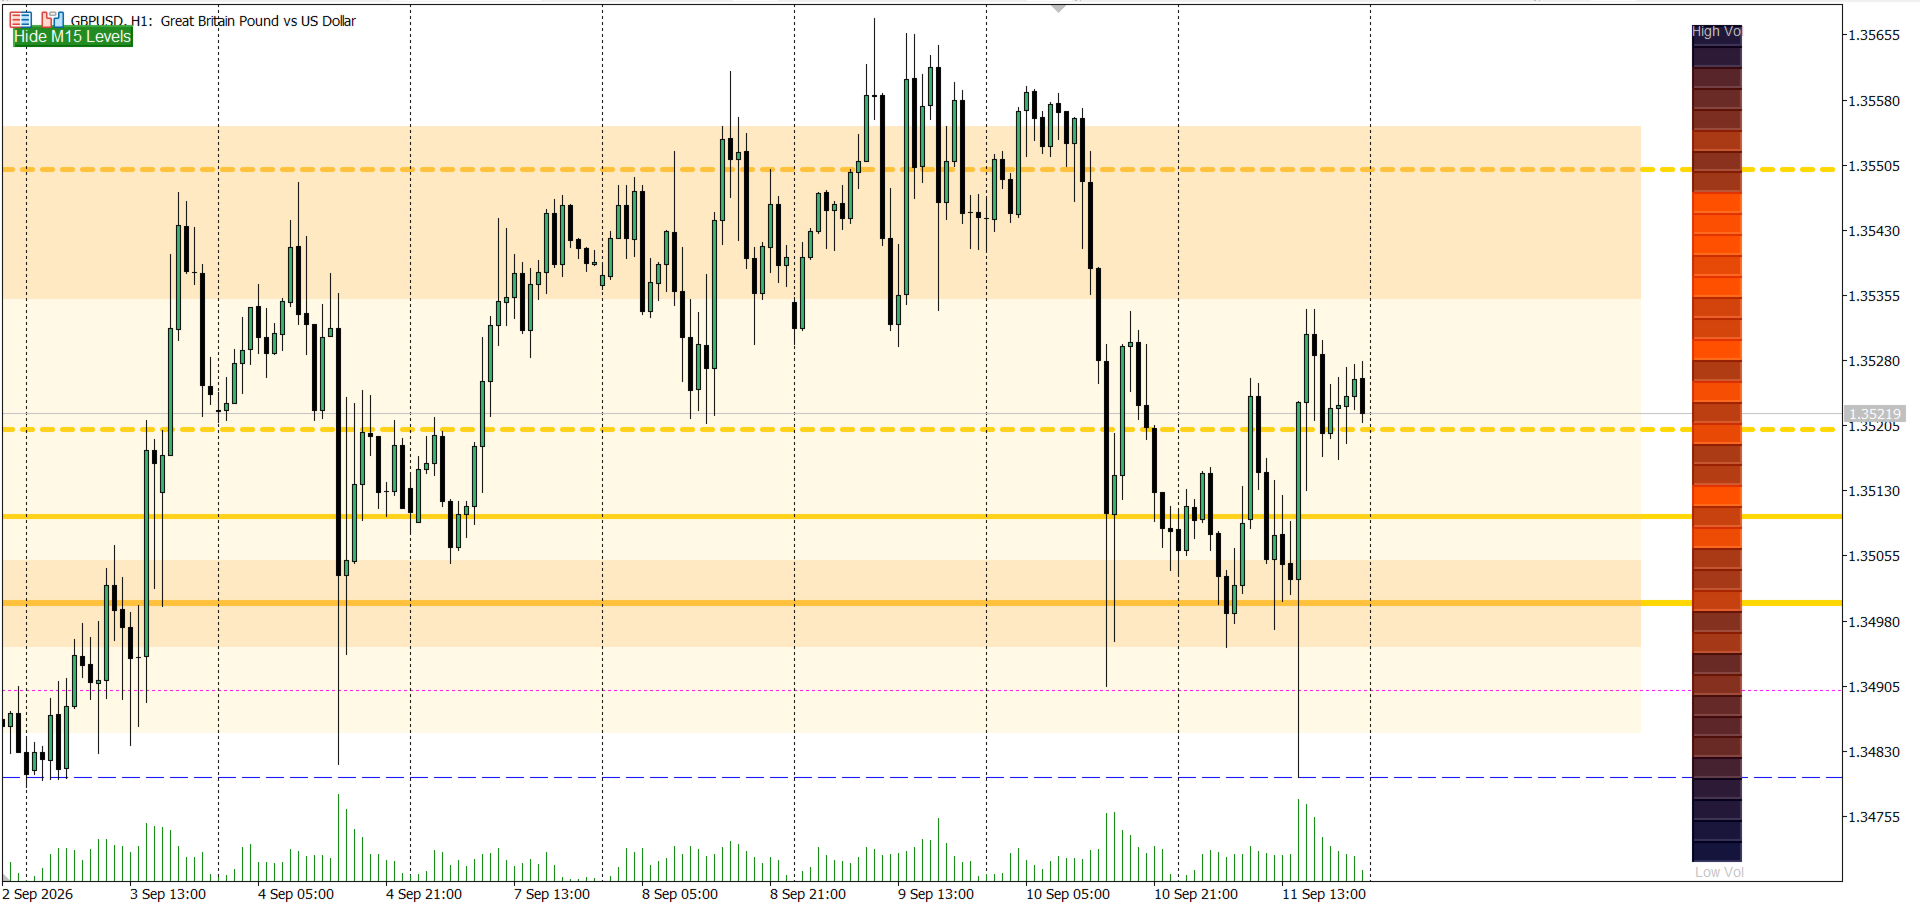
The core grid plots horizontal reference lines at 100-pip intervals, based on the idea that round numbers and near-round numbers tend to act as psychological reaction zones where stop hunts, liquidity grabs, and reversals commonly cluster:

  • .000 — The Wall: major round number, often a zone of rejection.
  • .200 / .800 — The Hot Zone: a common area to watch for entry confirmation.
  • .500 — The Exit: mid-level, often used as a partial take-profit reference.
  • .100 / .900 — The Trap: prone to fakeouts and stop hunts — a caution zone, not an entry signal.
  • Optional minor grid lines at every remaining .X00 level.

Everything else builds context around that grid: which levels line up with real volume, which sit at a higher timeframe's own key level, which just got swept and reclaimed, and where the broader wave/phase structure of the market currently stands.

Best timeframe

This indicator is built and tuned for the M15 chart — its session windows, sweep-reclaim logic, and default lookback settings are calibrated around 15-minute bars, and that's the timeframe it's most accurate and most tested on. It remains usable down to M5 and up to H4 for the grid, key-level, and sweep features. The Wyckoff and Elliott Wave detectors (below) are structure-based and will run on any timeframe, but read most reliably from M15 up to H4, where a full phase or wave cycle has enough bars to form cleanly — very low timeframes (M1) tend to produce noisier, faster-invalidating counts.

Feature set

Grid & core display

  • Feature 1 — Right-margin text labels combining level name, live metrics, and suggested action.
  • Feature 2 — Automatic pip/step scaling for correct spacing across all 3/4/5-digit major FX pairs.
  • Feature 3 — Configurable proximity alerts (popup/push/email) when price approaches a chosen level type.
  • Feature 4 — An on-chart Hide/Show toggle button for the whole grid.

Confluence & context

  • Feature 5 — Bounce/Break tracker: counts how many times each level has been respected vs. broken, shown right on the label.
  • Feature 6 — Volume-profile confluence: builds a lightweight session volume profile and highlights grid levels that sit on a genuine high-volume node (POC-relative), not just a round number.
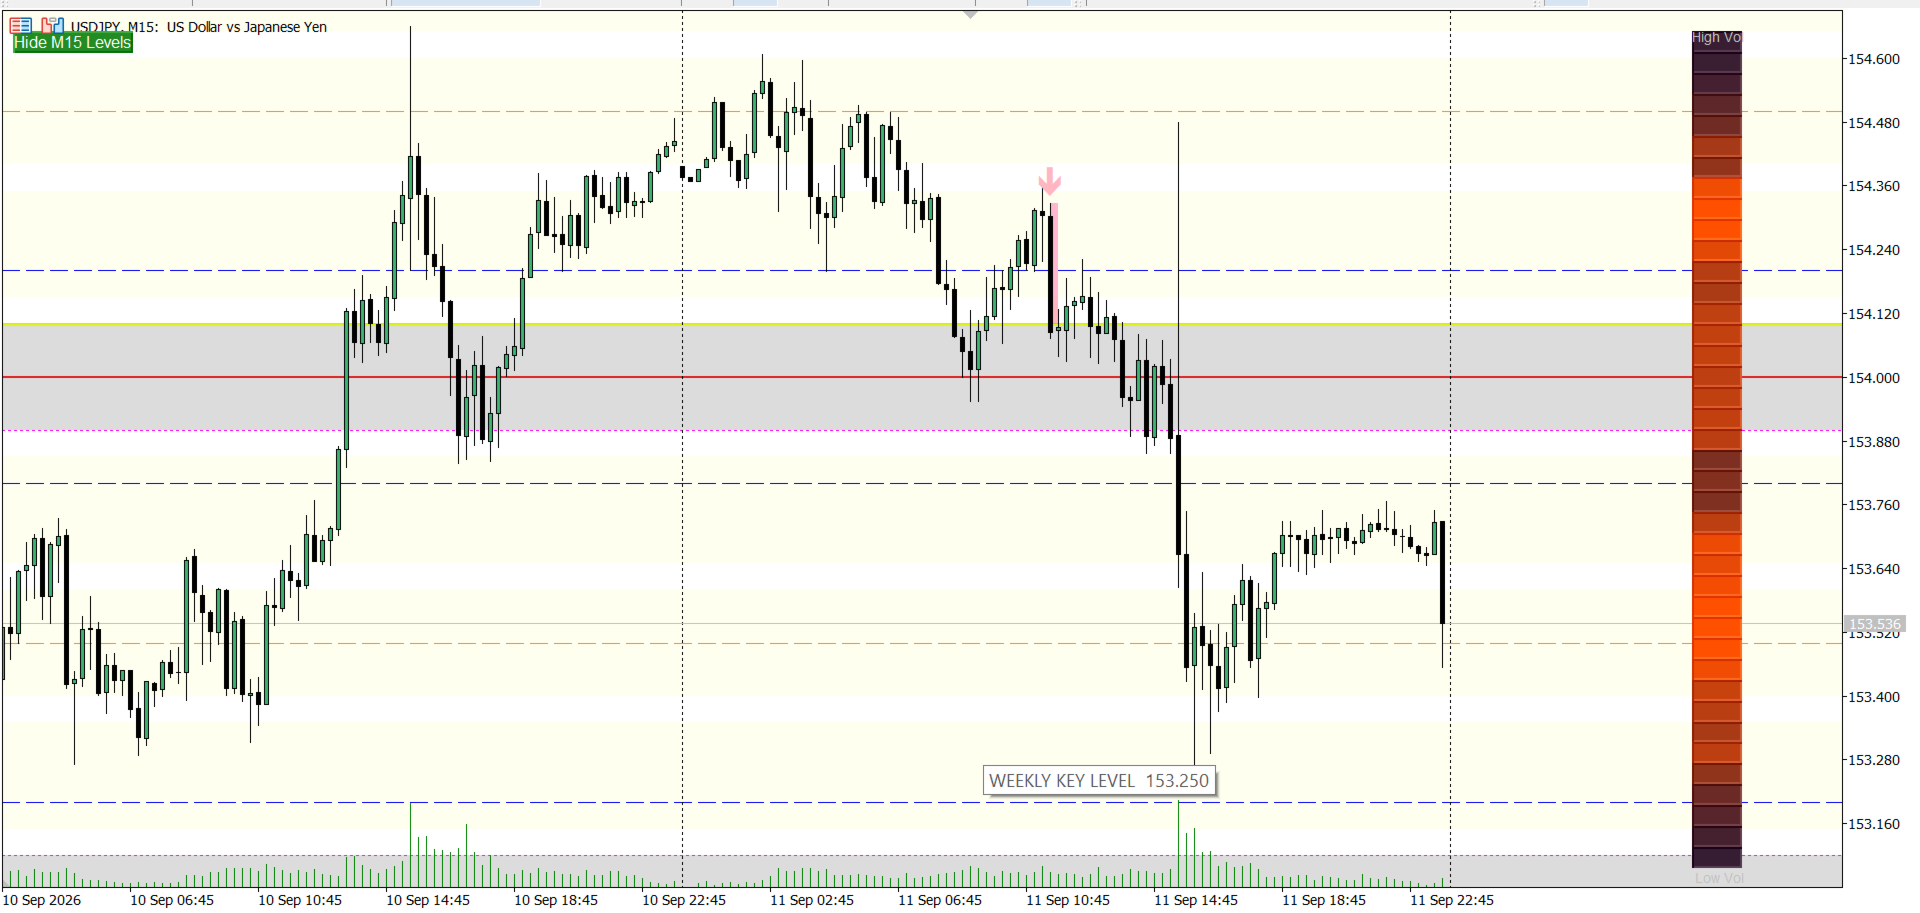
  • Feature 7 — Multi-timeframe institutional key levels: auto-detected (or manual) Monthly big-figure and Weekly quarter-figure zones drawn independently of the intraday grid.

Signal detection

  • Feature 8 — Session liquidity sweep / stop-hunt detector: watches configurable session windows (London/New York open, etc.) for a wick through a Trap level followed by a same-bar-or-N-bar reclaim, and marks it with a box and arrow. Ambiguous, two-sided (bilateral) sweeps are deliberately left undecorated rather than forced into a directional read.

Heatmaps

  • Feature 9 / 9b — Liquidity heatmap panel: a screen-anchored density strip built from tick volume, with an optional Daily/Weekly/Monthly range mode.
  • Feature 10 — Hybrid liquidity heatmap: blends tick-volume density with open-interest data from an imported options CSV (Barchart-style export, columns matched by name so a reordered file still parses correctly), and plots Call/Put "wall" lines at the strikes with the heaviest interest.

Structure detection — Wyckoff Method

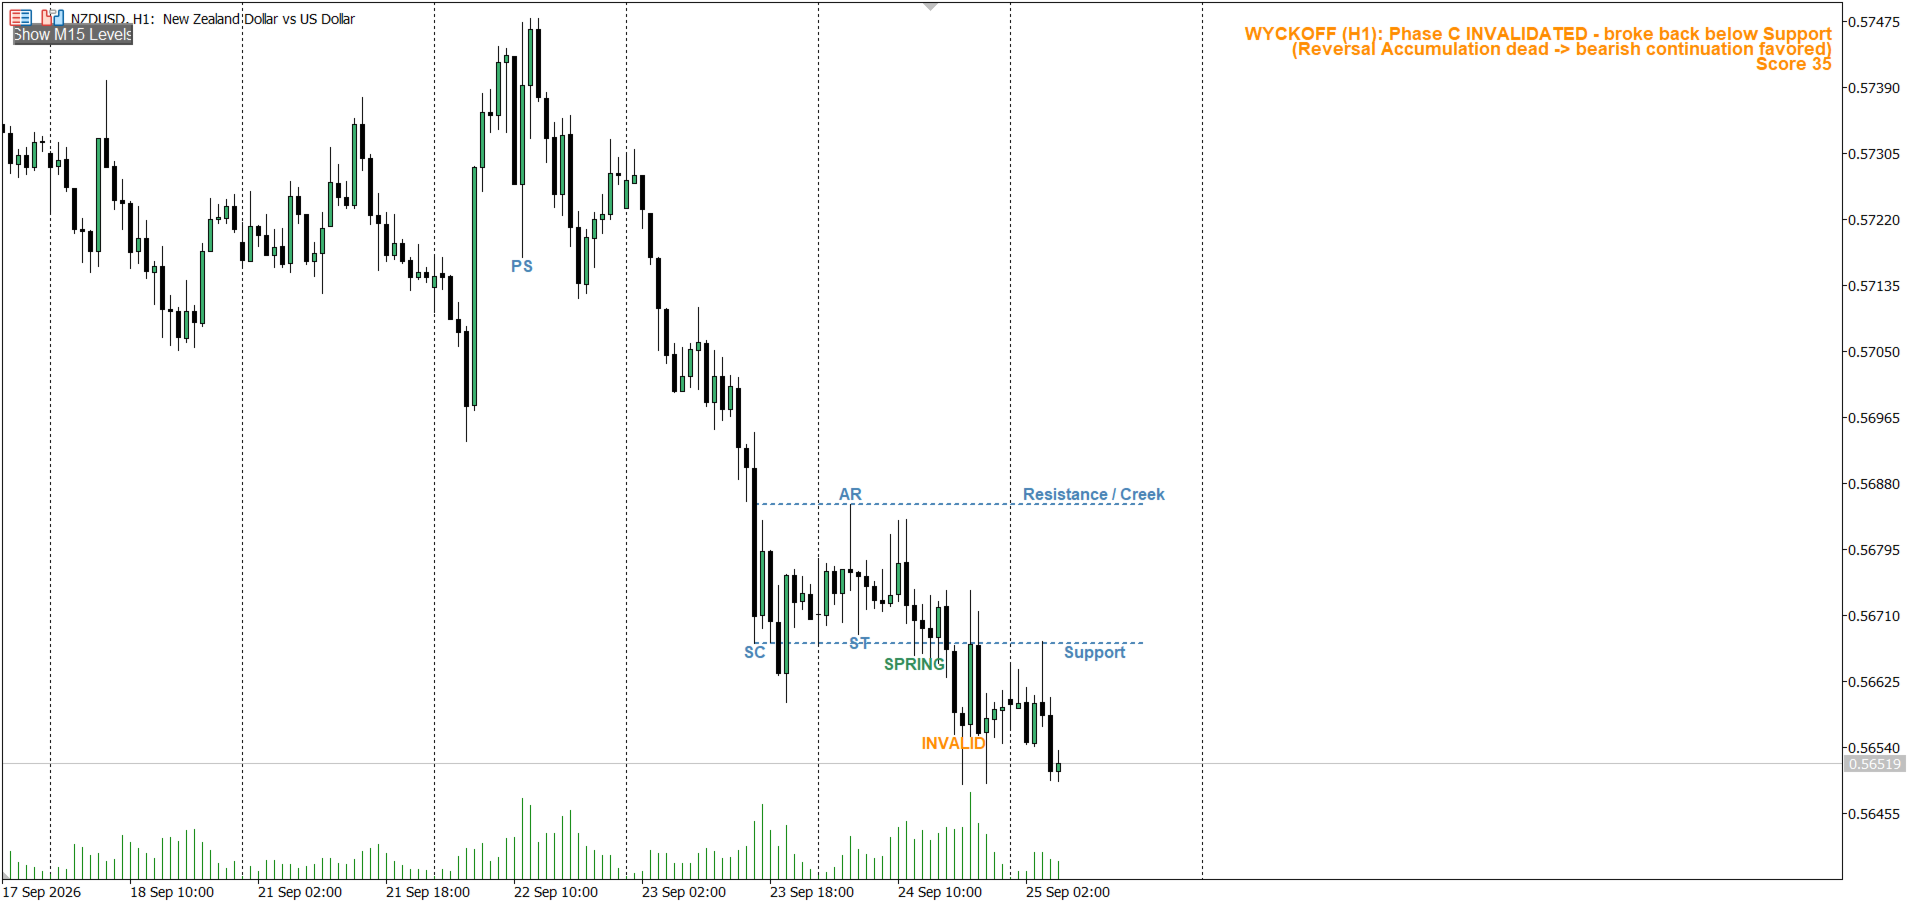
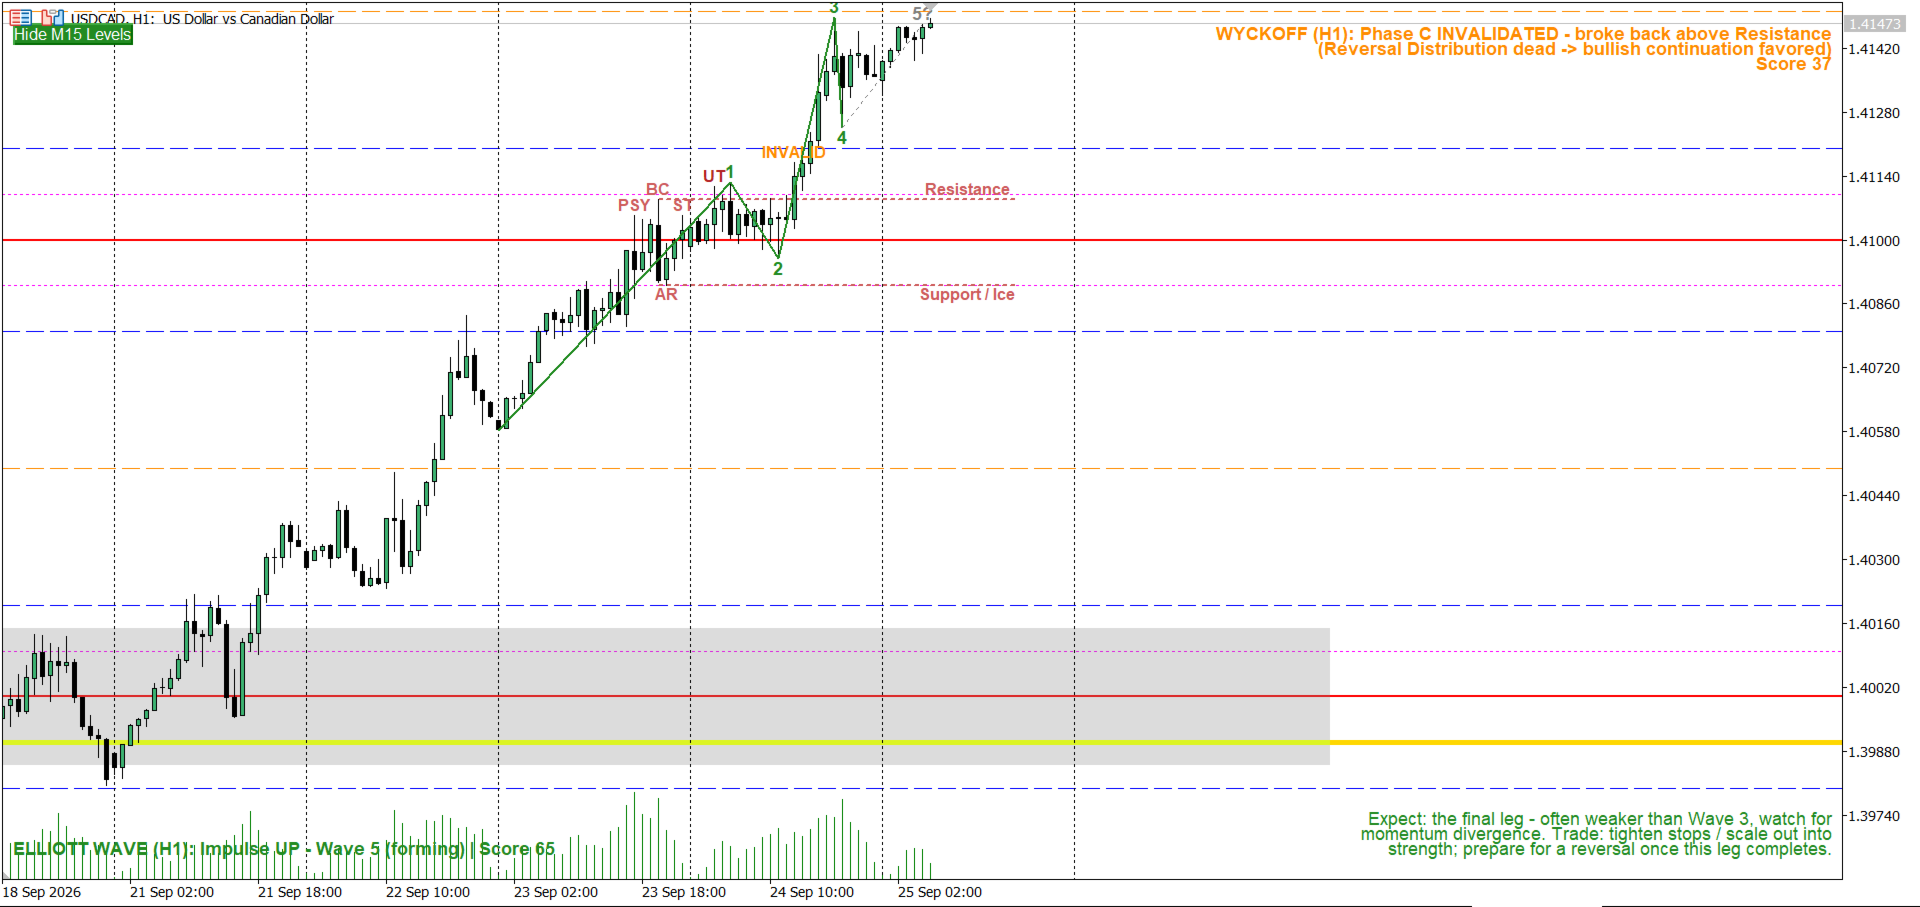
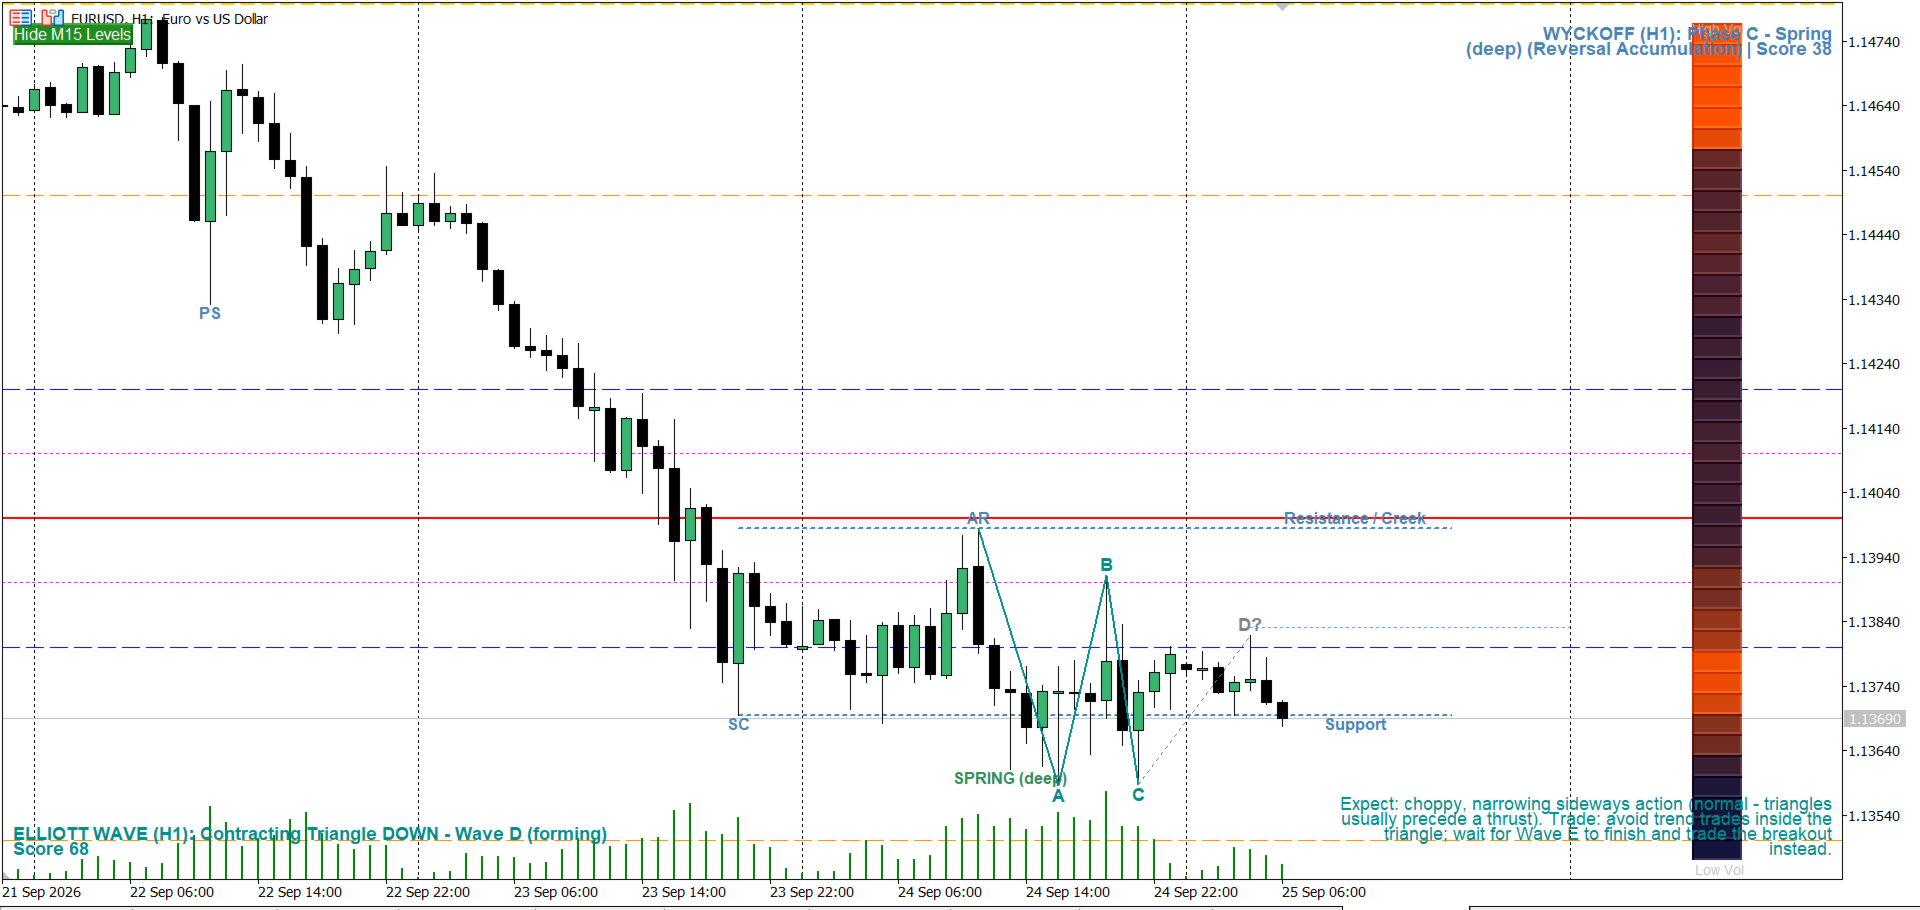
Feature 11 identifies an active Accumulation or Distribution cycle in real time, on any timeframe, and scores it with a probability-weighted status panel. It tracks the full classic sequence:

  • Preliminary Support/Supply and the Selling/Buying Climax
  • Automatic Rally / Automatic Reaction (AR)
  • Secondary Test (ST)
  • Spring (or Upthrust) — the shakeout below/above the range
  • Sign of Strength / Sign of Weakness (SOS/SOW)
  • Last Point of Support / Last Point of Supply (LPS/LPSY), with a real, bounded zone rather than a single price
  • Invalidation of a failed SOS/SOW back into the range

The panel shows which phase (A–E) the current range is in, whether the cycle is accumulation or distribution, and a confidence score based on volume behavior at each stage — using a median/trimmed-mean volume baseline so a single spike doesn't distort the read.

Structure detection — Elliott Wave

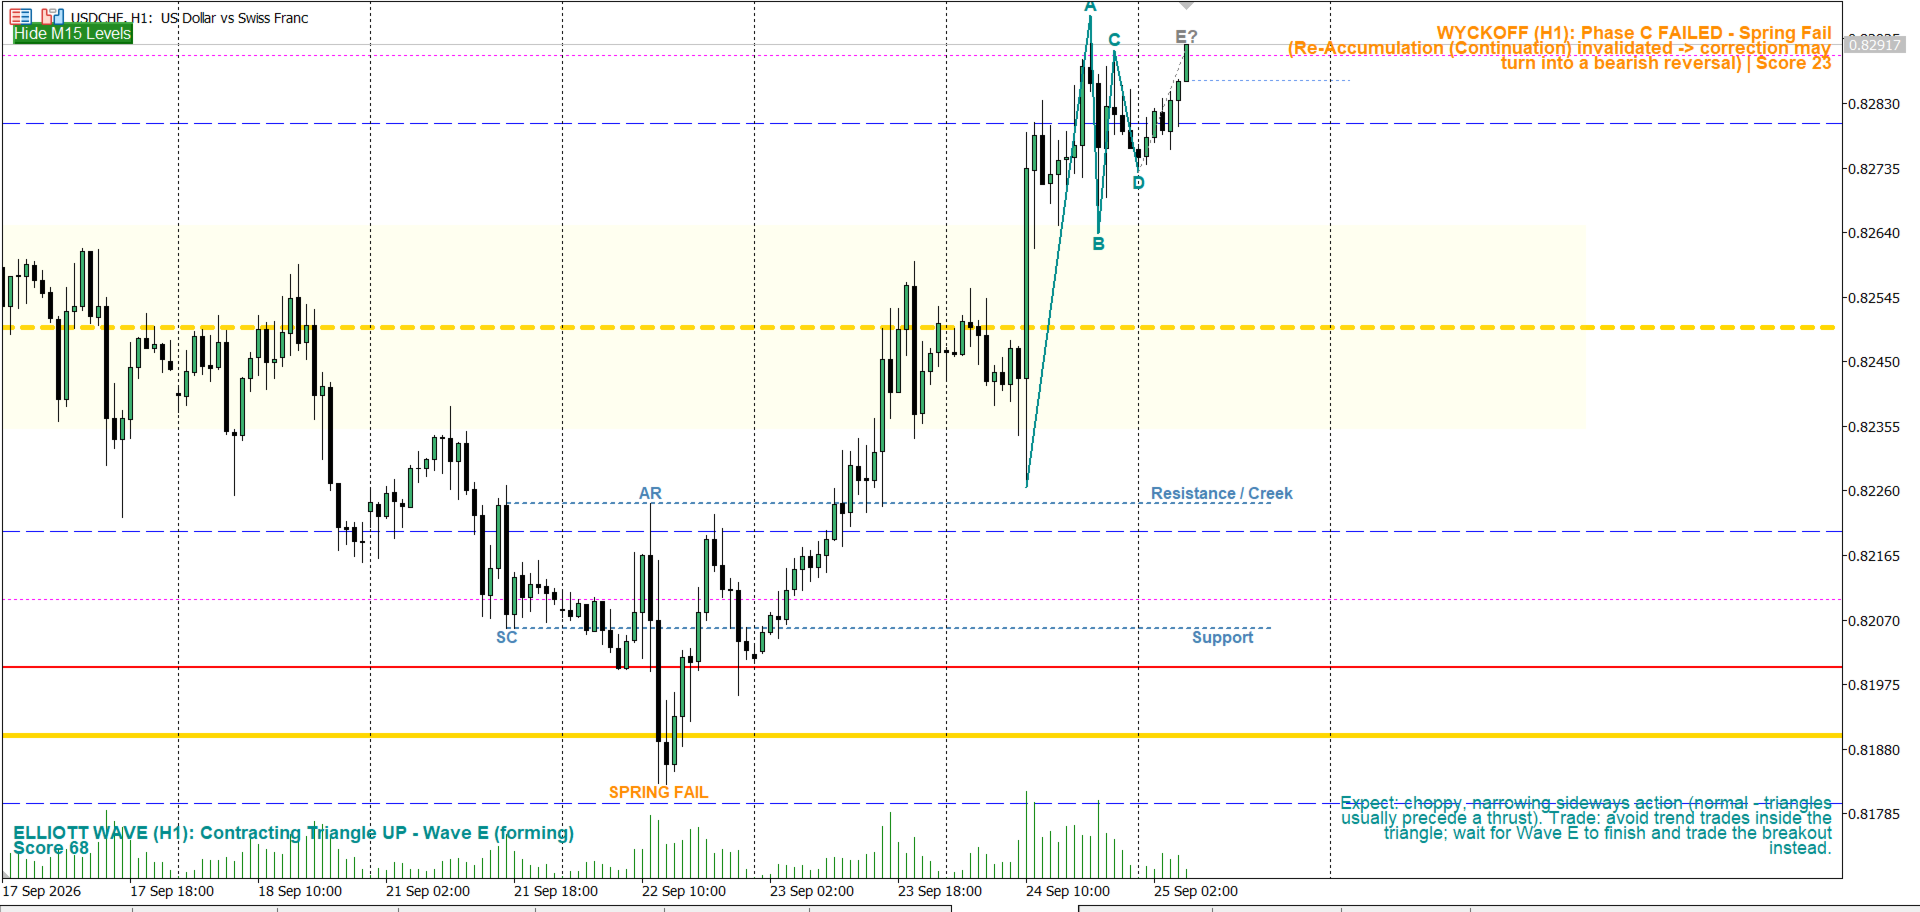
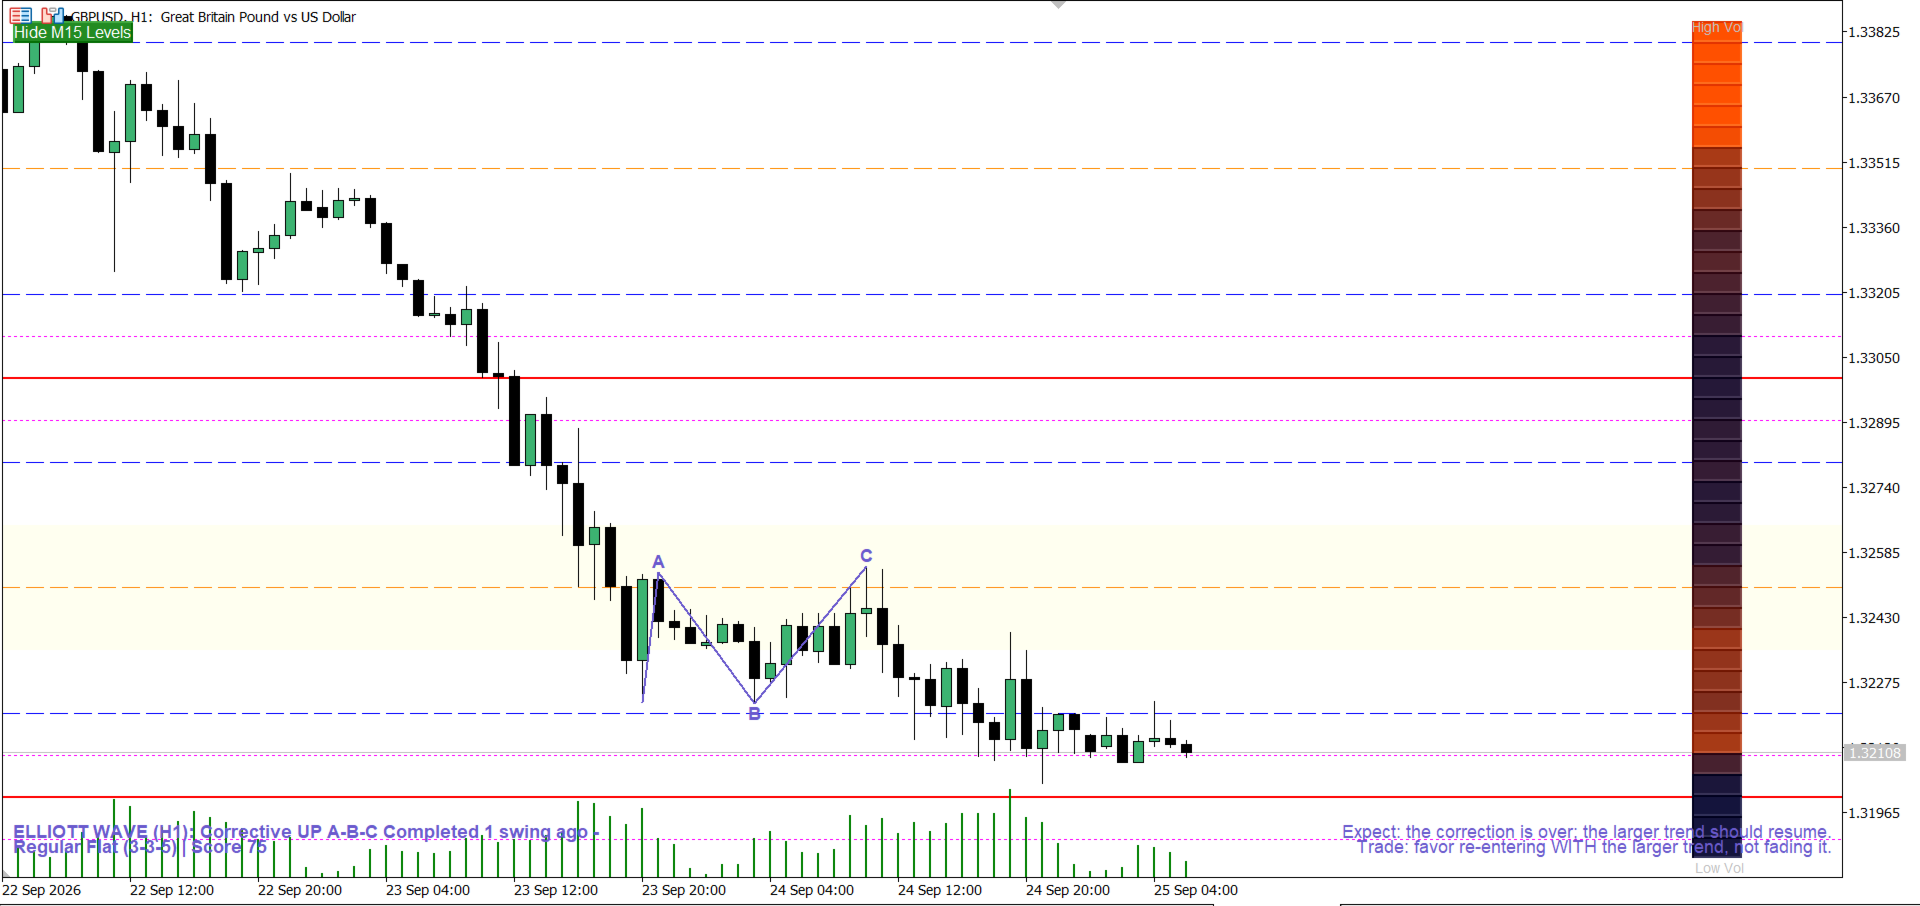
Feature 12 runs a full Elliott Wave scan on any timeframe, scoring candidates against classic Fibonacci guideline ratios and keeping the display stable via continuity/hysteresis (it won't jump between unrelated counts bar-to-bar). It detects:

  • Impulse waves (1-2-3-4-5), including Contracting and Expanding Diagonal variants
  • Corrective structures: Zigzag, Regular/Expanded/Running Flat, and Shallow/Irregular corrections
  • Triangles: both Contracting and Expanding, full A-B-C-D-E
  • Both a fully complete count and a live/forming count at once, so you can see both "what just finished" and "what's building right now"

For whichever count is active, it draws Fibonacci-based projection targets for the next wave and a plain-English guidance panel — e.g. Wave 2 = classic retrace entry zone, Wave 3 = hold/trail rather than take early profit, Wave 4 = avoid the chop, Wave 5 = tighten stops and watch for divergence, a Triangle = wait for the Wave E breakout. This is a textbook read of the detected geometry, not a signal or a recommendation.

Performance

Every visual element updates in place — grid lines, zone boxes, heatmap cells, and status panels are found and modified, not deleted and redrawn, so there's no flicker as price moves. The heavier scans (Wyckoff, Elliott, the sweep detector) only run once per new closed bar. The grid and HTF-zone window refreshes instantly on every new bar and also recenters automatically, on a short throttle, the moment price moves far enough intrabar — so a sudden news spike doesn't leave the chart stale while waiting on a timer.

How to use

  1. Watch for price approaching a Wall or Hot Zone level on your chosen major pair — these are the two level types that qualify as entry candidates; Trap levels are caution zones.
  2. Check whether the level also carries volume confluence (Feature 6) or sits on a Weekly/Monthly key level (Feature 7) — either raises its significance.
  3. If a Trap level was just swept and reclaimed (Feature 8), treat that as a stop-hunt warning rather than a reason to chase the wick.
  4. Use the Wyckoff and Elliott panels (Features 11/12) for broader phase/structure context — are you inside accumulation, or partway through an impulse — rather than as standalone entry triggers.
  5. Layer in your own confirmation (price action, order flow, or a separate volume/VSA tool) before acting on any level.

Inputs

Organized into input groups per feature (Visual Settings, then one group each for Features 1 through 12, plus the Feature 10 CSV/quote settings), so every feature can be tuned or disabled independently. All zone colors, styles, and widths are configurable, as are alert conditions, session windows, lookback depth, and detection thresholds for each detector.

Risk note

Tick volume is used as a proxy for real volume (no centralized tape exists for spot Forex), so treat volume-based reads as directional-pressure estimates rather than certainty. Wyckoff and Elliott Wave readings are the detector's structural interpretation of price, not a guarantee of what happens next. Always combine with your own risk management and trade plan.

Disclaimer

This indicator is provided for informational and educational purposes only. It does not constitute financial advice, and past price behavior at these levels or structures is not indicative of future results. Trading involves risk of loss.
Produtos recomendados
The Magic SMMA indicator is of great help in determining trend direction. It can be an excellent addition to your existing strategy or the basis of a new one. We humans can make better decisions when we see better visually. So we designed it to show a different color for rising and falling trends. Everyone can customize this in the way that suits them best. By setting the Trend Period, we can optimize it for longer or shorter trends for our strategy. It is great for all time frames. IF YOU NEE
FREE
SymbolMonitor
Oleksandr Kashyrnyi
SymbolMonitor 1.3 – Controle total sobre o seu trading! Você opera com múltiplos ativos e deseja ver seus lucros em tempo real ? SymbolMonitor 1.3 é um poderoso robô que analisa automaticamente a rentabilidade de cada símbolo e oferece configurações flexíveis e notificações! Novidades na versão 1.3 Configurações visuais personalizáveis – ajuste fonte, tamanho e cor do texto Notificações automáticas – receba alertas quando seu lucro atingir a meta Cálculo preciso de lucros – ex
FREE
Supertrend Line
Flavio Javier Jarabeck
4.88 (24)
The Supertrend indicator was originally created by a french fellow named Olivier Seban , and its goal is to identify the Primary Trend of prices . Its calculation is easy and based on the average of Highs and Lows and then we add the volatility of a custom period, plus a multiplier. This way we get the Supertrend Line. You can find in the web several approaches and trading strategies using this very useful indicator. HOW TO "READ" THIS INDICATOR If the closing prices are above Supertrend Line,
FREE
EMA Clock
Flavio Carneiro De Barros
O EMA Clock lê a inclinação de uma média móvel exponencial como o ponteiro das horas de um relógio. Como funciona A inclinação da EMA ao longo de um número de barras escolhido é normalizada pelo ATR, convertida em ângulo e depois em hora do relógio: - 12h - a média está subindo forte (ponteiro para cima) - 15h - a média está lateral (ponteiro na horizontal) - 18h - a média está caindo forte (ponteiro para baixo) Cada hora equivale a 30 graus. A normalização pelo ATR permite comparar a leitura
FREE
Color Trend
Bruno Goncalves Mascarenhas
Combinando o melhor de  Price Action ,  Movimento Direcional , e análise de  Divergência/Convergência , o indicador  Candle Color Trend  is é uma forma fácil e confiável de identificar a direção da tendência. O indicador automaticamente pinta os candles de acordo com a premissa de que a tendência de alta é definida por preços que formam uma série de topos e fundos ascendentes. Por outro lado, a tendência de baixa é definido por preços que formam uma série de topos e fundos descendentes. Color T
FREE
Smart FVG Stats
- Md Rashidul Hasan
5 (1)
The  Smart FVG Statistics Indicator  is a powerful MetaTrader 5 tool designed to automatically identify, track, and analyze Fair Value Gaps (FVGs) on your charts. Love it? Hate it? Let me know in a review! Feature requests and ideas for new tools are highly appreciated. :) Try "The AUDCAD Trader": https://www.mql5.com/en/market/product/151841 Key Features Advanced  Fair Value Gap  Detection Automatic Identification : Automatically scans for both bullish and bearish FVGs across specified histo
FREE
PAINEL DE TOPOS E FUNDOS HISTORICOS   Esse é um painel que não abre ordens somente gerencia todos os Symbols e calcula os topos e fundos e apresenta o calculo em relação ao topo e fundo em 5 Anos, 2 Meses e 1 Semana. Ele é ideal para filtrar os pares que estão nas regiões boas para operar. Você pode filtrar o range e escolher se considerar o corpo ou a sombra da vela no mensal. Boa Sorte...
FREE
Wallstreet Pro EA
Leonit Ajvazi
3 (2)
Symbol                                       XAUUSD, AUDUSD Period                                        H1 timeframe Retail support                            YES Minimum deposit                       1000 USD (or the equivalent amount in another currency) Compatible with all brokers      YES (supports any account currency) Works without preset                YES Symbol XAUUSD, AUDUSD Period (Timeframe) H1 timeframe Retail support YES Minimum deposit 1000 USD (or the equivalent amount in ano
FREE
Rossi Campos Timing Indicator
Heber Henrique Penow Campos
ROSSI CAMPOS TIMING INDICATOR PORTUGUÊS 70% dos robôs operam no fechamento/abertura de barras   - você precisa saber quando eles vão agir Algoritmos geram volatilidade extrema nas transições   - sem timing você é vítima Conhecimento do tempo restante permite antecipação estratégica Nível o campo contra traders institucionais e seus sistemas automatizados Aumento comprovado de acerto em operações de entrada/saída Elimina o "fator surpresa" do fechamento de candle Essencial para scalpers que oper
Phoenix Magic Number Dashboard
PHOENIX GLOBAL INVESTMENTS LTD
Executar mais de um EA na mesma conta torna difícil identificar, à primeira vista, qual estratégia está realmente contribuindo para o seu patrimônio líquido ou prejudicando-o. O Phoenix Magic Number Dashboard agrupa automaticamente suas operações abertas e fechadas por número mágico, para que você possa ver lado a lado o desempenho atual e histórico de cada EA, juntamente com os totais de toda a conta. Como ele mantém a clareza em contas com vários EAs - Detecta automaticamente os núme
FREE
Gap Straddle EA
Nazat Hossain Adi
Gap Straddle Trailing EA Automated Pending Order Management with Smart Trailing Stop Gap Straddle Trailing EA is an Expert Advisor for MetaTrader 5 designed to manage pending orders and trade protection through configurable settings. It includes automated order management, risk-based lot sizing, trailing stop functionality, session controls, and an on-chart dashboard. Key Features Buy Stop & Sell Stop Management — Automated pending-order placement and management. OCO Functionality — Opposite pen
Apex Point
Marco Engstermann
Apex Point is a trend-following indicator for MetaTrader 5, transforming complex market data into signals for traders. It displays blue dots for uptrends, red dots for downtrends, and yellow crosses at potential reversals, helping users identify momentum shifts quickly. Key features include a confirmation system requiring multiple bars (default: 3) to validate changes, reducing false signals; dynamic ATR-based offsets for adaptive trailing, with instant ratcheting in the trend direction and smo
FREE
Description One Click Chart Changer is a lightweight and user-friendly MetaTrader 5 indicator that allows traders to switch between multiple trading symbols instantly with a single click. Designed for speed and convenience, this tool eliminates the need to manually search through the Market Watch window. With its modern floating panel interface, you can manage symbol switching directly from your chart. Key Features One-click instant chart symbol switching Fully draggable floating panel Sm
FREE
RBM Atr Pro
Renato Brendim Medici
RBM ATR PRO v1.10 Quem opera mercado volátil sabe como é ruim tomar stop por causa de uma violinada de pavio e ver o preço andar forte a favor logo depois. O RBM ATR PRO foi desenvolvido exatamente para resolver isso. Ele evolui o indicador clássico de volatilidade combinando a leitura do ATR com dois níveis independentes de suavização. A linha no gráfico fica limpa e objetiva: verde para estrutura de alta e vermelha quando o mercado vira para a baixa. Funciona perfeitamente para rastrear a ten
FREE
Order Block Breaker Block Zone by RWBTradeLab A strict Order Block, and the Breaker Block that a failed one turns into. Most Order Block indicators mark any candle before a move. This one asks for five things, all mandatory, and shows you the evidence for each — with a full market structure engine built in, so the BOS or CHoCH that confirmed a block is drawn on the chart instead of having to be trusted. All from CLOSED candles only. What Makes an Order Block Here Five things have to happen,
FREE
LATTICE VISION THE MOST ADVANCED ORDER-NETWORK ANALYSIS TOOL ON MQL5. Not a claim. A position backed by published, independently testable fidelity data. Discover with Lattice Vision. Deploy with Lattice Command. One engine. Two instruments. One continuous workflow. Lattice Vision is the original level-trading analysis tool — Grid Trading 2.0, engineered properly. When you find a configuration in Vision, the matching live engine produces the same trades. Eighteen test configurations coveri
FREE
VFI Quantum
Nikita Berdnikov
5 (1)
Introducing VFI (Volume Flow Indicator) – a trading indicator that analyzes the relationship between volume and price movement to identify key trading opportunities. The indicator displays the strength and direction of volume flow, providing clear signals about potential entry and exit points. Signals are formed based on zero line crossovers, crossovers between the VFI line and its exponential moving average (EMA), and when the indicator exits overbought and oversold zones. Attention! This stra
FREE
PairTrade
Dmitriy Golubev
PairTrade EA – Intelligent Pair Trading System About the EA PairTrade EA   is an automated trading system built on the fundamental principle of   Pairs Trading . The strategy is based on statistical arbitrage between two correlated instruments. The core concept is simple yet effective: the bot simultaneously opens two trades on different but historically correlated instruments in opposite directions. The algorithm calculates the current divergence (spread) between currency pairs, sells the l
Heikin Ashi Volume
Flavio Javier Jarabeck
Para aqueles que adoram negociar usando os Candlesticks Heikin Ashi, aqui está mais um aliado poderoso: Heikin Ashi Volume . Este indicador é uma ideia e criação exclusiva nossa aqui na Minions Labs para você. A ideia por trás deste indicador é ter uma pista visual sobre os candlesticks Heiken Ashi apontando para aqueles com grande volume. Para que isso aconteça, você pode escolher entre 2 técnicas diferentes de identificar o volume "alto": Volume maior acima da média dos últimos N bars anterior
Description of work The MA7 Flax indicator is based on the standard Average True Range indicator and candle data. Shows candles that are larger in size relative to the ATR indicator value. Detailed information about the MA7 Flax indicator. Indicator settings General settings: Period ; Multiplier ; Remove subsequent arrows – removes subsequent arrows in one direction. Message settings: Send message to the terminal (Alert) – permission to send messages to the terminal using the Alert function; S
VPEO Volume Statistics VPEO Volume Statistics is a customizable volume-analysis indicator for MetaTrader 5. VPEO stands for Volume Pressure and Efficiency Oscillator. The indicator combines directional volume pressure, a statistical analysis of rising or falling market participation, volume-efficiency conditions, optional BUY and SELL markers, and a compact dashboard in one interface. The indicator is designed to answer three separate questions: Is current volume pressure mainly positive or nega
FREE
Donchian通道(唐奇安通道指标)是用于交易突破的最古老、最简单的技术指标之一。   一般来说,唐奇安通道的宽度越宽,市场波动就越大,而唐奇安通道越窄,市场波动性也就越小 。此外,价格走势可以穿过布林带,但你看不到唐奇安通道的这种特征,因为其波段正在测量特定时期的最高价和最低价。 交易实用必备工具指标 波浪自动计算指标,通道趋势交易 完美的趋势-波浪自动计算通道计算 , MT4版本 完美的趋势-波浪自动计算通道计算 , MT5版本 本地跟单复制交易 Easy And Fast Copy , MT4版本 Easy And Fast Copy , MT5版本 本地跟单复制交易 模拟试用 Easy And Fast Copy , MT4 模拟账号运行 Easy And Fast Copy , MT5 模拟账号运行 唐奇安通道指标计算: 唐奇安上阻力线 - 由过去N天的当日最高价的最大值形成。 唐奇安下支撑线 - 由过去N天的当日最低价的最小值形成。 中心线 - (上线 + 下线)/ 2   唐奇安通道信号   唐奇安通道常用作突破指标。它提供了两种主要类型的突破信号,一个是上阻力线或下支
FREE
Inside Day Narrow Range 4
Luiz Augusto De Medeiros Pellegrini
IDNR4 — Indicator Description (English) The IDNR4 (Inside Day Narrow Range 4) is a volatility-compression pattern that identifies potential breakout conditions. It combines two concepts: NR4 (Narrow Range 4) The current bar has the smallest high–low range compared to the previous three bars. Inside Bar (ID) The current bar’s high and low are fully contained within the range of the previous bar. Signal Logic • When the bar is NR4 only , it is highlighted as a normal contraction pattern. • Wh
FREE
Sniper Liquidity Indicator Sniper Liquidity System Sniper Liquidity System maps where liquidity rests, tracks when price takes it, and confirms the shift in market structure that often follows. Once a setup forms, it draws a complete trade plan on your chart: entry, stop loss, take profit and Risk:Reward. No DLLs. No external software. No repainting after a bar closes. Just attach it to a chart. Features Complete signals with a fixed Risk:Reward tool Entry at the fair value gap's full fill or th
FREE
Tired of information overload when analyzing forex currency strength? Introducing "All Currency Strength Live", the ultimate dashboard indicator for MetaTrader 5 that simplifies your trading life. This innovative tool provides a clear, concise overview of the strength of all major currencies, empowering you to make informed trading decisions with ease. With "All Currency Strength Live,"  you gain access to real-time insights into both price and volume strength across all major currencies. No mor
Daily Drop Analyzer
Rafael Gazzinelli
5 (1)
Automatize sua Estratégia! Use o Expert Advisor Daily Drop Analyzer para executar automaticamente a estratégia, com filtros, parâmetros configuráveis e gerenciamento de ordens. Confira aqui: Daily Drop Analyzer EA Daily Drop Analyzer é um indicador técnico para MetaTrader 5 que realiza testes históricos baseados em quedas percentuais diárias. Ele analisa até 200 ativos do Market Watch para identificar níveis de entrada recorrentes dentro de uma faixa configurável. O cálculo utiliza candles di
FREE
Lts Trend Strength
Gabriel Garcia Bogo
Cestas de grid raramente quebram num mercado calmo. Elas quebram quando uma tendência começa e ninguém percebe a tempo. O LTS Trend Strength é o filtro de regime de mercado da LTS - Legacy Trading System. Num único olhar ele mostra se o mercado está lateral, em transição ou em tendência forte, no seu gráfico e em quatro timeframes maiores ao mesmo tempo. Ele foi construído sobre os mesmos princípios de ADX e ATR que usamos para proteger os nossos Expert Advisors, e é gratuito. É um filtro de me
FREE
Slow RSI
Flavio Javier Jarabeck
4.8 (5)
For those who feel that regular RSI is too fast and too noisy to be used on regular trades or in EAs and want to have an alternative to meter the Momentum of the Price, here is a solution presented on the great article of the Technical Analysis of Stocks & Commodities magazine (April, 2015), by Vitali Apirine, called: Slow Relative Strenght Index . Its reading is almost the same as the regular RSI, but its levels of Overbought and Oversold are 80 and 20 instead. SRSI is very powerful to show div
FREE
100% GRÁTIS — versão completa, sem limitações nem registro. O QUE FAZ - BUY/SELL de um clique no símbolo do gráfico, com SL e TP em pips. - Lote por risco: digite um % de risco e o painel calcula o lote pela distância do stop e o valor do tick; cada operação arrisca a mesma fração do saldo. Pode alternar para lote fixo. - Lote seguro: ajustado automaticamente ao mínimo, máximo, passo e limite da corretora e limitado pelo seu máximo. A margem é verificada antes de cada ordem — sem rejeições por
FREE
Daily Volatility Tracker   is a practical and lightweight indicator designed to help traders monitor and analyze market volatility based on historical daily price movements. Whether you're a day trader, swing trader, or scalper, understanding how much a market moves per day is critical for: Choosing the right pairs to trade Setting accurate stop-loss and take-profit levels Adapting to changing market conditions MT4 Version -  https://www.mql5.com/en/market/product/134958/ Join To Learn Market De
FREE
Os compradores deste produto também adquirem
Trend Sniper X
Sarvarbek Abduvoxobov
4.86 (43)
Trend Sniper X é um indicador de acompanhamento de tendência para múltiplos tempos gráficos no MetaTrader 5 que ajuda os traders a identificar a direção da tendência e potenciais pontos de reversão com clareza e precisão. para MT4: https://www.mql5.com/en/market/product/193245 Informações sobre o preço: O preço atual é promocional e está sujeito a alterações à medida que novas atualizações e funcionalidades forem lançadas. Oferta Bônus: Para obter o Auto-Trade Assistant EA GRATUITO para este in
Smart Trend Trading System — MetaTrader 5 Após a compra, envie-me uma mensagem no MQL5 para receber Smart Universal Expert Advisor GRÁTIS, além do curso online, do manual em PDF e do acesso ao grupo privado. O STTS reúne a direção da tendência, sinais de entrada e saída, zonas de reversão e níveis de preço importantes diretamente no seu gráfico. Siga o sistema manualmente ou conecte um EA compatível separado para executar operações automaticamente com as configurações que você escolher. UM SISTE
Um novo Rei chegou à cidade - Indicador + Gestão de Ordens (TP1 + TP2 + TP3) + Enviador opcional de sinais para Telegram INCLUÍDO (GRÁTIS) (SISTEMA COMPLETO DE TRADING e SINAIS) Nosso melhor EA para Ouro: Gold Slayer Este indicador inclui uma estratégia avançada, um sistema de trading com gestão de ordens personalizável e um sistema de reversão à média que combina extensões de envelopes, apoiado por múltiplos filtros inteligentes de confirmação, como o RSI, para capturar entradas de reversão de
Zoryk Gold
Reda El Koutbane
4.78 (18)
O desconto termina em 24 horas — próximo preço $ 69 ZORYK — Sistema avançado de sinais para XAUUSD no MetaTrader 5 Você conhece essa sensação. Você passa muito tempo analisando o ouro. Espera pela entrada certa. Finalmente abre a operação e o preço começa imediatamente a se mover contra você. Você fecha cedo demais, move o Stop Loss ou hesita por alguns segundos. Depois disso, o mercado alcança exatamente o destino que você esperava originalmente, mas sem você dentro da operação. O problema ne
Ultra Indicator
Ihor Otkydach
5 (1)
O ULTRA é um indicador técnico que funciona numa base «tudo-em-um» — analisa o mercado de forma independente, gera sinais de negociação, apresenta níveis para definir ordens de stop-loss e sugere quando encerrar as negociações para garantir lucros ou minimizar perdas. Por outras palavras, não importa se não sabe analisar o mercado, determinar níveis — onde definir o seu stop-loss — ou se tem dificuldades com a gestão do capital. O ULTRA fará tudo isso por si! BÓNUS PARA O COMPRADOR: Após adquiri
Tenha sua vantagem no trading à vista! M5 Sniper é um novo indicador da MeanFX. Ele combina sinais de trading precisos com níveis adaptativos de TP/SL — criando, como resultado, as melhores operações estatísticas possíveis! O preço aumenta a cada 5 compras, o próximo preço é de 69$ Envie-me uma mensagem após a compra para receber dicas/guia e um EA bônus O que o faz se destacar? Desempenho estatístico comprovado no Gold XAUUSD ( funciona em praticamente todos os ativos , com foco em dominar um ú
Em 2019, mostrei ao mundo inteiro do que este indicador é capaz. Operei os sinais dele manualmente, em uma conta real, às claras — a conta era monitorada no Myfxbook, e eu relatava o meu experimento em detalhes no Facebook. Resultado: 10.000 dólares se transformaram em 941.411 em quatro meses. O risco foi deliberadamente extremo — o drawdown chegou a 54%, afinal, na nossa profissão, lucro e risco sempre andam de mãos dadas. A captura de tela do Myfxbook é a primeira imagem da galeria. Parece que
SuperScalp Pro
Van Minh Nguyen
4.54 (37)
SuperScalp Pro - Professional Multi-Layer Confluence Scalping System O SuperScalp Pro é um indicador avançado de scalping que aprimora o Supertrend clássico com vários filtros inteligentes de confirmação. Ele ajuda a identificar oportunidades de Buy/Sell com maior probabilidade de sucesso, reduzindo significativamente os sinais falsos. Setas claras de Buy e Sell aparecem diretamente no gráfico, juntamente com os níveis de Stop Loss e Take Profit baseados em ATR, calculados automaticamente em tem
Gann Made Easy   é um sistema de negociação Forex profissional e fácil de usar, baseado nos melhores princípios de negociação usando a teoria do sr. W. D. Gann. O indicador fornece sinais precisos de COMPRA e VENDA, incluindo níveis de Stop Loss e Take Profit. Você pode negociar mesmo em movimento usando notificações PUSH. Entre em contato comigo após a compra para receber instruções de negociação e ótimos indicadores extras gratuitamente! Provavelmente você já ouviu muitas vezes sobre os método
SMC Intraday Formula
VividMind Digital Solutions
5 (26)
Vamos ser honestos primeiro. Nenhum indicador sozinho vai te tornar lucrativo. Se alguém te disser o contrário, está te vendendo um sonho. Qualquer indicador que mostre setas perfeitas de compra/venda pode ser feito para parecer impecável — basta dar zoom na parte certa da história e tirar um print das operações vencedoras. Nós não fazemos isso.  SMC Intraday Formula é uma ferramenta. Ela lê a estrutura do mercado para você, identifica as zonas de maior probabilidade de preço e mostra exatament
M1 Sniper MT5
Oleg Rodin
5 (7)
O   M1 SNIPER   é um sistema indicador de negociação fácil de usar. É um indicador de seta projetado para o período M1. O indicador pode ser usado como um sistema independente para scalping no período M1 e pode ser usado como parte do seu sistema de negociação existente. Embora este sistema de negociação tenha sido projetado especificamente para negociação no M1, ele também pode ser usado em outros períodos. Originalmente, desenvolvi este método para negociar XAUUSD e BTCUSD. Mas considero-o úti
GoldenX Entry MT5
VividMind Digital Solutions
5 (17)
GoldenX Entry é um indicador para MT5 com um algoritmo adaptativo Smart Entry Trend, um sistema de pontuação de sinais, um detector de regime de mercado e um filtro de volatilidade. Cada sinal inclui um nível de entrada calculado, três níveis de Take-Profit (TP1, TP2, TP3) e um nível de Stop-Loss. Ele é construído sobre múltiplas camadas analíticas projetadas para se adaptar a diferentes condições de mercado, combinando um sistema analítico multicamadas com um otimizador integrado e um sistema d
Gold Entry Sniper
Tahir Mehmood
5 (21)
Gold Entry Sniper – Painel ATR Multi-Tempo Profissional para Scalping e Swing Trading em Ouro Gold Entry Sniper é um indicador avançado para MetaTrader 5 projetado para fornecer sinais de compra/venda precisos para XAUUSD e outros ativos, com base na lógica de Trailing Stop ATR e análise multi-tempo . Ideal tanto para scalpers quanto para swing traders. Principais Recursos e Vantagens Análise Multi-Tempo – Veja a tendência de M1, M5 e M15 em um único painel. Trailing Stop Baseado em ATR – Níveis
Gold Trend Coach MT5
Cristhian Alexander Gaibor Cuasquer
5 (5)
Gold Trend Coach é um indicador de tendência para o ouro (XAUUSD) no MetaTrader 5 com sinais de compra e venda, stop loss e três take profit confirmados no fechamento da vela (não repinta), um coach que te guia da entrada até o TP3, um painel multi-timeframe e alertas no celular e no Telegram. Feito para scalping em M1 e M5 e intraday em M15 nas sessões de Londres e Nova York. BÔNUS: EA de auto-trading GRÁTIS para o Gold Trend Coach. Me envie uma mensagem depois da compra e eu envio o EA que ope
Próxima Atualização — Versão 2.52 em Breve! [NOVO] Prepare-se para 4 Grandes Novos Recursos Projetados para Aprimorar sua Análise de Mercado e seu Fluxo de Trabalho de Trading Estamos levando a análise de mercado a um novo nível com 4 novos recursos desenvolvidos para atender às suas necessidades de trading. Apresentamos: 1. TRADE OVERVIEW DASHBOARD 2. CONFLUENCE AT ZONE 3. STRONG & WEAK HIGH/LOW 4. OTE 1. TRADE OVERVIEW DASHBOARD Um painel que ajuda você a compreender mais facilmente o panoram
Atomic Analyst MT5
Issam Kassas
4.5 (64)
Atomic Analyst — MetaTrader 5 Após a compra, envie-me uma mensagem no MQL5 para receber Smart Universal Expert Advisor GRÁTIS, além do curso online, do manual em PDF e do acesso ao grupo privado. O Atomic Analyst reúne a ação do preço, a direção da tendência, sinais de entrada e saída, Stop Loss e vários níveis de Take Profit diretamente no seu gráfico. VEJA O SINAL. ENTENDA O CENÁRIO. O Atomic Analyst organiza sua análise em informações visuais claras: • Setas de compra e venda para identificar
Adaptive Price Action Engine Compre um indicador, ganhe o EA de graça Análise Auto-Otimizada de Tendências e Padrões de Candlestick em Múltiplos Timeframes Os mercados estão em constante mudança, e nem todos os padrões de Price Action têm o mesmo valor em todas as condições de mercado. O Adaptive Price Action Engine foi desenvolvido para se adaptar às mudanças nas condições do mercado, combinando estrutura de tendência, análise Multi-Timeframe, padrões de candlestick e otimização estatística em
ARICoins
Temirlan Kdyrkhan
ARICoin is a powerful trading companion designed to generate high-probability entry signals with dynamic TP/SL/DP levels based on volatility. Built-in performance tracking shows win/loss stats, PP1/PP2 hits, and success rates all updated live. Key Features: Buy/Sell signals with adaptive volatility bands Real-time TP/SL/DP levels based on ATR Built-in MA Filter with optional ATR/StdDev volatility Performance stats panel (Success, Profit/Loss, PP1/PP2) Alerts via popup, sound, push, or email Cust
Boba Analysis Suite
Trade Ready Solutions LLC
5 (2)
Boba Analysis Suite O Boba Analysis Suite é um indicador de análise para o MetaTrader 5. Reúne a estrutura do mercado, as zonas de preço relevantes e o contexto geral do mercado numa única visualização do gráfico. Desenvolvido a partir da experiência prática como trader e formador de traders, apoia um processo de análise estruturado: avaliar a direção do mercado, identificar níveis importantes e analisar vários períodos gráficos em conjunto. Análise em contexto O significado de cada sinal depend
ScalpPoint
Temirlan Kdyrkhan
ScalpPoint is a powerful trading companion designed to generate high-probability entry signals with dynamic TP/SL/DP levels based on volatility. Built-in performance tracking shows win/loss stats, PP1/PP2 hits, and success rates — all updated live. Key Features: Buy/Sell signals with adaptive volatility bands Real-time TP/SL/DP levels based on ATR Built-in MA Filter with optional ATR/StdDev volatility Performance stats panel (Success, Profit/Loss, PP1/PP2) Alerts via popup, sound, push, or emai
Auto Optimized SpeedAngle é um sistema de vetorização de momentum de nível institucional que elimina o sobreajuste ( curve-fitting ) por meio da otimização contínua de avanço ( Walk-Forward Optimization , WFO). Em vez de depender de entradas estáticas que se degradam quando os regimes de mercado mudam, o indicador recalibra dinamicamente seus parâmetros utilizando validação fora de amostra ( Out-of-Sample , OOS), garantindo que os sinais exibidos representem vantagens estatísticas genuínas e não
Zain Gold Scalping
Ahmed Gamal Abdel Nasser Mohamed
A complete price-action analysis tool built around dual independent entry logic, each confirmed against a volatility band, combined with a configurable set of nine optional confirmation filters that let you shape exactly how conservative or aggressive the tool's signals behave. Core Strategy Two independent entry setups, each triggering only when price moves outside a dynamic volatility band — giving two distinct ways to spot potential reversal points, which can be used together or separately.
Tokyo mt5 Indicator
Vasiliy Strukov
5 (14)
O Tokyo Indicator oferece uma visão geral visual clara da direção da tendência, de possíveis sinais de negociação e das condições de mercado. Sua linha de tendência em degraus e codificada por cores distingue as fases de alta (azul) das fases de baixa (magenta). Setas direcionais correspondentes destacam possíveis oportunidades de compra e venda quando a tendência exibida muda. Um painel integrado reúne o sinal atual, o viés de mercado, o momentum, a volatilidade e a qualidade do sinal em uma v
Azimuth Pro
Ottaviano De Cicco
5 (7)
Azimuth Pro V2: Estrutura Fractal Sintética e Entradas Confirmadas para MT5 Visão geral Azimuth Pro é um indicador de estrutura swing multinível da Merkava Labs . Quatro camadas de swing aninhadas, VWAP ancorado em swings, detecção de padrões ABC, filtragem estrutural de três timeframes e entradas confirmadas em barra fechada — um gráfico, um fluxo de trabalho dos micro-swings aos macro-ciclos. Este não é um produto de sinais cegos. É um fluxo de trabalho baseado em estrutura para traders que v
Superhero
Ihor Otkydach
5 (3)
O indicador SUPERHERO é um sistema de negociação multimoeda concebido numa base «tudo incluído». O indicador analisa o mercado de forma independente e fornece sinais sobre quando abrir e encerrar posições. Utiliza ordens Stop Loss e Take Profit. O rácio R:R é de 1:1. Este sistema pode enviar notificações push para o seu smartphone, para que possa realizar transações «em qualquer lugar», sem precisar de estar preso a um computador. É perfeito para empresas de negociação por conta própria. UM BÓNU
Indicador multimoedas de força e momentum MT5 Dynamic Forex28 Navigator é a evolução dos nossos indicadores populares de longa data e reúne a potência de três ferramentas numa só: Advanced Currency Strength28 Indicator (700 avaliações) Advanced Currency IMPULSE with ALERT (530 avaliações) CS28 Combo Signals (bónus atual) Os dois indicadores anteriores somam mais de 1.200 avaliações no MQL5 Market e são uma referência na comunidade MT4 desde 2016. O Dynamic Forex28 Navigator MT5 continua com a me
Volatility Master for MetaTrader is a real-time dashboard tool that scans up to  50 symbols  to identify high-volatility , trending markets instantly. With bullish/bearish signals, customizable alerts, and a user-friendly interface, it helps you avoid range-bound conditions and focus on high-probability trades. Clarity leads to confidence. Trade confidently and protect your capital effectively with this powerful dashboard. We don't offer free or bonus indicators in exchange of reviews from you.
Apex Patterns PRO Compre o indicador - Obtenha um Expert Advisor baseado nele GRATUITAMENTE. Inteligência Auto-otimizada de Padrões e Rompimentos Os rastreadores de padrões tradicionais dependem de entradas fixas, frequentemente apresentando baixo desempenho quando a volatilidade e as estruturas do mercado mudam. O Apex Patterns PRO foi projetado para se adaptar às mudanças nas condições do mercado, combinando o reconhecimento estrutural de padrões de gráfico, filtragem de momentum e auto-otimi
Neuro Poseidon MT5
Daria Rezueva
4.68 (53)
Neuro Poseidon is a new indicator by Daria Rezueva. It combines precise trading signals with adaptive TP/SL levels - creating best possible trades as a result! Message me and get  Neuro Poseidon Assistant  as a gift to automize your trading process! What makes it stand out? 1. Proven profitability on all assets and timeframes 2. Only confirmed BUY and SELL signals present on the chart 3. Adaptive TP & SL levels generated by the software for each trade 4. Easy to understand - suitable for al
Break and Retest Hunter is a powerful MetaTrader 5 indicator designed to automatically identify support and resistance levels, breakout structures, and potential retest opportunities in real time. Bonus Indicator: After purchasing Break and Retest Hunter , contact me to receive Trade Indicator Assistant EA completely free as a bonus utility. $65 for the next 10 copies . Next price is $120.  Combining adaptive market analysis, clear BUY/SELL signals, Fibonacci-based profit targets, and a premiu
Mais do autor
Draggable Volume Profile
Basharat Umar Khan
5 (1)
Short Description Drag two lines to any chart range for an instant Fixed-Range Volume Profile (POC, Value Area VAH/VAL) featuring Delta Coloring, Developing Profile tracking, Initial Balance, HVN/LVN, and Retest Rays. Detailed Description The Fixed-Range Volume Profile & Delta Analyzer answers a foundational market structure question: At which price did the most trading activity actually occur within a specific timeframe? Simply drag the two vertical reference lines ( START and END ) anywhere o
FREE
Short description: Automatically detects bullish and bearish Order Blocks from volume-pivot analysis and draws them as clean, flicker-free boxes with an average price line. Full description Overview OrderBlockDetector locates institutional Order Blocks — the last opposing candle before a strong volume-driven move — using a volume-pivot algorithm instead of simple candle-pattern heuristics. Each detected block is drawn as a shaded zone with a border and a midline (average price), and is automati
FREE
Session Profiles
Basharat Umar Khan
Short Description Draws rolling Time-Price-Opportunity (TPO) and footprint volume profiles for the Asia, London, and New York sessions with POC/VAH/VAL levels, delta volume bias, order flow overlays, liquidity heatmaps, developing rolling lines, Naked POC (NPOC) tracking, Initial Balance breakouts, multi-session confluence zones, and automatic broker GMT-offset detection. Full Description Plots separate market-profile and volume-profile style histograms for the three major trading sessions (Asi
FREE
Short description   Right-anchored, flicker-free Volume Profile with POC/VAH/VAL lines, tick-throttled updates, and zero measurable lag even on fast, high-volume symbols. Full description Anchored Volume Profile draws a fixed-range volume histogram from a chosen start date through to the live, forming bar — pinned to the right edge of your chart like the panels in TradingView, and built to stay smooth even on fast-moving, high-tick-volume symbols. KEY FEATURES - Fixed-range profile anchored to a
FREE
Short description GBPUSD Gamma Exposure (GEX) Profile from CME B6 Options — Call Wall, Put Wall & Zero-Gamma Flip, Live on Chart Reads a Barchart CME British Pound (B6) options CSV, solves Black-76 implied volatility per strike, and renders a right-anchored dealer GEX profile directly on your GBPUSD chart — with continuously updating Call Wall, Put Wall, and Zero-Gamma flip levels. Full description See where dealer hedging flow is likely to pin, accelerate, or reverse price — before it happens.
FREE
PriceLevels HTF
Basharat Umar Khan
Short description: A higher-timeframe round-number grid for major Forex pairs — major whole-number levels, monthly midpoints, and quarter levels (with optional eighths), spanning a wide configurable pip range. Built for H4 and above. Full description: Plots a large-scale psychological-level grid across whole numbers, half-levels, and quarters — the higher-timeframe counterpart to intraday round-number analysis. Designed for swing and position-level context on H4 and above , not for scalping time
FREE
HTF Open Markers + ICT Silver Bullet Zones — Usage & Strategy Guide What it draws Session 1 / Session 2 lines : vertical lines at the open of every bar on two independently configurable higher timeframes (defaults: H4 and D1), including a projected line for the rest of today's not-yet-opened bars on sub-daily timeframes, so you can see where the next candle will open before it happens. ICT Silver Bullet zones : shaded rectangles over the three classic ICT kill-zone windows, converted from New Yo
FREE
Volume Zone Analyzer — VSA-Based Volume, Delta & Spread Reader Turn any price zone into a Volume Spread Analysis. Drop two draggable lines on your chart to mark a Zone Start and Zone End , and Volume Zone Analyzer instantly breaks down what happened inside that zone: Total Volume for the selected range Buy / Sell Delta — estimated from where each candle closes within its own high-low range Delta % with a visual buy/sell ratio bar Average Spread , plus a count of wide vs. narrow-spread candles (t
FREE
Short description Plots a repeating grid of round-dollar levels on ETHUSD — labeled Wall / Hot Zone / Exit / Trap by their typical institutional role — tuned for lower timeframes (M1 through H1). Full description Draws horizontal reference lines at 10 intervals around the current ETHUSD price, based on the idea that round-dollar levels (multiples of $100, and near-round levels like $X20/ X80, $X50, $X10/$X90) tend to act as psychological reaction zones where liquidity and stop-hunts commonly clu
FREE
Fx Gamma Profile
Basharat Umar Khan
Fx Gamma Profile - see where the options market is positioned, directly on your MetaTrader 5 chart. Fx Gamma Profile turns an options-chain file into a gamma-exposure (GEX) map and draws it beside price: a bar for every strike, the call wall, the put wall and the zero-gamma level, plus a status panel that explains in plain words what the numbers imply. It is a decision-support tool for discretionary traders who want options-market context for FX pairs. READ BEFORE YOU BUY - THIS INDICATOR NEE
Filtro:
Sem comentários
Responder ao comentário