PriceLevels LTF

Short Description

PriceLevel LTF is an all-in-one price-structure suite for the major Forex pairs: a round-number ("big figure") reaction grid — Wall, Hot Zone, Exit, Trap — layered with volume-profile confluence, HTF Monthly/Weekly key levels, a session liquidity-sweep/stop-hunt detector, dual liquidity heatmaps, and automatic Wyckoff Method and Elliott Wave phase detection. Built and tuned for the M15 timeframe. Updates in place with no flicker and refreshes instantly on new bars and fast price moves.

Full Description

Overview

This indicator started as a simple round-number grid and has grown into a full institutional price-structure toolkit, built specifically around standard Forex broker pip conventions (auto-adjusting for 3/5-digit pricing). Because the grid, key levels, and sweep detector are all built from that shared pip logic rather than any single pair's quirks, they work identically across the major Forex pairs — EUR/USD, GBP/USD, USD/JPY, USD/CHF, AUD/USD, USD/CAD, NZD/USD — with no manual recalibration per pair. This indicator is designed for the major Forex pairs; it is not intended for metals, indices, crypto, or exotic-pair use.

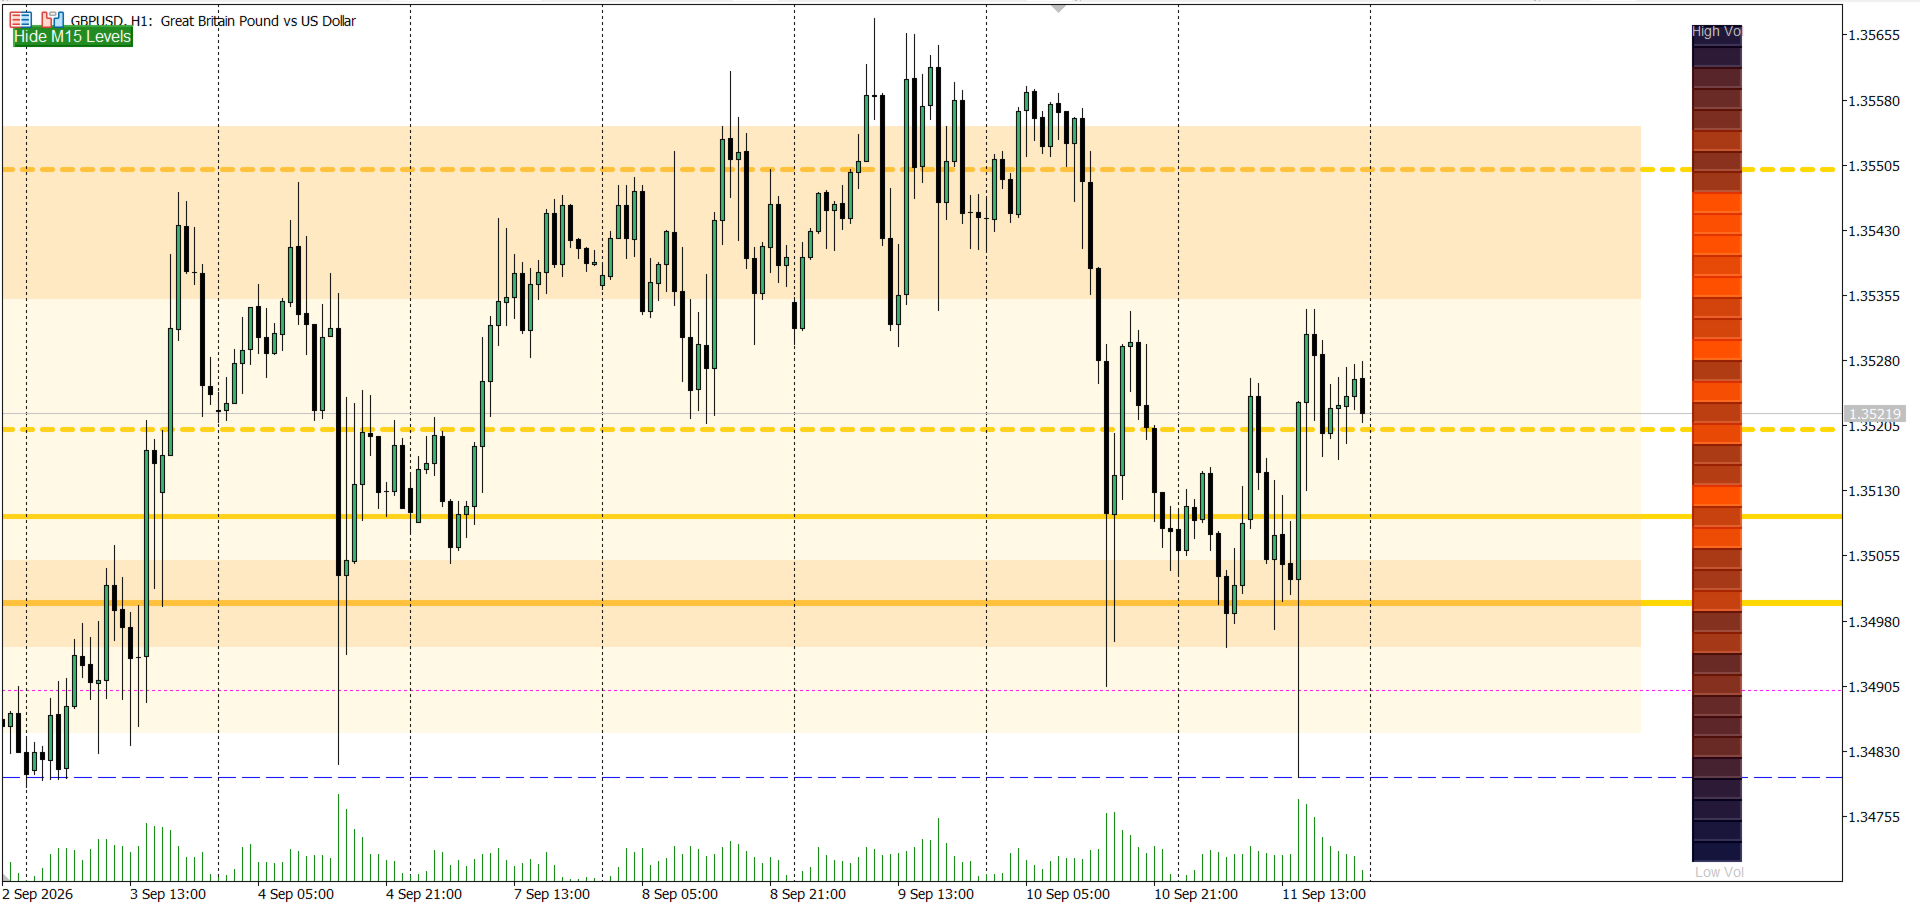
The core grid plots horizontal reference lines at 100-pip intervals, based on the idea that round numbers and near-round numbers tend to act as psychological reaction zones where stop hunts, liquidity grabs, and reversals commonly cluster:

  • .000 — The Wall: major round number, often a zone of rejection.
  • .200 / .800 — The Hot Zone: a common area to watch for entry confirmation.
  • .500 — The Exit: mid-level, often used as a partial take-profit reference.
  • .100 / .900 — The Trap: prone to fakeouts and stop hunts — a caution zone, not an entry signal.
  • Optional minor grid lines at every remaining .X00 level.

Everything else builds context around that grid: which levels line up with real volume, which sit at a higher timeframe's own key level, which just got swept and reclaimed, and where the broader wave/phase structure of the market currently stands.

Best timeframe

This indicator is built and tuned for the M15 chart — its session windows, sweep-reclaim logic, and default lookback settings are calibrated around 15-minute bars, and that's the timeframe it's most accurate and most tested on. It remains usable down to M5 and up to H4 for the grid, key-level, and sweep features. The Wyckoff and Elliott Wave detectors (below) are structure-based and will run on any timeframe, but read most reliably from M15 up to H4, where a full phase or wave cycle has enough bars to form cleanly — very low timeframes (M1) tend to produce noisier, faster-invalidating counts.

Feature set

Grid & core display

  • Feature 1 — Right-margin text labels combining level name, live metrics, and suggested action.
  • Feature 2 — Automatic pip/step scaling for correct spacing across all 3/4/5-digit major FX pairs.
  • Feature 3 — Configurable proximity alerts (popup/push/email) when price approaches a chosen level type.
  • Feature 4 — An on-chart Hide/Show toggle button for the whole grid.

Confluence & context

  • Feature 5 — Bounce/Break tracker: counts how many times each level has been respected vs. broken, shown right on the label.
  • Feature 6 — Volume-profile confluence: builds a lightweight session volume profile and highlights grid levels that sit on a genuine high-volume node (POC-relative), not just a round number.
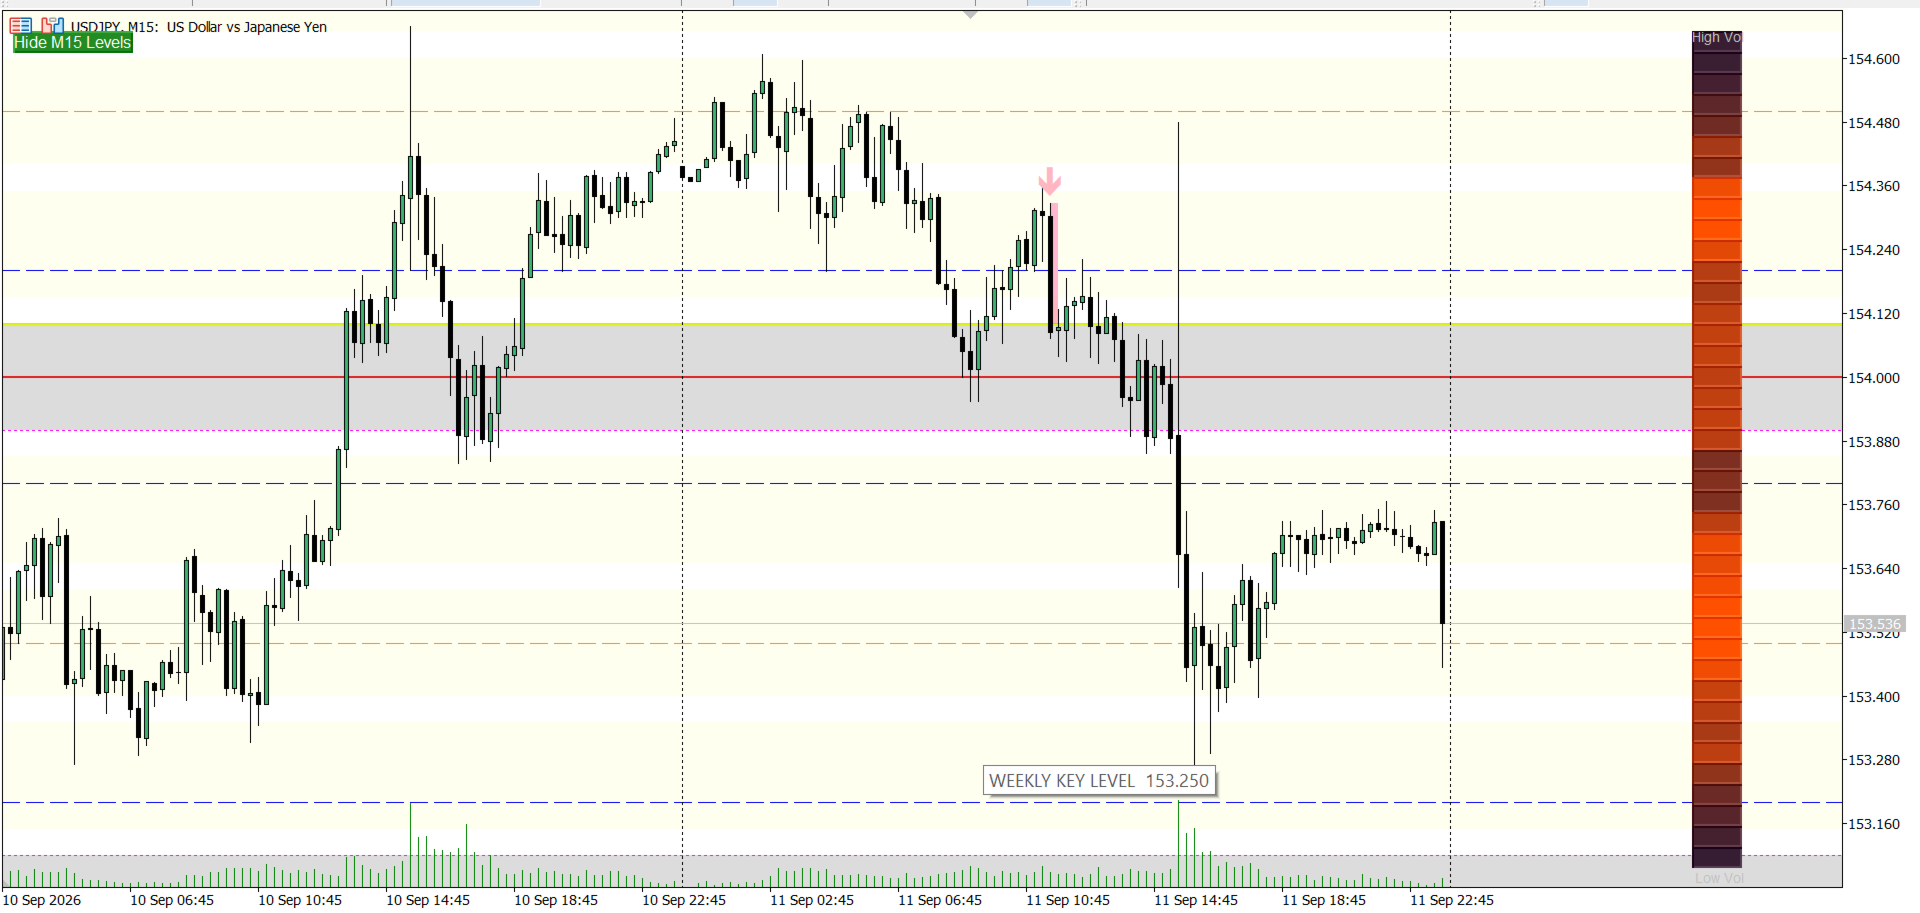
  • Feature 7 — Multi-timeframe institutional key levels: auto-detected (or manual) Monthly big-figure and Weekly quarter-figure zones drawn independently of the intraday grid.

Signal detection

  • Feature 8 — Session liquidity sweep / stop-hunt detector: watches configurable session windows (London/New York open, etc.) for a wick through a Trap level followed by a same-bar-or-N-bar reclaim, and marks it with a box and arrow. Ambiguous, two-sided (bilateral) sweeps are deliberately left undecorated rather than forced into a directional read.

Heatmaps

  • Feature 9 / 9b — Liquidity heatmap panel: a screen-anchored density strip built from tick volume, with an optional Daily/Weekly/Monthly range mode.
  • Feature 10 — Hybrid liquidity heatmap: blends tick-volume density with open-interest data from an imported options CSV (Barchart-style export, columns matched by name so a reordered file still parses correctly), and plots Call/Put "wall" lines at the strikes with the heaviest interest.

Structure detection — Wyckoff Method

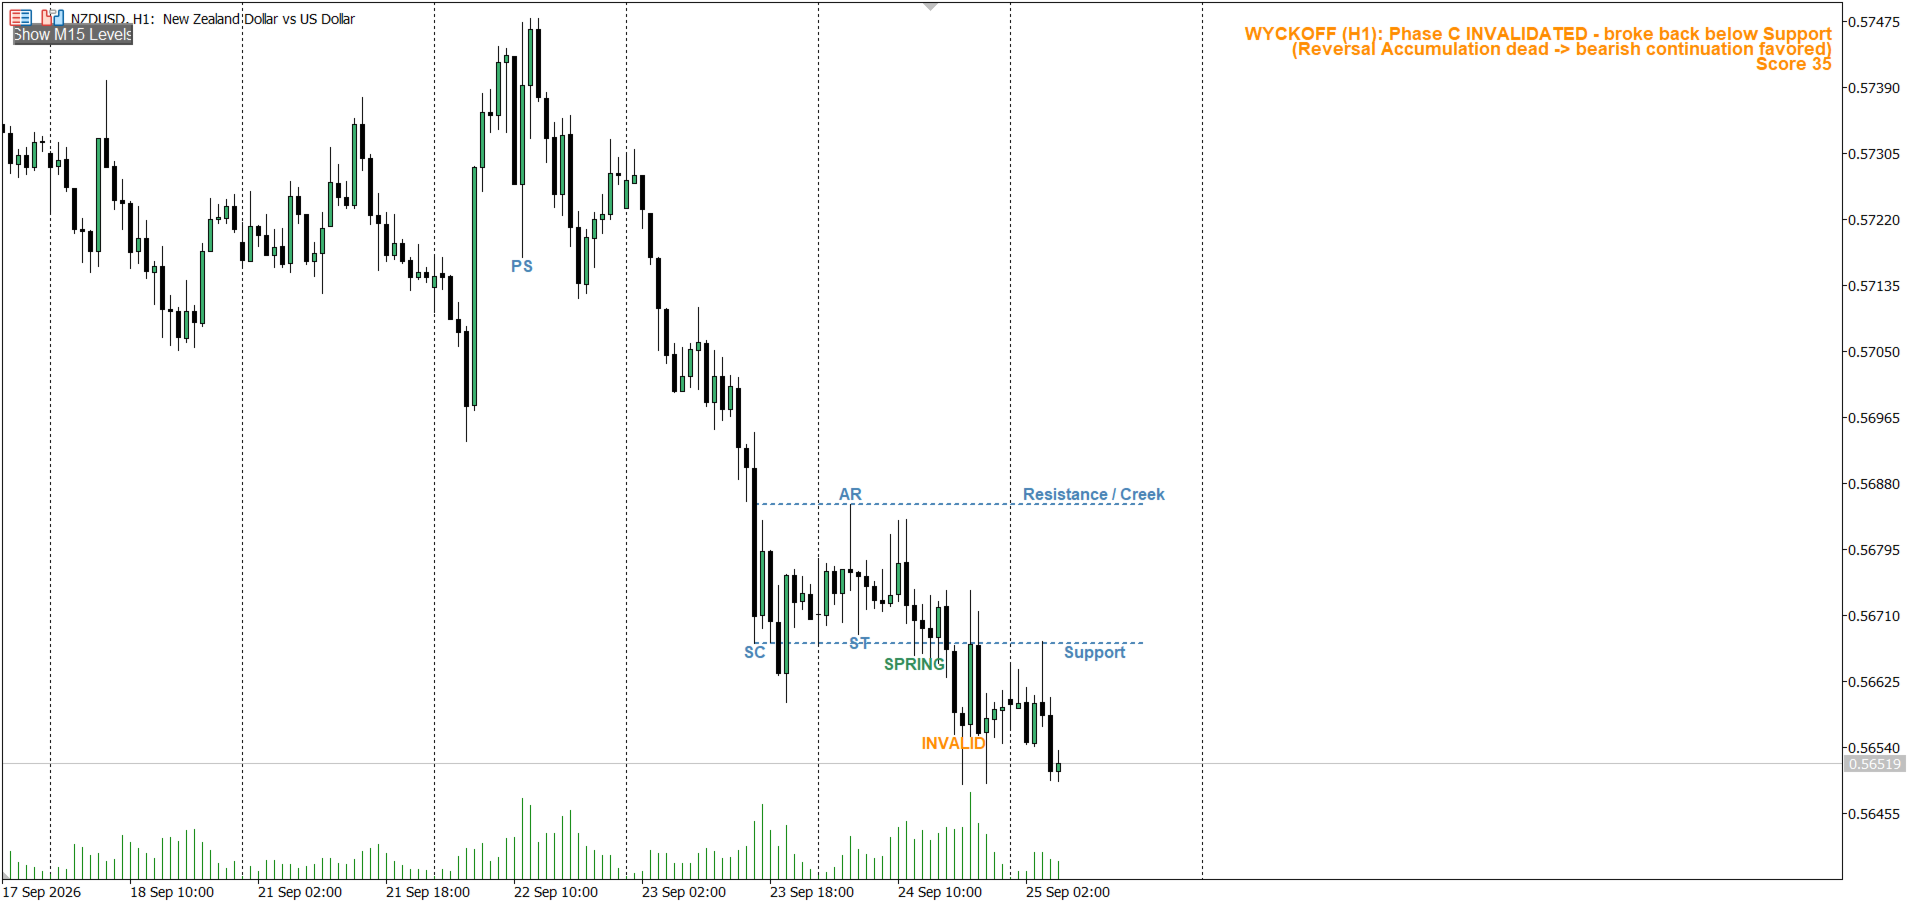
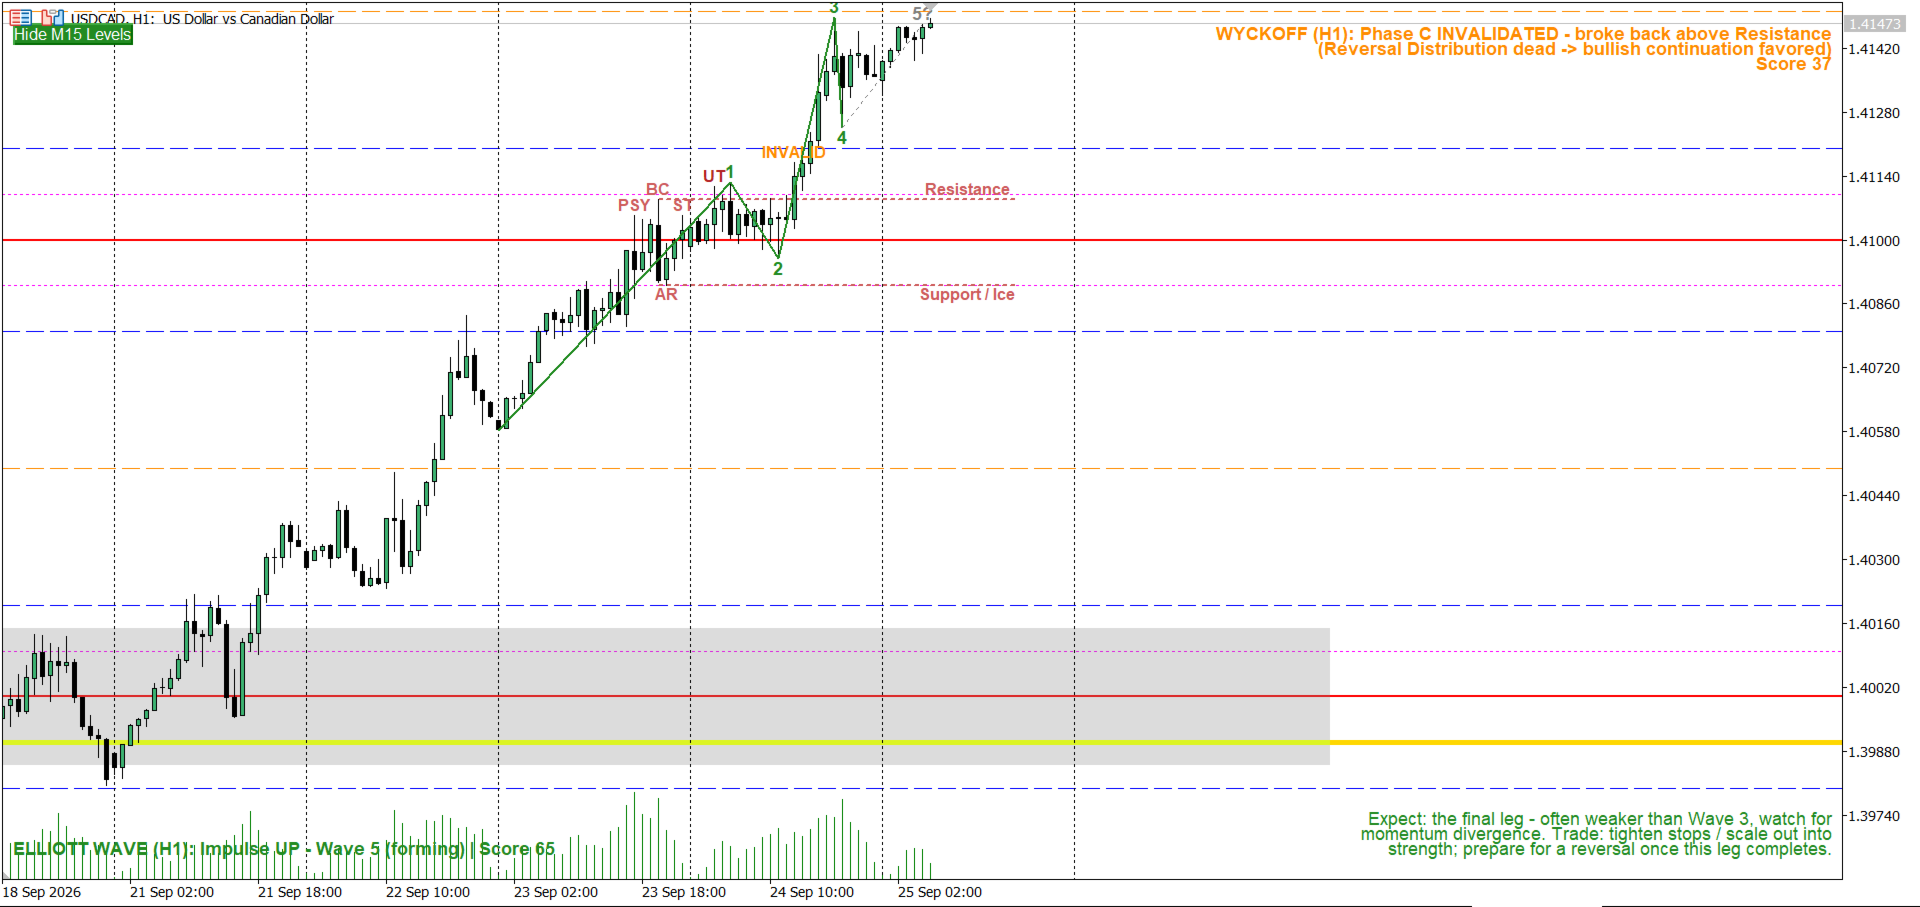
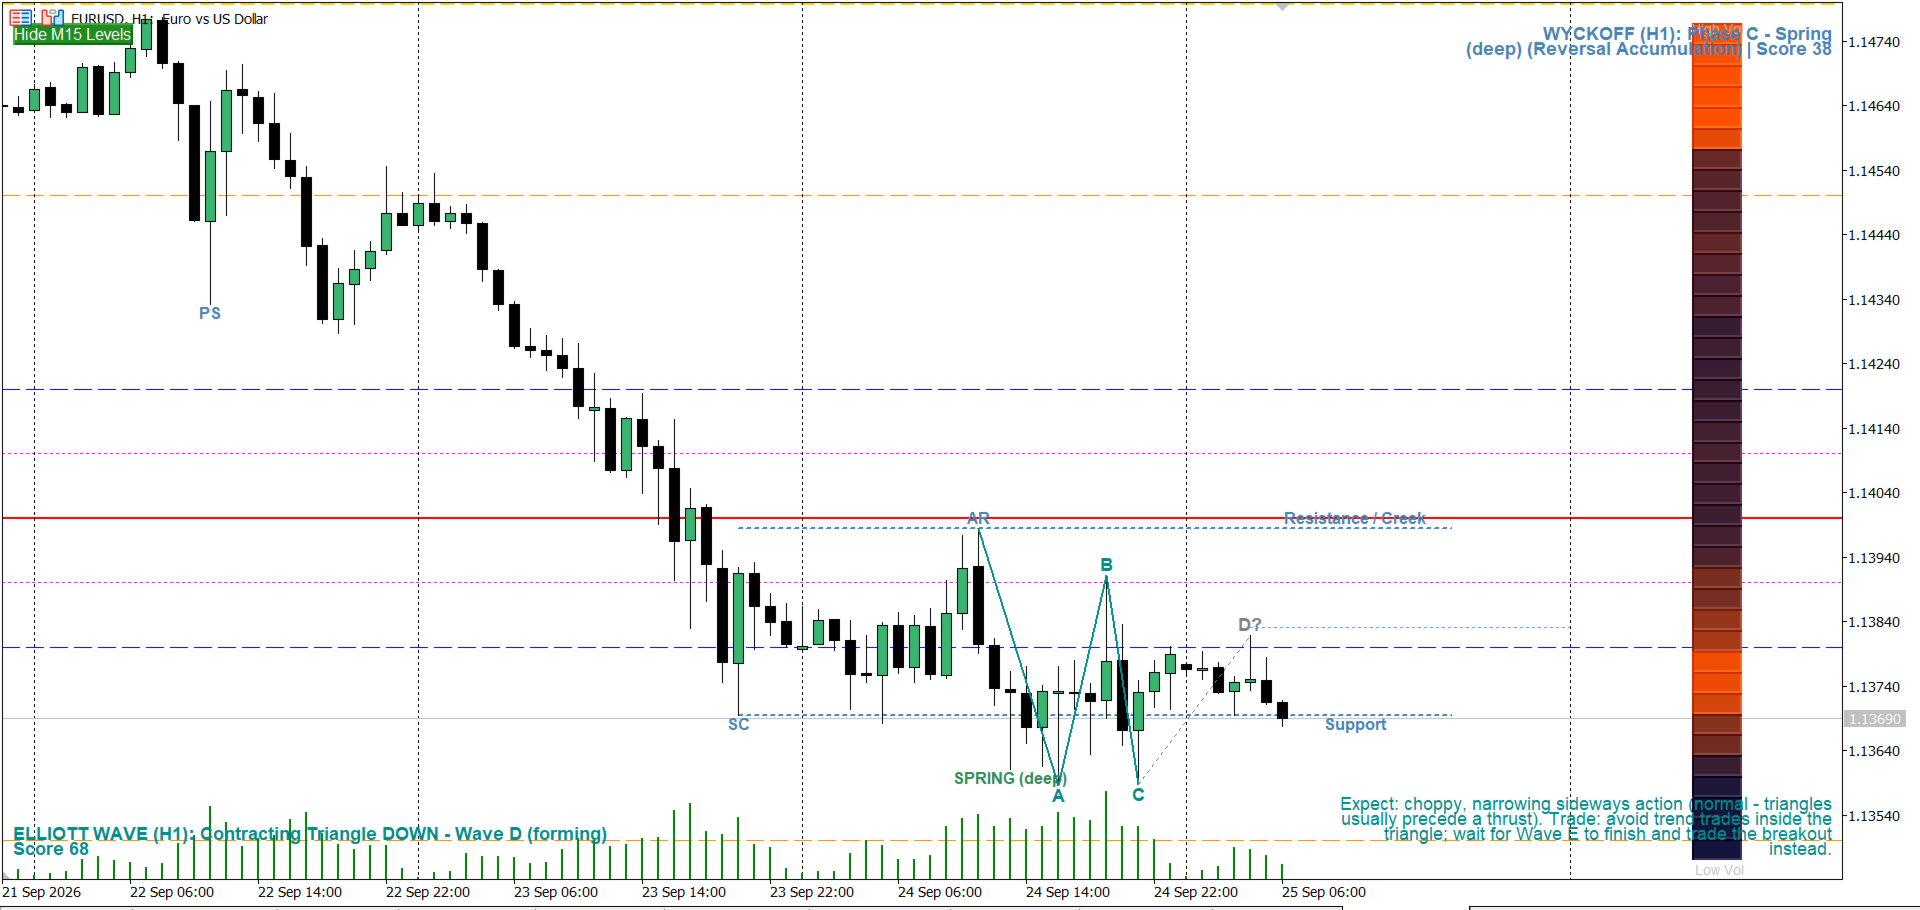
Feature 11 identifies an active Accumulation or Distribution cycle in real time, on any timeframe, and scores it with a probability-weighted status panel. It tracks the full classic sequence:

  • Preliminary Support/Supply and the Selling/Buying Climax
  • Automatic Rally / Automatic Reaction (AR)
  • Secondary Test (ST)
  • Spring (or Upthrust) — the shakeout below/above the range
  • Sign of Strength / Sign of Weakness (SOS/SOW)
  • Last Point of Support / Last Point of Supply (LPS/LPSY), with a real, bounded zone rather than a single price
  • Invalidation of a failed SOS/SOW back into the range

The panel shows which phase (A–E) the current range is in, whether the cycle is accumulation or distribution, and a confidence score based on volume behavior at each stage — using a median/trimmed-mean volume baseline so a single spike doesn't distort the read.

Structure detection — Elliott Wave

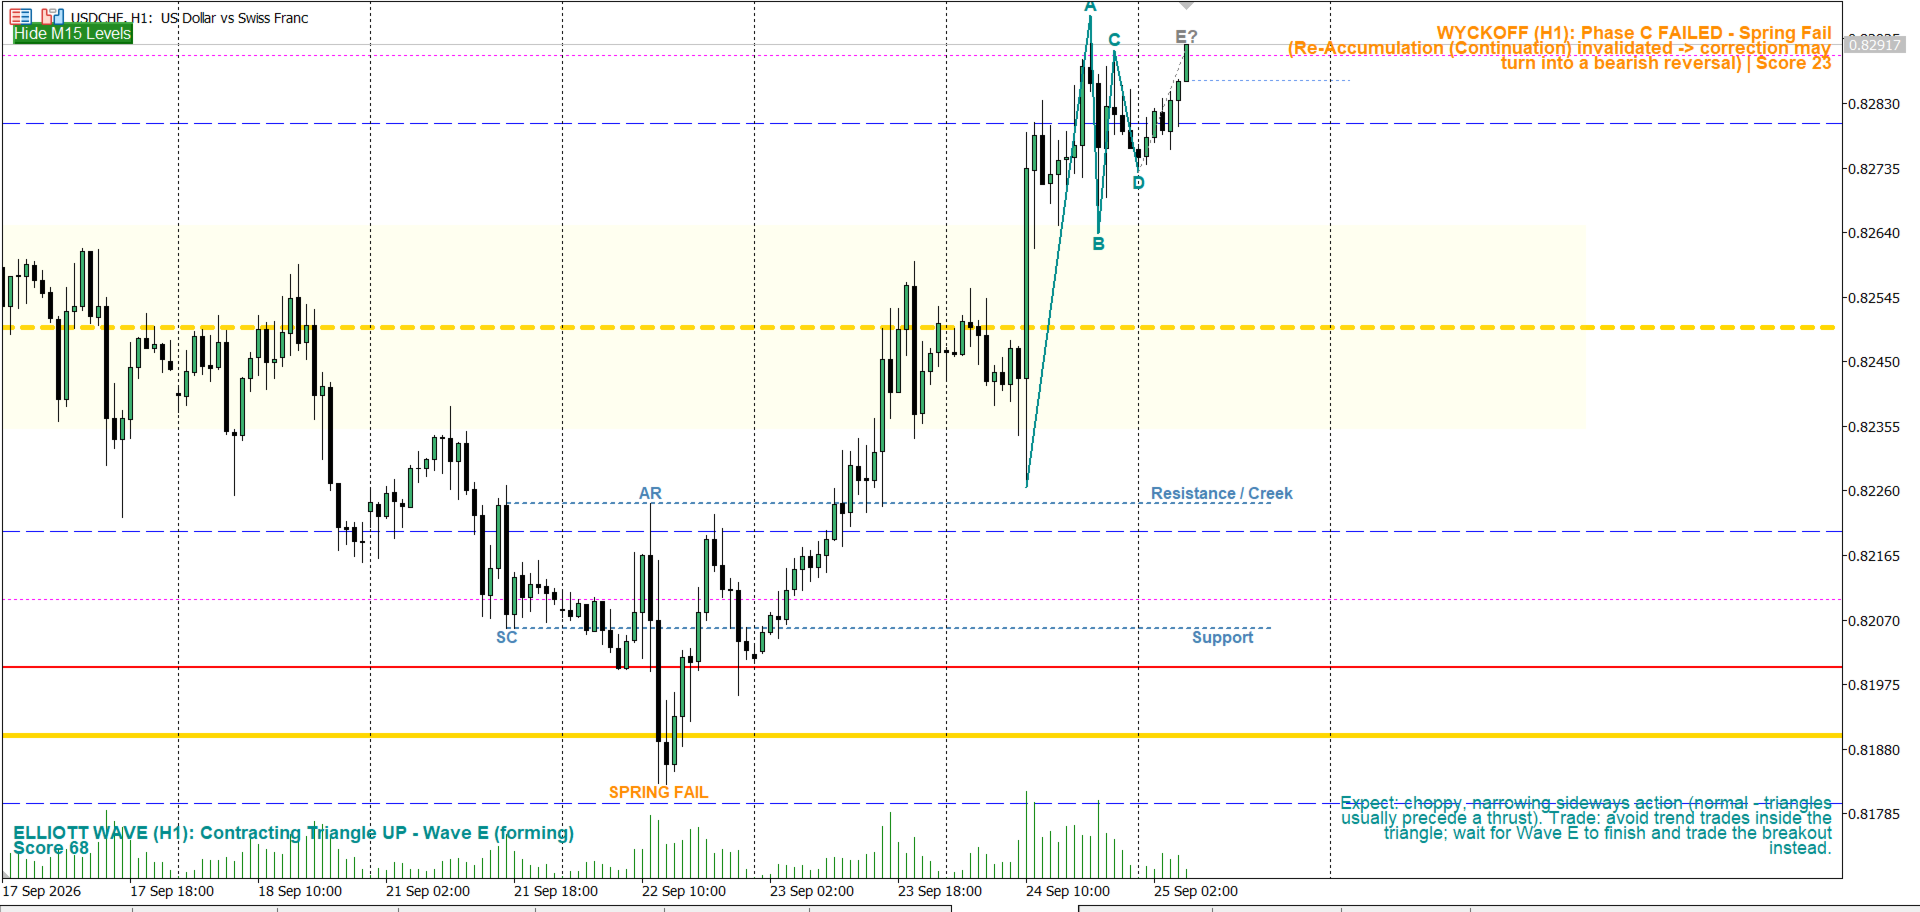
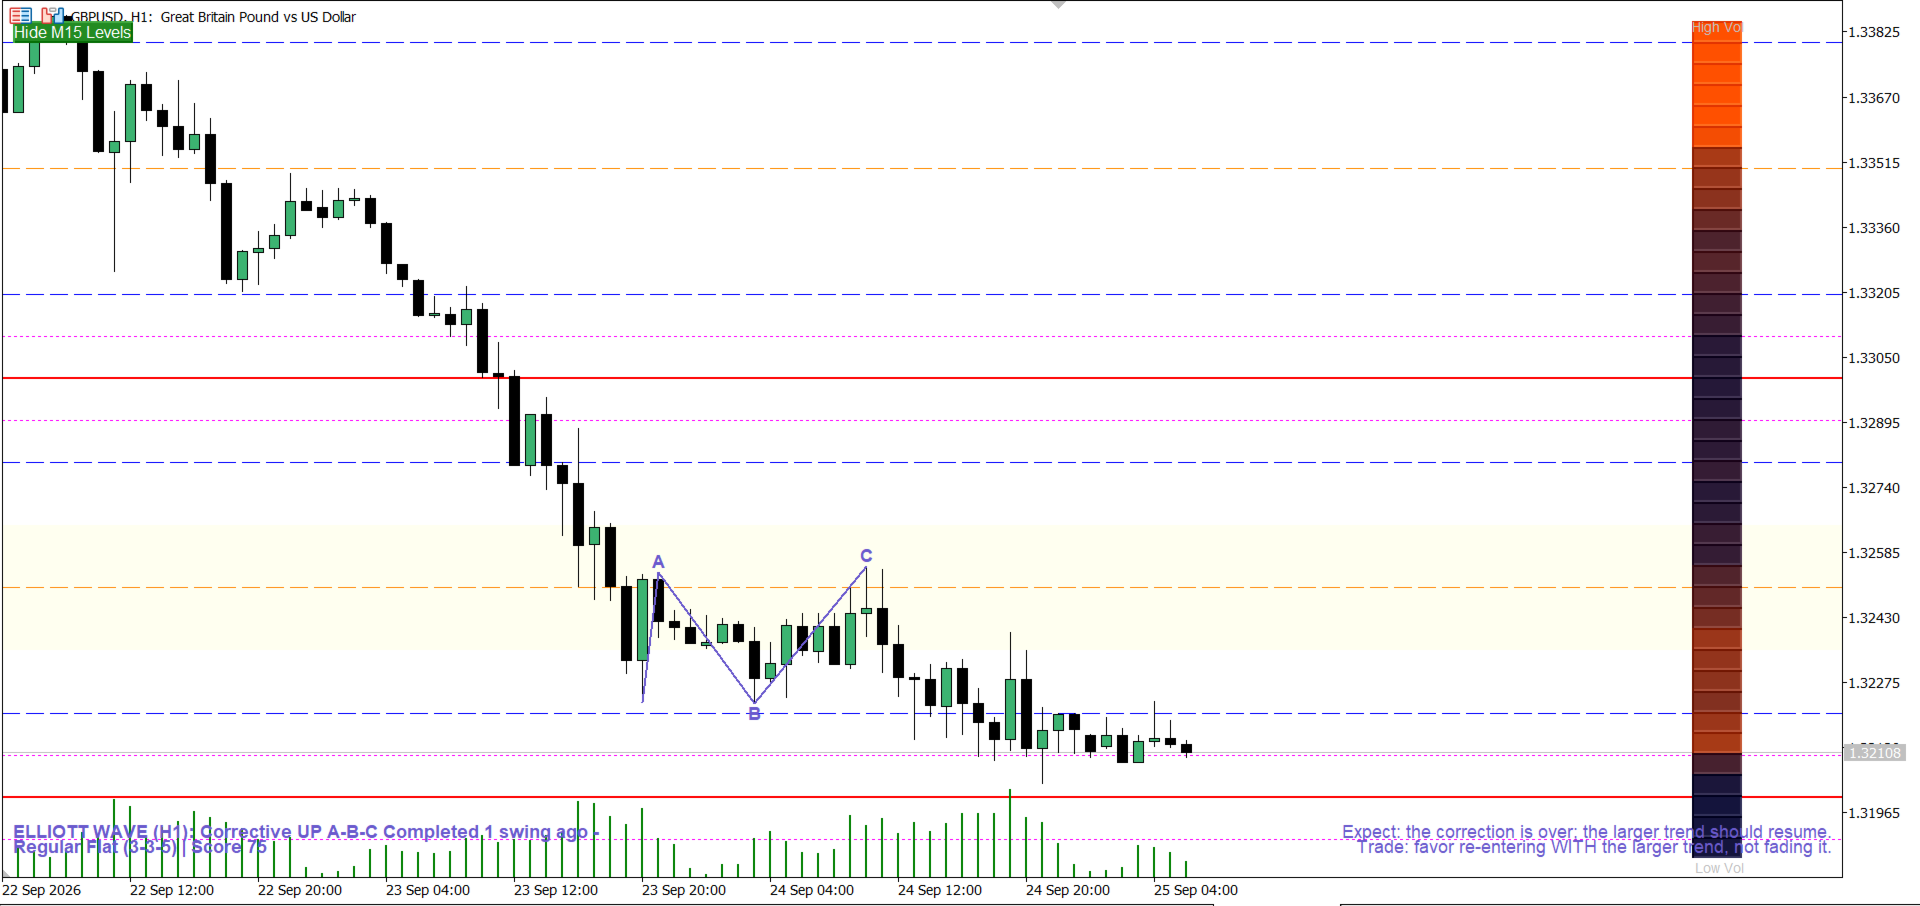
Feature 12 runs a full Elliott Wave scan on any timeframe, scoring candidates against classic Fibonacci guideline ratios and keeping the display stable via continuity/hysteresis (it won't jump between unrelated counts bar-to-bar). It detects:

  • Impulse waves (1-2-3-4-5), including Contracting and Expanding Diagonal variants
  • Corrective structures: Zigzag, Regular/Expanded/Running Flat, and Shallow/Irregular corrections
  • Triangles: both Contracting and Expanding, full A-B-C-D-E
  • Both a fully complete count and a live/forming count at once, so you can see both "what just finished" and "what's building right now"

For whichever count is active, it draws Fibonacci-based projection targets for the next wave and a plain-English guidance panel — e.g. Wave 2 = classic retrace entry zone, Wave 3 = hold/trail rather than take early profit, Wave 4 = avoid the chop, Wave 5 = tighten stops and watch for divergence, a Triangle = wait for the Wave E breakout. This is a textbook read of the detected geometry, not a signal or a recommendation.

Performance

Every visual element updates in place — grid lines, zone boxes, heatmap cells, and status panels are found and modified, not deleted and redrawn, so there's no flicker as price moves. The heavier scans (Wyckoff, Elliott, the sweep detector) only run once per new closed bar. The grid and HTF-zone window refreshes instantly on every new bar and also recenters automatically, on a short throttle, the moment price moves far enough intrabar — so a sudden news spike doesn't leave the chart stale while waiting on a timer.

How to use

  1. Watch for price approaching a Wall or Hot Zone level on your chosen major pair — these are the two level types that qualify as entry candidates; Trap levels are caution zones.
  2. Check whether the level also carries volume confluence (Feature 6) or sits on a Weekly/Monthly key level (Feature 7) — either raises its significance.
  3. If a Trap level was just swept and reclaimed (Feature 8), treat that as a stop-hunt warning rather than a reason to chase the wick.
  4. Use the Wyckoff and Elliott panels (Features 11/12) for broader phase/structure context — are you inside accumulation, or partway through an impulse — rather than as standalone entry triggers.
  5. Layer in your own confirmation (price action, order flow, or a separate volume/VSA tool) before acting on any level.

Inputs

Organized into input groups per feature (Visual Settings, then one group each for Features 1 through 12, plus the Feature 10 CSV/quote settings), so every feature can be tuned or disabled independently. All zone colors, styles, and widths are configurable, as are alert conditions, session windows, lookback depth, and detection thresholds for each detector.

Risk note

Tick volume is used as a proxy for real volume (no centralized tape exists for spot Forex), so treat volume-based reads as directional-pressure estimates rather than certainty. Wyckoff and Elliott Wave readings are the detector's structural interpretation of price, not a guarantee of what happens next. Always combine with your own risk management and trade plan.

Disclaimer

This indicator is provided for informational and educational purposes only. It does not constitute financial advice, and past price behavior at these levels or structures is not indicative of future results. Trading involves risk of loss.
Produits recommandés
The Magic SMMA indicator is of great help in determining trend direction. It can be an excellent addition to your existing strategy or the basis of a new one. We humans can make better decisions when we see better visually. So we designed it to show a different color for rising and falling trends. Everyone can customize this in the way that suits them best. By setting the Trend Period, we can optimize it for longer or shorter trends for our strategy. It is great for all time frames. IF YOU NEE
FREE
SymbolMonitor
Oleksandr Kashyrnyi
SymbolMonitor 1.3 – Prenez le contrôle total de votre trading ! Vous tradez plusieurs instruments et souhaitez suivre vos profits en temps réel ? SymbolMonitor 1.3 est un Expert Advisor puissant qui analyse automatiquement la rentabilité de chaque symbole et offre des paramètres flexibles et des notifications ! Nouvelles fonctionnalités de la version 1.3 Paramètres visuels personnalisables – ajustez la police, la taille et la couleur du texte Notifications automatiques – recevez
FREE
Supertrend Line
Flavio Javier Jarabeck
4.88 (24)
The Supertrend indicator was originally created by a french fellow named Olivier Seban , and its goal is to identify the Primary Trend of prices . Its calculation is easy and based on the average of Highs and Lows and then we add the volatility of a custom period, plus a multiplier. This way we get the Supertrend Line. You can find in the web several approaches and trading strategies using this very useful indicator. HOW TO "READ" THIS INDICATOR If the closing prices are above Supertrend Line,
FREE
EMA Clock
Flavio Carneiro De Barros
EMA Clock reads the slope of an exponential moving average as the hour hand of a clock. How it works The slope of the EMA over a chosen number of bars is normalized by the ATR, converted into an angle and then into a clock hour: - 12:00 - the average is rising steeply (hand pointing up) - 15:00 - the average is flat (hand pointing right) - 18:00 - the average is falling steeply (hand pointing down) Each hour equals 30 degrees. Normalizing by the ATR keeps the reading comparable across symbols
FREE
Color Trend
Bruno Goncalves Mascarenhas
Combining the best of Price Action , Directional Movement , and Divergence / Convergence analysis, the Candle Color Trend is the easy and reliable way to identify the direction of the trend. The indicator automatically paints the candles according to the premise that the upward trend is defined by prices that form a series of ascending tops and bottoms. On the other hand, the downward trend is defined by prices that form a series of descending tops and bottoms. Color Trend is certainly one of
FREE
Smart FVG Stats
- Md Rashidul Hasan
5 (1)
The  Smart FVG Statistics Indicator  is a powerful MetaTrader 5 tool designed to automatically identify, track, and analyze Fair Value Gaps (FVGs) on your charts. Love it? Hate it? Let me know in a review! Feature requests and ideas for new tools are highly appreciated. :) Try "The AUDCAD Trader": https://www.mql5.com/en/market/product/151841 Key Features Advanced  Fair Value Gap  Detection Automatic Identification : Automatically scans for both bullish and bearish FVGs across specified histo
FREE
PANEL OF TOPOS AND HISTORICAL BACKGROUNDS   This is a panel that does not open orders only manages all Symbols and calculates the tops and bottoms and presents the calculation in relation to the top and bottom in 5 Years, 2 Months and 1 Week. It is ideal for filtering the pairs that are in the good regions to operate. You can filter the range and choose whether to consider the body or shadow of the candle in the monthly. Good luck...
FREE
Wallstreet Pro EA
Leonit Ajvazi
3 (2)
Symbol                                       XAUUSD, AUDUSD Period                                        H1 timeframe Retail support                            YES Minimum deposit                       1000 USD (or the equivalent amount in another currency) Compatible with all brokers      YES (supports any account currency) Works without preset                YES Symbol XAUUSD, AUDUSD Period (Timeframe) H1 timeframe Retail support YES Minimum deposit 1000 USD (or the equivalent amount in ano
FREE
Rossi Campos Timing Indicator
Heber Henrique Penow Campos
ROSSI CAMPOS TIMING INDICATOR FRANÇAIS (FRANCE) 70% des robots tradent à l'ouverture/fermeture des barres   - vous devez savoir quand ils agiront Les algorithmes créent une volatilité extrême aux transitions   - sans timing vous êtes victime La connaissance du temps restant permet l'anticipation stratégique Égalise le terrain face aux traders institutionnels et leurs systèmes automatisés Augmentation prouvée de la précision d'entrée/sortie Élimine le "facteur surprise" de la fermeture de bougie
Phoenix Magic Number Dashboard
PHOENIX GLOBAL INVESTMENTS LTD
L'exécution de plusieurs EA sur un même compte rend difficile de déterminer d'un seul coup d'œil quelle stratégie contribue réellement à l'augmentation ou à la diminution de votre capital. Phoenix Magic Number Dashboard regroupe automatiquement vos transactions ouvertes et clôturées par « magic number », ce qui vous permet de comparer côte à côte les performances en temps réel et passées de chaque EA, avec les totaux à l'échelle du compte. Comment cet outil assure la clarté des comptes mu
FREE
Gap Straddle EA
Nazat Hossain Adi
Gap Straddle Trailing EA Automated Pending Order Management with Smart Trailing Stop Gap Straddle Trailing EA is an Expert Advisor for MetaTrader 5 designed to manage pending orders and trade protection through configurable settings. It includes automated order management, risk-based lot sizing, trailing stop functionality, session controls, and an on-chart dashboard. Key Features Buy Stop & Sell Stop Management — Automated pending-order placement and management. OCO Functionality — Opposite pen
Apex Point
Marco Engstermann
Apex Point is a trend-following indicator for MetaTrader 5, transforming complex market data into signals for traders. It displays blue dots for uptrends, red dots for downtrends, and yellow crosses at potential reversals, helping users identify momentum shifts quickly. Key features include a confirmation system requiring multiple bars (default: 3) to validate changes, reducing false signals; dynamic ATR-based offsets for adaptive trailing, with instant ratcheting in the trend direction and smo
FREE
Description One Click Chart Changer is a lightweight and user-friendly MetaTrader 5 indicator that allows traders to switch between multiple trading symbols instantly with a single click. Designed for speed and convenience, this tool eliminates the need to manually search through the Market Watch window. With its modern floating panel interface, you can manage symbol switching directly from your chart. Key Features One-click instant chart symbol switching Fully draggable floating panel Sm
FREE
RBM Atr Pro
Renato Brendim Medici
RBM ATR PRO v1.10 Quem opera mercado volátil sabe como é ruim tomar stop por causa de uma violinada de pavio e ver o preço andar forte a favor logo depois. O RBM ATR PRO foi desenvolvido exatamente para resolver isso. Ele evolui o indicador clássico de volatilidade combinando a leitura do ATR com dois níveis independentes de suavização. A linha no gráfico fica limpa e objetiva: verde para estrutura de alta e vermelha quando o mercado vira para a baixa. Funciona perfeitamente para rastrear a ten
FREE
Order Block Breaker Block Zone by RWBTradeLab A strict Order Block, and the Breaker Block that a failed one turns into. Most Order Block indicators mark any candle before a move. This one asks for five things, all mandatory, and shows you the evidence for each — with a full market structure engine built in, so the BOS or CHoCH that confirmed a block is drawn on the chart instead of having to be trusted. All from CLOSED candles only. What Makes an Order Block Here Five things have to happen,
FREE
LATTICE VISION THE MOST ADVANCED ORDER-NETWORK ANALYSIS TOOL ON MQL5. Not a claim. A position backed by published, independently testable fidelity data. Discover with Lattice Vision. Deploy with Lattice Command. One engine. Two instruments. One continuous workflow. Lattice Vision is the original level-trading analysis tool — Grid Trading 2.0, engineered properly. When you find a configuration in Vision, the matching live engine produces the same trades. Eighteen test configurations coveri
FREE
VFI Quantum
Nikita Berdnikov
5 (1)
Introducing VFI (Volume Flow Indicator) – a trading indicator that analyzes the relationship between volume and price movement to identify key trading opportunities. The indicator displays the strength and direction of volume flow, providing clear signals about potential entry and exit points. Signals are formed based on zero line crossovers, crossovers between the VFI line and its exponential moving average (EMA), and when the indicator exits overbought and oversold zones. Attention! This stra
FREE
PairTrade
Dmitriy Golubev
PairTrade EA – Intelligent Pair Trading System About the EA PairTrade EA   is an automated trading system built on the fundamental principle of   Pairs Trading . The strategy is based on statistical arbitrage between two correlated instruments. The core concept is simple yet effective: the bot simultaneously opens two trades on different but historically correlated instruments in opposite directions. The algorithm calculates the current divergence (spread) between currency pairs, sells the l
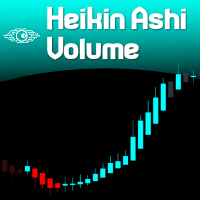
Heikin Ashi Volume
Flavio Javier Jarabeck
For those who love to trade using the Heikin Ashi Candlesticks, here it is one more powerful ally: Heikin Ashi Volume . This indicator is an exclusive idea and creation from us at Minions Labs for you. The idea behind this indicator is to have a visual cue over the Heiken Ashi candles pointing at those candles with big volume. For this to happen you can choose between 2 different techniques of identifying the "high" volume: Higher Volume above the last N previous bars average. Higher Volume segm
Description of work The MA7 Flax indicator is based on the standard Average True Range indicator and candle data. Shows candles that are larger in size relative to the ATR indicator value. Detailed information about the MA7 Flax indicator. Indicator settings General settings: Period ; Multiplier ; Remove subsequent arrows – removes subsequent arrows in one direction. Message settings: Send message to the terminal (Alert) – permission to send messages to the terminal using the Alert function; S
VPEO Volume Statistics VPEO Volume Statistics is a customizable volume-analysis indicator for MetaTrader 5. VPEO stands for Volume Pressure and Efficiency Oscillator. The indicator combines directional volume pressure, a statistical analysis of rising or falling market participation, volume-efficiency conditions, optional BUY and SELL markers, and a compact dashboard in one interface. The indicator is designed to answer three separate questions: Is current volume pressure mainly positive or nega
FREE
Donchian通道(唐奇安通道指标)是用于交易突破的最古老、最简单的技术指标之一。   一般来说,唐奇安通道的宽度越宽,市场波动就越大,而唐奇安通道越窄,市场波动性也就越小 。此外,价格走势可以穿过布林带,但你看不到唐奇安通道的这种特征,因为其波段正在测量特定时期的最高价和最低价。 交易实用必备工具指标 波浪自动计算指标,通道趋势交易 完美的趋势-波浪自动计算通道计算 , MT4版本 完美的趋势-波浪自动计算通道计算 , MT5版本 本地跟单复制交易 Easy And Fast Copy , MT4版本 Easy And Fast Copy , MT5版本 本地跟单复制交易 模拟试用 Easy And Fast Copy , MT4 模拟账号运行 Easy And Fast Copy , MT5 模拟账号运行 唐奇安通道指标计算: 唐奇安上阻力线 - 由过去N天的当日最高价的最大值形成。 唐奇安下支撑线 - 由过去N天的当日最低价的最小值形成。 中心线 - (上线 + 下线)/ 2   唐奇安通道信号   唐奇安通道常用作突破指标。它提供了两种主要类型的突破信号,一个是上阻力线或下支
FREE
Inside Day Narrow Range 4
Luiz Augusto De Medeiros Pellegrini
IDNR4 — Indicator Description (English) The IDNR4 (Inside Day Narrow Range 4) is a volatility-compression pattern that identifies potential breakout conditions. It combines two concepts: NR4 (Narrow Range 4) The current bar has the smallest high–low range compared to the previous three bars. Inside Bar (ID) The current bar’s high and low are fully contained within the range of the previous bar. Signal Logic • When the bar is NR4 only , it is highlighted as a normal contraction pattern. • Wh
FREE
Sniper Liquidity Indicator Sniper Liquidity System Sniper Liquidity System maps where liquidity rests, tracks when price takes it, and confirms the shift in market structure that often follows. Once a setup forms, it draws a complete trade plan on your chart: entry, stop loss, take profit and Risk:Reward. No DLLs. No external software. No repainting after a bar closes. Just attach it to a chart. Features Complete signals with a fixed Risk:Reward tool Entry at the fair value gap's full fill or th
FREE
Tired of information overload when analyzing forex currency strength? Introducing "All Currency Strength Live", the ultimate dashboard indicator for MetaTrader 5 that simplifies your trading life. This innovative tool provides a clear, concise overview of the strength of all major currencies, empowering you to make informed trading decisions with ease. With "All Currency Strength Live,"  you gain access to real-time insights into both price and volume strength across all major currencies. No mor
Daily Drop Analyzer
Rafael Gazzinelli
5 (1)
Automate Your Strategy! Use the Expert Advisor Daily Drop Analyzer to automatically execute the strategy, with filters, configurable parameters, and order management. Check it here: Daily Drop Analyzer EA Daily Drop Analyzer is a technical indicator for MetaTrader 5 that performs historical tests based on daily percentage drops. It analyzes up to 200 Market Watch symbols to identify recurring entry levels within a configurable range. The calculation uses daily candles (default: 120 days) and
FREE
Lts Trend Strength
Gabriel Garcia Bogo
Grid baskets rarely break in a quiet market. They break when a trend starts and nobody notices it in time. LTS Trend Strength is the market-regime filter from LTS - Legacy Trading System. In one look it tells you whether the market is ranging, in transition or in a strong trend, on your chart and on four higher timeframes at the same time. It is built on the same ADX and ATR principles we use to protect our Expert Advisors, and it is free. It is a market filter, not an entry signal: it tells yo
FREE
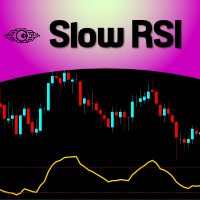
Slow RSI
Flavio Javier Jarabeck
4.8 (5)
For those who feel that regular RSI is too fast and too noisy to be used on regular trades or in EAs and want to have an alternative to meter the Momentum of the Price, here is a solution presented on the great article of the Technical Analysis of Stocks & Commodities magazine (April, 2015), by Vitali Apirine, called: Slow Relative Strenght Index . Its reading is almost the same as the regular RSI, but its levels of Overbought and Oversold are 80 and 20 instead. SRSI is very powerful to show div
FREE
100% GRATUIT — version complète, sans limitation ni inscription. CE QU'IL FAIT - BUY/SELL en un clic sur le symbole du graphique, avec SL et TP en pips. - Lot par risque : saisissez un % de risque et le panneau calcule le lot d'après la distance du stop et la valeur du tick ; chaque trade risque la même fraction du solde. Basculable en lot fixe. - Lot sûr : ajusté automatiquement au minimum, maximum, pas et limite du courtier et plafonné par votre maximum. La marge est vérifiée avant chaque or
FREE
Daily Volatility Tracker   is a practical and lightweight indicator designed to help traders monitor and analyze market volatility based on historical daily price movements. Whether you're a day trader, swing trader, or scalper, understanding how much a market moves per day is critical for: Choosing the right pairs to trade Setting accurate stop-loss and take-profit levels Adapting to changing market conditions MT4 Version -  https://www.mql5.com/en/market/product/134958/ Join To Learn Market De
FREE
Les acheteurs de ce produit ont également acheté
Trend Sniper X
Sarvarbek Abduvoxobov
4.86 (43)
Trend Sniper X est un indicateur de suivi de tendance multi-unités de temps pour MetaTrader 5 qui aide les traders à identifier la direction de la tendance et les points d'inversion potentiels avec clarté et précision. pour MT4: https://www.mql5.com/en/market/product/193245 Informations sur le prix : Le prix actuel est un prix promotionnel et est susceptible de changer lors des prochaines mises à jour et nouvelles fonctionnalités. Offre bonus : Pour obtenir GRATUITEMENT l'Auto-Trade Assistant E
Smart Trend Trading System — MetaTrader 5 Après votre achat, envoyez-moi un message sur MQL5 pour recevoir GRATUITEMENT Smart Universal Expert Advisor, ainsi que le cours en ligne, le manuel PDF et l’accès au groupe privé. STTS réunit la direction de la tendance, les signaux d’entrée et de sortie, les zones de retournement et les niveaux de prix importants directement sur votre graphique. Suivez le système manuellement ou connectez un EA compatible distinct pour une exécution automatique selon l
Un nouveau Roi en ville - Indicateur + Gestion des ordres (TP1 + TP2 + TP3) + Envoi optionnel de signaux Telegram INCLUS (GRATUIT) (SYSTÈME COMPLET DE TRADING et DE SIGNAUX) Notre meilleur EA pour l’Or : Gold Slayer Cet indicateur inclut une stratégie avancée, un système de trading avec gestion des ordres personnalisable ainsi qu’un système de retour à la moyenne combinant des extensions d’enveloppes, soutenu par plusieurs filtres intelligents de confirmation comme le RSI afin de détecter des en
Zoryk Gold
Reda El Koutbane
4.78 (18)
ZORYK — Système avancé de signaux XAUUSD pour MetaTrader 5 Vous connaissez certainement cette sensation. Vous passez du temps à analyser l’or. Vous attendez le bon point d’entrée. Vous ouvrez enfin la position, puis le prix commence immédiatement à évoluer contre vous. Vous fermez trop tôt, déplacez le Stop Loss ou hésitez pendant quelques secondes. Ensuite, le marché atteint exactement l’objectif que vous aviez initialement prévu, mais sans vous dans la position. Le problème n’était pas toujour
Gardez votre avantage de trading dans votre ligne de mire ! M5 Sniper est un nouvel indicateur de MeanFX. Il combine des signaux de trading précis avec des niveaux de TP/SL adaptatifs — créant ainsi les meilleures opportunités de trading statistiques possibles ! Le prix augmente tous les 5 achats, le prochain prix est de 69$ Envoyez-moi un message après l’achat pour recevoir des conseils/un guide et un EA bonus Qu’est-ce qui le distingue ? Performance statistique éprouvée sur Gold XAUUSD ( fonct
Ultra Indicator
Ihor Otkydach
5 (1)
ULTRA est un indicateur technique « tout-en-un » : il analyse le marché de manière autonome, génère des signaux de trading, affiche les niveaux permettant de définir des ordres stop-loss et suggère le moment opportun pour clôturer les positions afin de sécuriser les bénéfices ou de minimiser les pertes. En d'autres termes, peu importe que vous ne sachiez pas analyser le marché, déterminer les niveaux (où placer votre stop-loss) ou que vous ayez du mal à gérer votre capital. ULTRA s'occupera de t
En 2019, j'ai montré au monde entier ce dont cet indicateur est capable. J'ai tradé ses signaux manuellement, sur un compte réel, en toute transparence — le compte était suivi sur Myfxbook, et je relatais cette expérience en détail sur Facebook. Résultat : en quatre mois, 10 000 dollars sont devenus 941 411. Le risque était délibérément extrême — le drawdown allait jusqu'à 54 %, car dans notre métier, le profit et le risque vont toujours de pair. La capture d'écran de Myfxbook est la première im
SuperScalp Pro
Van Minh Nguyen
4.54 (37)
SuperScalp Pro - Professional Multi-Layer Confluence Scalping System SuperScalp Pro est un indicateur de scalping avancé qui améliore le Supertrend classique grâce à plusieurs filtres intelligents de confirmation. Il vous aide à identifier des opportunités de trading Buy/Sell présentant une probabilité de réussite plus élevée, tout en réduisant considérablement les faux signaux. Des flèches Buy et Sell bien visibles apparaissent directement sur le graphique, avec des niveaux de Stop Loss et de T
Gann Made Easy   est un système de trading Forex professionnel et facile à utiliser qui est basé sur les meilleurs principes de trading en utilisant la théorie de mr. WD Gann. L'indicateur fournit des signaux d'ACHAT et de VENTE précis, y compris les niveaux Stop Loss et Take Profit. Vous pouvez échanger même en déplacement en utilisant les notifications PUSH. VEUILLEZ ME CONTACTER APRÈS L'ACHAT POUR RECEVOIR GRATUITEMENT DES INSTRUCTIONS DE TRADING ET D'EXCELLENTS INDICATEURS SUPPLÉMENTAIRES! V
SMC Intraday Formula
VividMind Digital Solutions
5 (26)
Commençons par être honnêtes. Aucun indicateur ne vous rendra rentable à lui seul. Si quelqu’un vous dit le contraire, il vous vend un rêve. Tout indicateur qui affiche des flèches parfaites d’achat/vente peut être rendu impeccable — il suffit de zoomer sur la bonne partie de l’historique et de capturer uniquement les trades gagnants. Nous ne faisons pas cela.  SMC Intraday Formula est un outil. Il lit la structure du marché pour vous, identifie les zones de prix à la probabilité la plus élevée
M1 Sniper MT5
Oleg Rodin
5 (7)
M1 SNIPER   est un système d'indicateurs de trading facile à utiliser. Il s'agit d'un indicateur à flèche conçu pour l'unité de temps M1. Cet indicateur peut être utilisé seul pour le scalping sur l'unité de temps M1 ou intégré à votre système de trading existant. Bien que conçu spécifiquement pour le trading sur l'unité de temps M1, ce système peut également être utilisé avec d'autres unités de temps. Initialement, j'avais conçu cette méthode pour le trading du XAUUSD et du BTCUSD. Cependant, j
GoldenX Entry MT5
VividMind Digital Solutions
5 (17)
GoldenX Entry est un indicateur MT5 doté d’un algorithme adaptatif Smart Entry Trend, d’un système de scoring des signaux, d’un détecteur de régime de marché et d’un filtre de volatilité. Chaque signal inclut un niveau d’entrée calculé, trois niveaux de Take-Profit (TP1, TP2, TP3) ainsi qu’un niveau de Stop-Loss. Il est construit sur plusieurs couches analytiques conçues pour s’adapter à différentes conditions de marché, combinant un système analytique multicouche avec un optimiseur intégré et u
Gold Entry Sniper
Tahir Mehmood
5 (21)
Gold Entry Sniper – Tableau de Bord ATR Multi-Unités de Temps pour Scalping et Swing Trading sur l'Or Gold Entry Sniper est un indicateur avancé pour MetaTrader 5 qui fournit des signaux d'achat/vente précis sur XAUUSD et autres actifs, basé sur la logique de Trailing Stop ATR et l' analyse multi-unités de temps . Caractéristiques et Avantages Clés Analyse Multi-Unités de Temps – Affiche les tendances en M1, M5, M15 sur un seul tableau. Trailing Stop Basé sur l'ATR – Ajuste automatiquement selon
Prochaine mise à jour — Version 2.52 bientôt disponible ! [NOUVEAU] Préparez-vous à découvrir 4 nouvelles fonctionnalités majeures conçues pour améliorer votre analyse du marché et votre flux de travail de trading Nous faisons passer l’analyse du marché au niveau supérieur avec 4 nouvelles fonctionnalités conçues pour répondre à vos besoins en trading. Découvrez : 1. TRADE OVERVIEW DASHBOARD 2. CONFLUENCE AT ZONE 3. STRONG & WEAK HIGH/LOW 4. OTE 1. TRADE OVERVIEW DASHBOARD Un tableau de bord qu
Gold Trend Coach MT5
Cristhian Alexander Gaibor Cuasquer
5 (4)
Gold Trend Coach est un indicateur de tendance pour l'or (XAUUSD) sur MetaTrader 5 avec des signaux d'achat et de vente, un stop loss et trois take profit confirmés à la clôture de la bougie (sans repaint), un coach qui vous guide de l'entrée jusqu'au TP3, un tableau multi-timeframe et des alertes sur votre téléphone et sur Telegram. Conçu pour le scalping en M1 et M5 et l'intraday en M15 pendant les sessions de Londres et de New York. BONUS : EA d'auto-trading GRATUIT pour Gold Trend Coach. Écr
Atomic Analyst MT5
Issam Kassas
4.5 (64)
Atomic Analyst — MetaTrader 5 Après votre achat, envoyez-moi un message sur MQL5 pour recevoir GRATUITEMENT Smart Universal Expert Advisor, ainsi que le cours en ligne, le manuel PDF et l’accès au groupe privé. Atomic Analyst réunit l’action des prix, la direction de la tendance, les signaux d’entrée et de sortie, le Stop Loss et plusieurs niveaux de Take Profit directement sur votre graphique. REPÉREZ LE SIGNAL. COMPRENEZ LA CONFIGURATION. Atomic Analyst présente son analyse sous forme d’inform
Boba Analysis Suite
Trade Ready Solutions LLC
5 (2)
Boba Analysis Suite Boba Analysis Suite est un indicateur d’analyse pour MetaTrader 5. Il réunit la structure du marché, les zones de prix pertinentes et le contexte général du marché dans une même vue graphique. Développé à partir de l’expérience pratique d’un trader et formateur en trading, il accompagne une démarche d’analyse structurée : évaluer la direction du marché, identifier les niveaux importants et analyser plusieurs unités de temps conjointement. Une analyse en contexte La significat
Adaptive Price Action Engine Achetez un indicateur, obtenez l'EA gratuitement Analyse auto-optimisée des tendances et des figures de chandeliers Multi-Timeframe Les marchés évoluent constamment, et tous les modèles de Price Action n’ont pas la même valeur dans toutes les conditions de marché. Adaptive Price Action Engine a été conçu pour s’adapter aux changements du marché en combinant structure de tendance, analyse Multi-Timeframe, figures de chandeliers et optimisation statistique au sein d’un
Azimuth Pro
Ottaviano De Cicco
5 (7)
Azimuth Pro V2: Synthetic Fractal Structure and Confirmed Entries for MT5 Overview Azimuth Pro is a multi-level swing structure indicator by Merkava Labs . Four nested swing layers, swing-anchored VWAP, ABC pattern detection, three-timeframe structural filtering, and closed-bar confirmed entries — one chart, one workflow from micro-swings to macro-cycles. This is not a blind signal product. It is a structure-first workflow for traders who care about location, context, and timing. Halloween P
Auto Optimized SpeedAngle est un système de vectorisation du momentum de niveau institutionnel qui élimine l'ajustement de courbe ( curve-fitting ) grâce à une optimisation continue par avancement ( Walk-Forward Optimization , WFO). Plutôt que de s'appuyer sur des entrées statiques qui se dégradent lorsque les régimes de marché changent, l'indicateur recalibre dynamiquement ses paramètres en utilisant une validation hors échantillon ( Out-of-Sample , OOS), garantissant ainsi que les signaux affi
Zain Gold Scalping
Ahmed Gamal Abdel Nasser Mohamed
A complete price-action analysis tool built around dual independent entry logic, each confirmed against a volatility band, combined with a configurable set of nine optional confirmation filters that let you shape exactly how conservative or aggressive the tool's signals behave. Core Strategy Two independent entry setups, each triggering only when price moves outside a dynamic volatility band — giving two distinct ways to spot potential reversal points, which can be used together or separately.
Tokyo mt5 Indicator
Vasiliy Strukov
5 (14)
Le Tokyo Indicator offre une vue d'ensemble visuelle et claire de l'orientation de la tendance, des signaux de trading potentiels et des conditions du marché. Sa ligne de tendance en escalier, codée par couleur, distingue les phases haussières (en bleu) des phases baissières (en magenta). Des flèches directionnelles associées mettent en évidence les opportunités d'achat et de vente potentielles lors des changements de tendance. Un tableau de bord intégré regroupe le signal actuel, l'orientation
FiboSniper Pro
Van Minh Nguyen
5 (4)
FiboSniper Pro – Multi-Filter Fibonacci System with Auto SL/TP and Control Panel FiboSniper Pro est un indicateur technique qui combine des Fibonacci Envelopes dynamiques avec plusieurs filtres de confirmation afin de générer des signaux Buy et Sell sélectionnés. Les niveaux de Fibonacci sont calculés à partir de Moving Average et ATR, puis filtrés par ADX, EMA, RSI, ATR, Volume, Time et la structure des bougies. L’indicateur affiche directement sur le graphique les niveaux automatiques de Stop
Quantum TrendPulse
Bogdan Ion Puscasu
5 (26)
Présentation de   Quantum TrendPulse   , l'outil de trading ultime qui combine la puissance de   SuperTrend   ,   RSI   et   Stochastic   dans un seul indicateur complet pour maximiser votre potentiel de trading. Conçu pour les traders qui recherchent précision et efficacité, cet indicateur vous aide à identifier les tendances du marché, les changements de dynamique et les points d'entrée et de sortie optimaux en toute confiance. Caractéristiques principales : Intégration SuperTrend :   suivez f
Superhero
Ihor Otkydach
5 (3)
L'indicateur SUPERHERO est un système de trading multidevises conçu selon un principe « tout compris ». Cet indicateur analyse le marché de manière autonome et fournit des signaux indiquant quand ouvrir et clôturer des positions. Il utilise des ordres Stop Loss et Take Profit. Le rapport R:R est de 1:1. Ce système peut envoyer des notifications push sur votre smartphone, ce qui vous permet de passer des ordres « où que vous soyez », sans avoir à rester devant un ordinateur. C'est la solution idé
Indicateur de force et de momentum multi-devises MT5 Dynamic Forex28 Navigator est l'évolution de nos indicateurs populaires de longue date et réunit la puissance de trois outils en un : Advanced Currency Strength28 Indicator (700 avis) Advanced Currency IMPULSE with ALERT (530 avis) CS28 Combo Signals (bonus actuel) Les deux indicateurs précédents totalisent plus de 1 200 avis sur le MQL5 Market et font partie des outils incontournables de la communauté MT4 depuis 2016. Dynamic Forex28 Navigato
Trend Catcher ind mt5
Ramil Minniakhmetov
5 (18)
INDICATEUR DE DÉTECTEUR DE TENDANCE L'indicateur de détecteur de tendance analyse les mouvements de prix du marché grâce à une combinaison d'indicateurs d'analyse de tendance adaptatifs, propriétaires et personnalisés. Il identifie la véritable direction du marché en filtrant les fluctuations à court terme et en se concentrant sur la force de la dynamique sous-jacente, l'expansion de la volatilité et la structure des prix. Il utilise également une combinaison d'indicateurs personnalisés de lis
Apex Patterns PRO Achetez l'indicateur - Obtenez GRATUITEMENT l'Expert Advisor basé sur celui-ci. Intelligence auto-optimisée des figures chartistes et des cassures Les scanners de figures traditionnels s'appuient sur des paramètres fixes, sous-performant souvent lorsque la volatilité et les structures du marché changent. Apex Patterns PRO est conçu pour s'adapter aux conditions changeantes du marché en combinant la reconnaissance des figures chartistes structurelles, le filtrage du momentum et
Neuro Poseidon MT5
Daria Rezueva
4.68 (53)
Neuro Poseidon is a new indicator by Daria Rezueva. It combines precise trading signals with adaptive TP/SL levels - creating best possible trades as a result! Message me and get  Neuro Poseidon Assistant  as a gift to automize your trading process! What makes it stand out? 1. Proven profitability on all assets and timeframes 2. Only confirmed BUY and SELL signals present on the chart 3. Adaptive TP & SL levels generated by the software for each trade 4. Easy to understand - suitable for al
Crystal Heikin Ashi Signals
Muhammad Jawad Shabir
5 (5)
Crystal Heikin Ashi Signals—Professional Trend & Signal Detection Indicator Advanced Heikin Ashi Visualization with Intelligent Signal System for Manual & Automated Trading Final Price: $149 ---------> Price goes up $10 after every 10 sales . Limited slots available — act fast . Overview User Guide PDF Crystal Heikin Ashi Signals is a professional-grade MetaTrader 5 indicator that combines pure Heikin Ashi candle visualization with an advanced momentum-shift detection system. Designed for both m
Plus de l'auteur
Draggable Volume Profile
Basharat Umar Khan
5 (1)
Short Description Drag two lines to any chart range for an instant Fixed-Range Volume Profile (POC, Value Area VAH/VAL) featuring Delta Coloring, Developing Profile tracking, Initial Balance, HVN/LVN, and Retest Rays. Detailed Description The Fixed-Range Volume Profile & Delta Analyzer answers a foundational market structure question: At which price did the most trading activity actually occur within a specific timeframe? Simply drag the two vertical reference lines ( START and END ) anywhere o
FREE
Session Profiles
Basharat Umar Khan
Short Description Draws rolling Time-Price-Opportunity (TPO) and footprint volume profiles for the Asia, London, and New York sessions with POC/VAH/VAL levels, delta volume bias, order flow overlays, liquidity heatmaps, developing rolling lines, Naked POC (NPOC) tracking, Initial Balance breakouts, multi-session confluence zones, and automatic broker GMT-offset detection. Full Description Plots separate market-profile and volume-profile style histograms for the three major trading sessions (Asi
FREE
Short description: Automatically detects bullish and bearish Order Blocks from volume-pivot analysis and draws them as clean, flicker-free boxes with an average price line. Full description Overview OrderBlockDetector locates institutional Order Blocks — the last opposing candle before a strong volume-driven move — using a volume-pivot algorithm instead of simple candle-pattern heuristics. Each detected block is drawn as a shaded zone with a border and a midline (average price), and is automati
FREE
Short description   Right-anchored, flicker-free Volume Profile with POC/VAH/VAL lines, tick-throttled updates, and zero measurable lag even on fast, high-volume symbols. Full description Anchored Volume Profile draws a fixed-range volume histogram from a chosen start date through to the live, forming bar — pinned to the right edge of your chart like the panels in TradingView, and built to stay smooth even on fast-moving, high-tick-volume symbols. KEY FEATURES - Fixed-range profile anchored to a
FREE
Short description GBPUSD Gamma Exposure (GEX) Profile from CME B6 Options — Call Wall, Put Wall & Zero-Gamma Flip, Live on Chart Reads a Barchart CME British Pound (B6) options CSV, solves Black-76 implied volatility per strike, and renders a right-anchored dealer GEX profile directly on your GBPUSD chart — with continuously updating Call Wall, Put Wall, and Zero-Gamma flip levels. Full description See where dealer hedging flow is likely to pin, accelerate, or reverse price — before it happens.
FREE
PriceLevels HTF
Basharat Umar Khan
Short description: A higher-timeframe round-number grid for major Forex pairs — major whole-number levels, monthly midpoints, and quarter levels (with optional eighths), spanning a wide configurable pip range. Built for H4 and above. Full description: Plots a large-scale psychological-level grid across whole numbers, half-levels, and quarters — the higher-timeframe counterpart to intraday round-number analysis. Designed for swing and position-level context on H4 and above , not for scalping time
FREE
Volume Zone Analyzer — VSA-Based Volume, Delta & Spread Reader Turn any price zone into a Volume Spread Analysis. Drop two draggable lines on your chart to mark a Zone Start and Zone End , and Volume Zone Analyzer instantly breaks down what happened inside that zone: Total Volume for the selected range Buy / Sell Delta — estimated from where each candle closes within its own high-low range Delta % with a visual buy/sell ratio bar Average Spread , plus a count of wide vs. narrow-spread candles (t
FREE
HTF Open Markers + ICT Silver Bullet Zones — Usage & Strategy Guide What it draws Session 1 / Session 2 lines : vertical lines at the open of every bar on two independently configurable higher timeframes (defaults: H4 and D1), including a projected line for the rest of today's not-yet-opened bars on sub-daily timeframes, so you can see where the next candle will open before it happens. ICT Silver Bullet zones : shaded rectangles over the three classic ICT kill-zone windows, converted from New Yo
FREE
Short description Plots a repeating grid of round-dollar levels on ETHUSD — labeled Wall / Hot Zone / Exit / Trap by their typical institutional role — tuned for lower timeframes (M1 through H1). Full description Draws horizontal reference lines at 10 intervals around the current ETHUSD price, based on the idea that round-dollar levels (multiples of $100, and near-round levels like $X20/ X80, $X50, $X10/$X90) tend to act as psychological reaction zones where liquidity and stop-hunts commonly clu
FREE
Fx Gamma Profile
Basharat Umar Khan
Fx Gamma Profile - see where the options market is positioned, directly on your MetaTrader 5 chart. Fx Gamma Profile turns an options-chain file into a gamma-exposure (GEX) map and draws it beside price: a bar for every strike, the call wall, the put wall and the zero-gamma level, plus a status panel that explains in plain words what the numbers imply. It is a decision-support tool for discretionary traders who want options-market context for FX pairs. READ BEFORE YOU BUY - THIS INDICATOR NEE
Filtrer:
Aucun avis
Répondre à l'avis