Quantum Volumes Profiles

Quantum Volumes Profiles

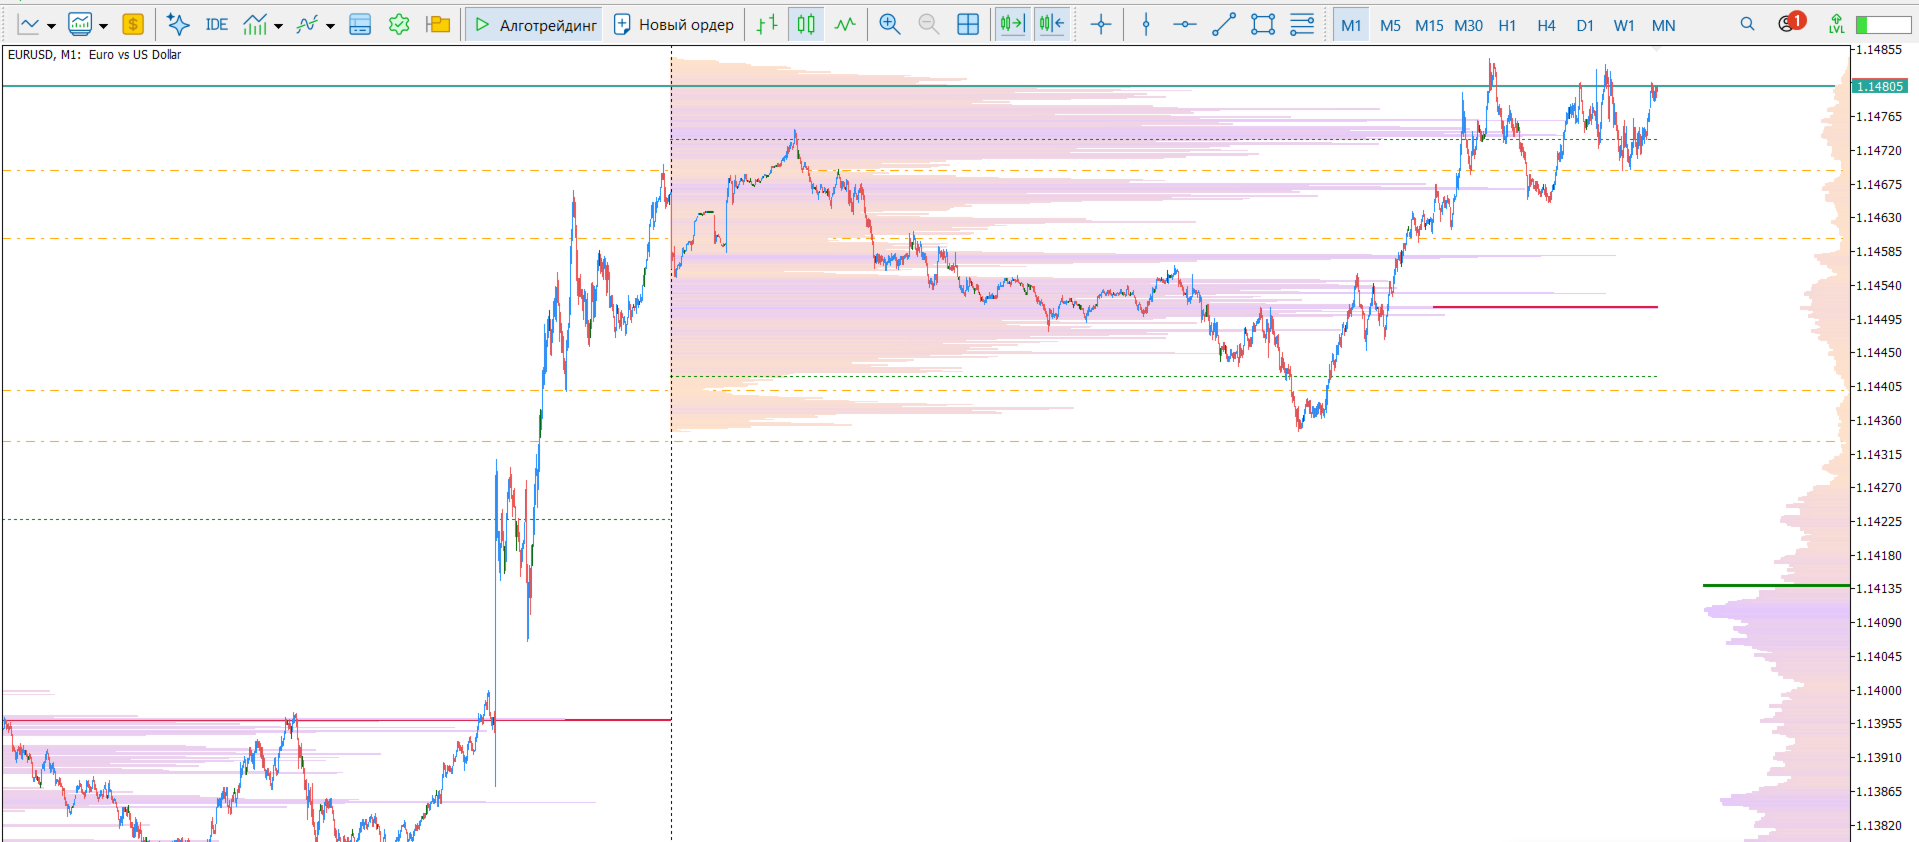
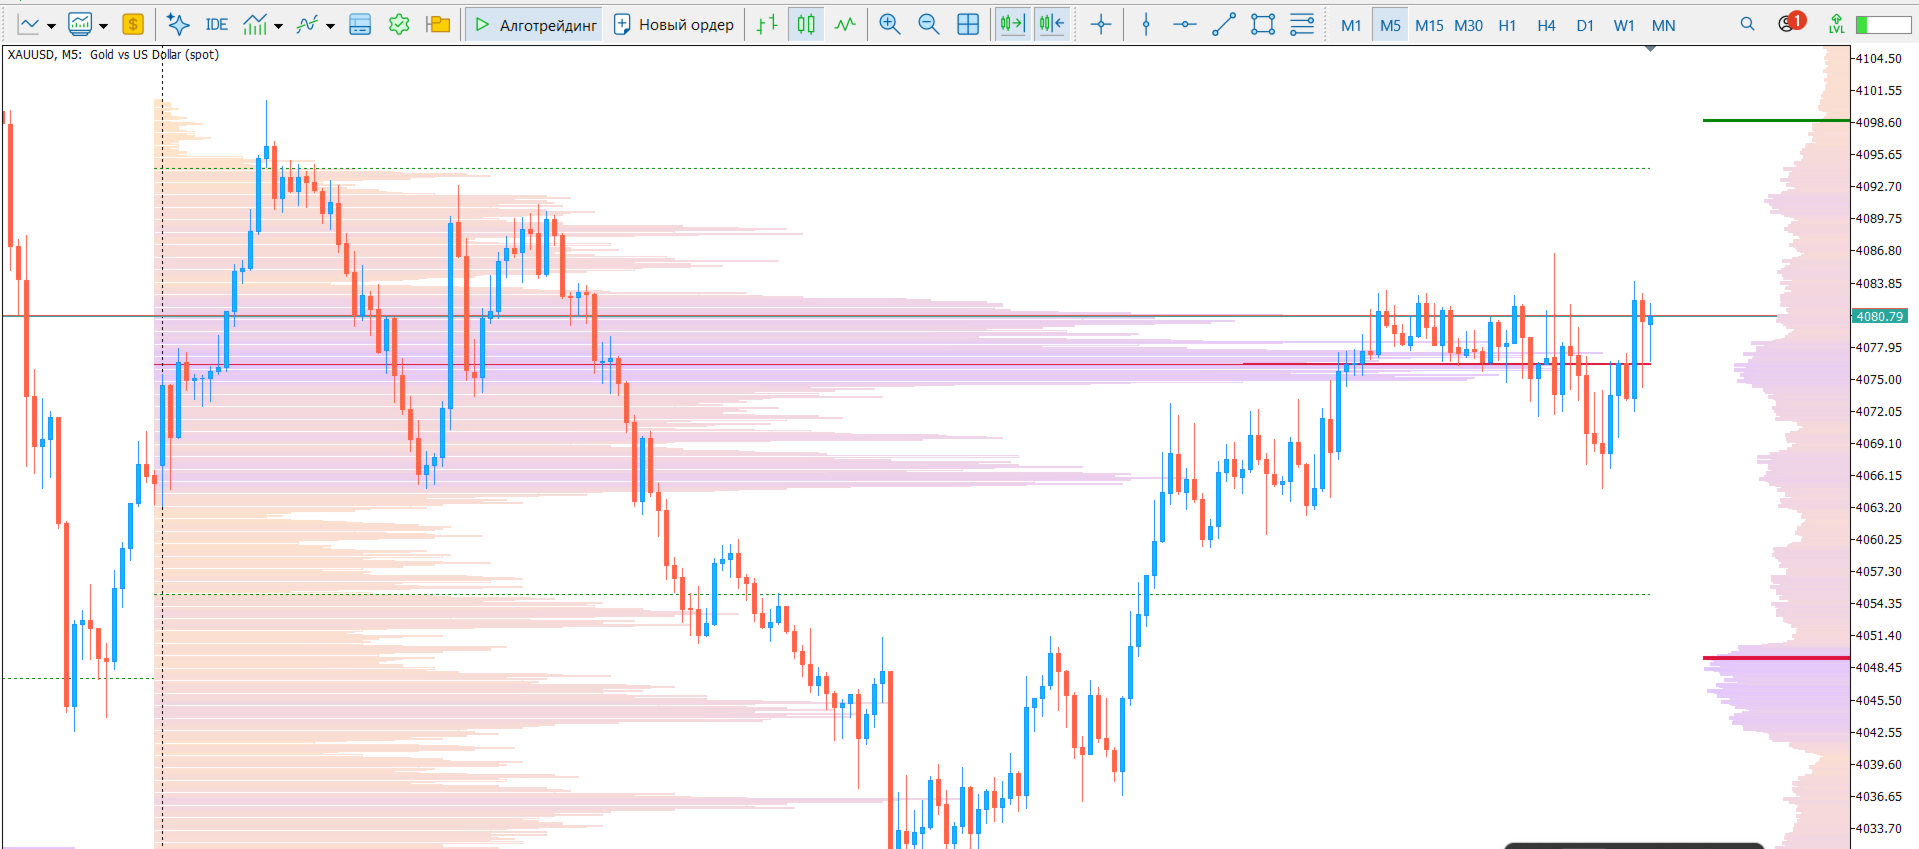
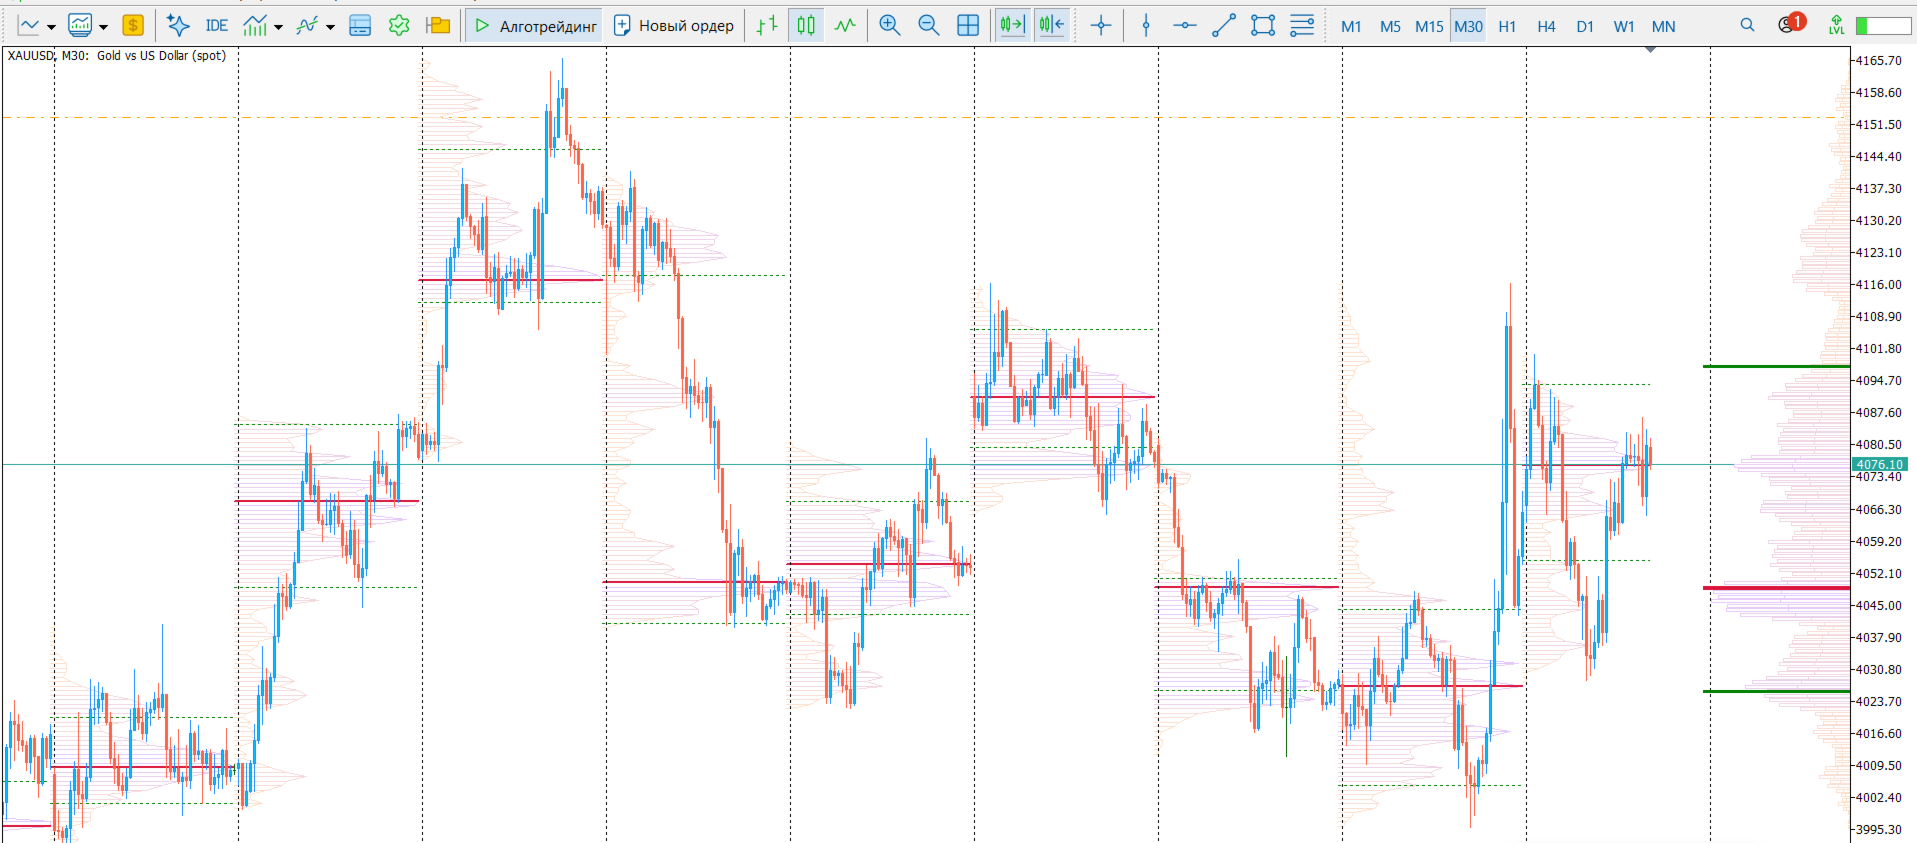
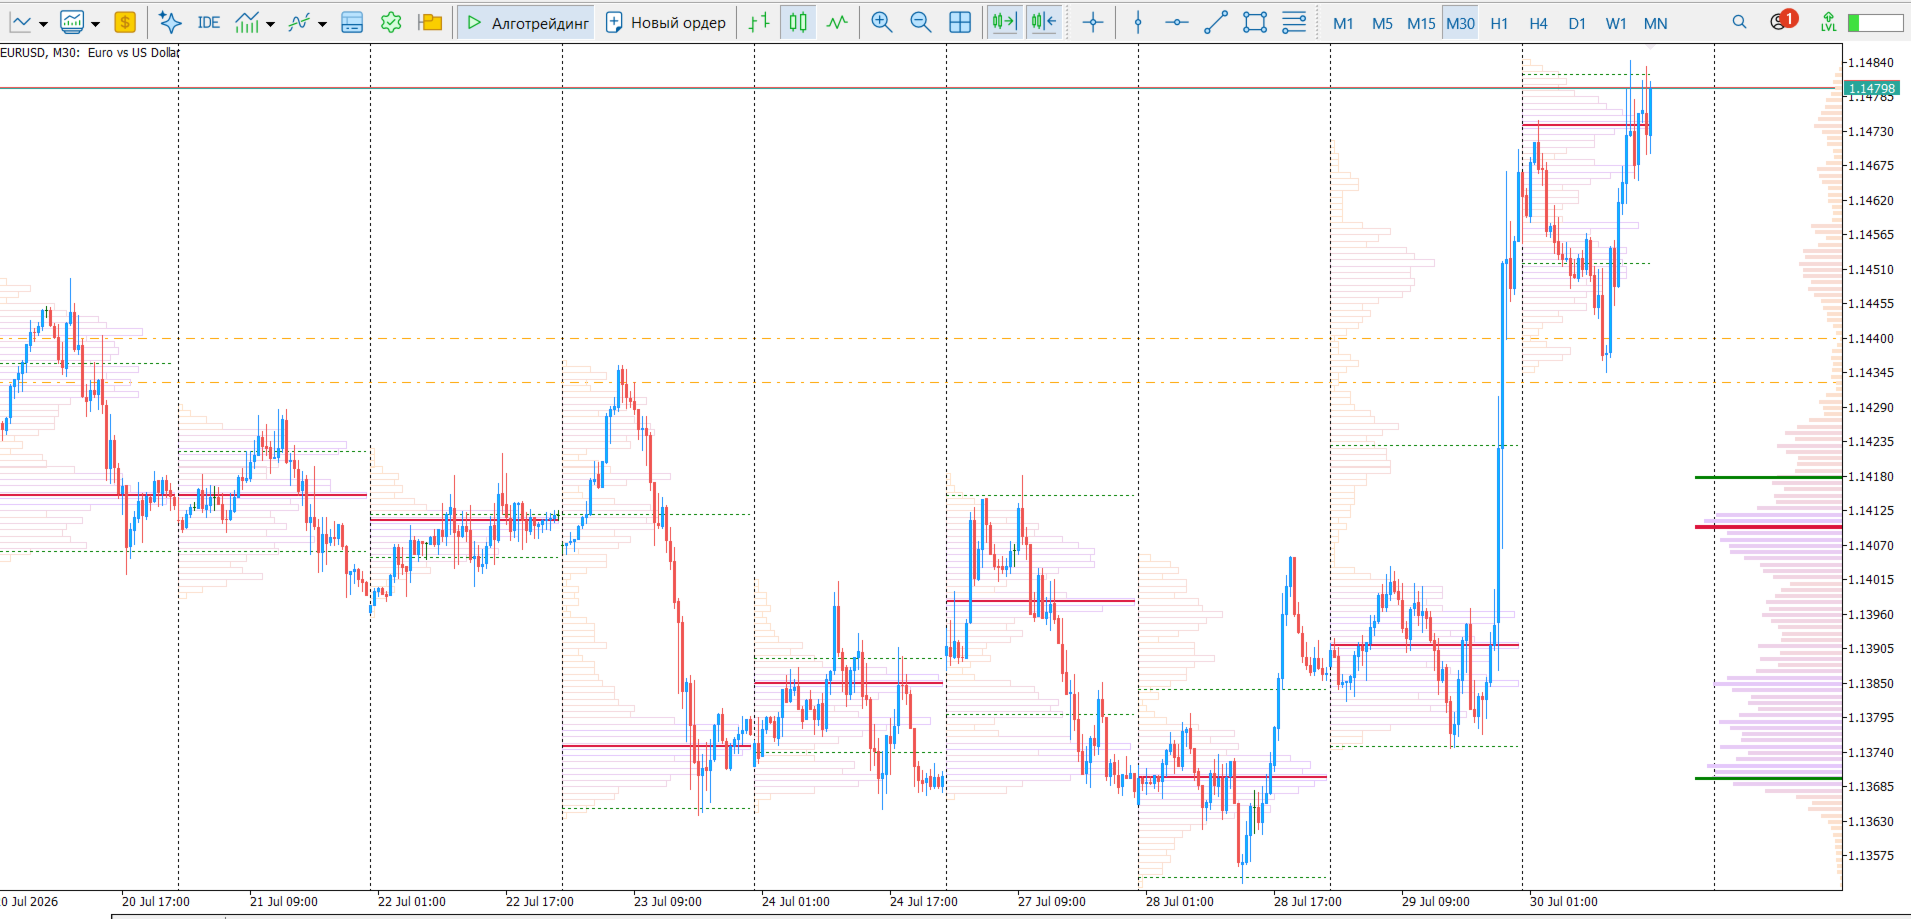
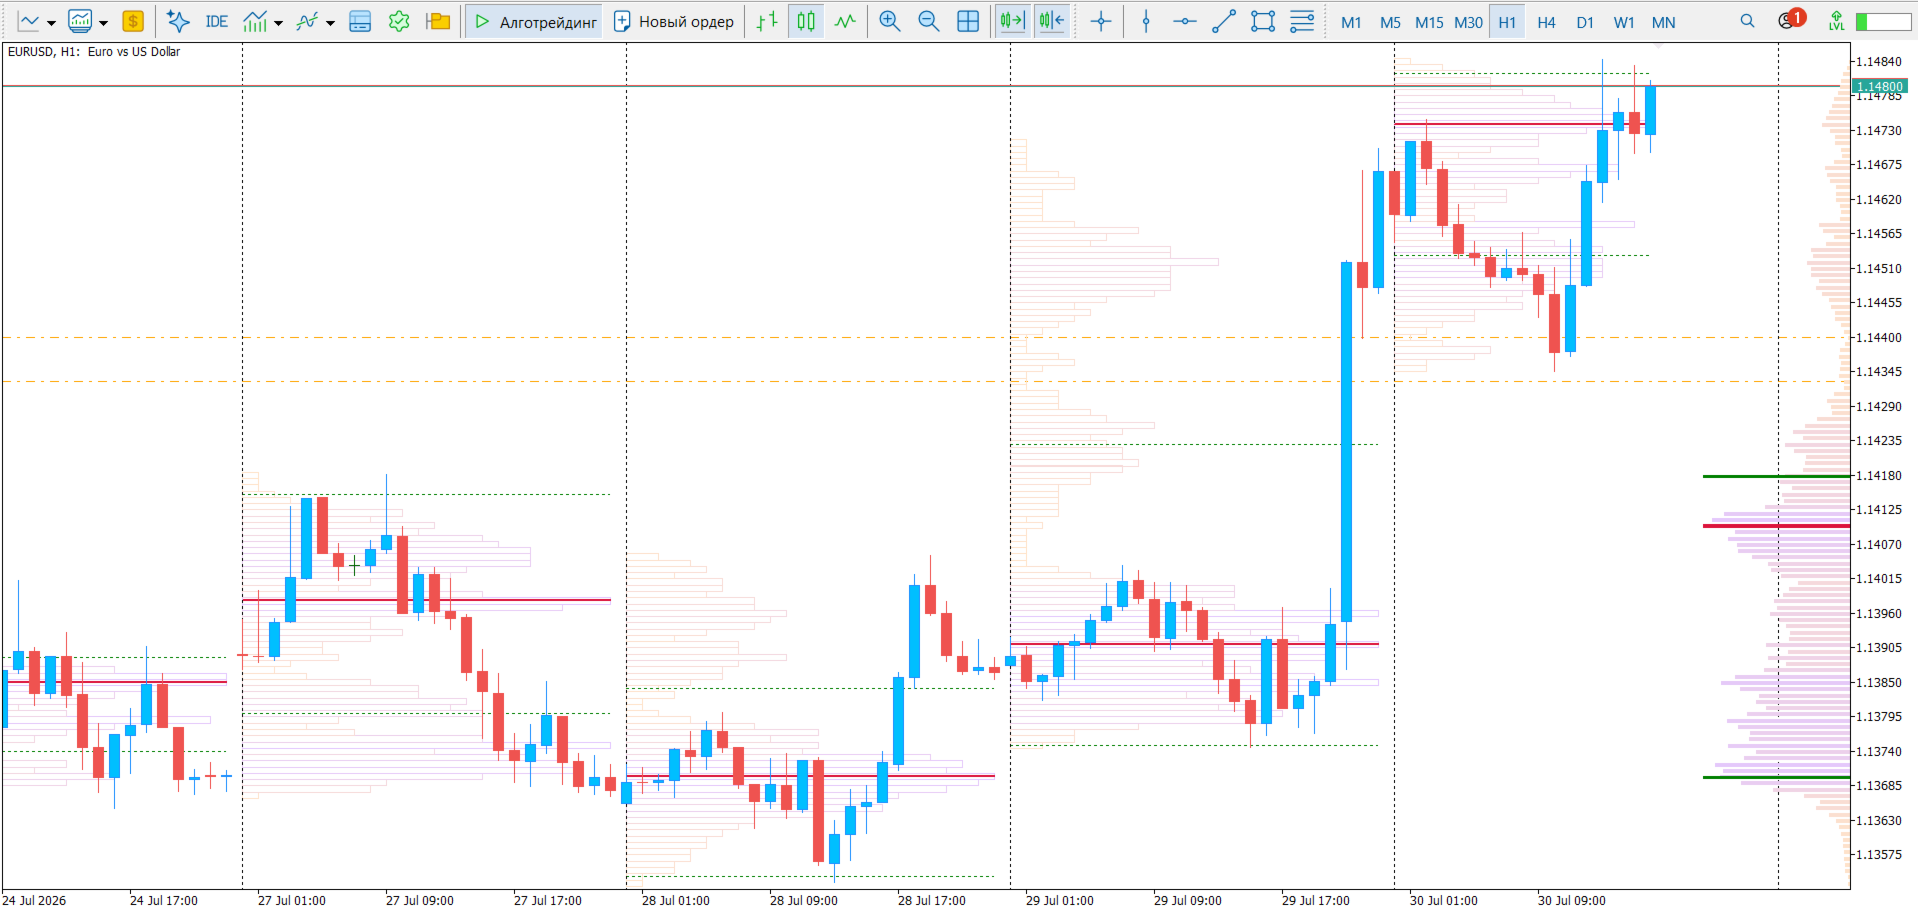
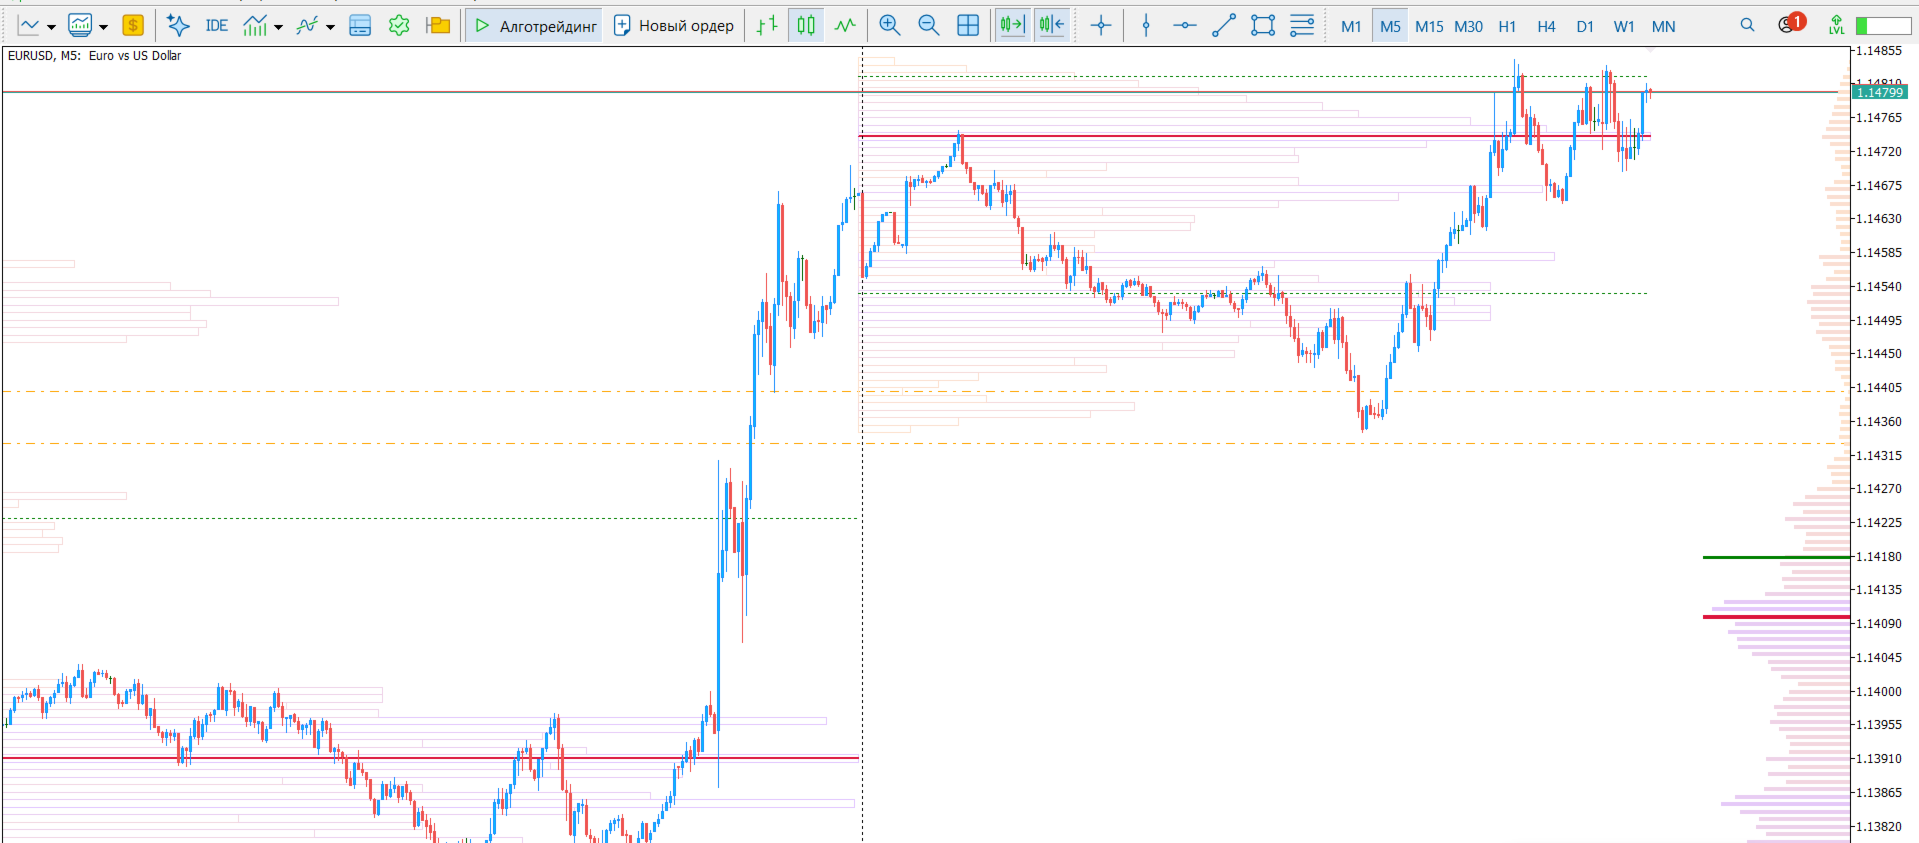
Quantum Volumes Profiles is a professional volume analysis indicator for MetaTrader 5 designed to identify key price levels, reveal areas of institutional interest, and provide a clear understanding of volume distribution within any selected trading range.

The indicator combines two of the most powerful volume analysis tools into a single product:

  • Global Volume Profile – displays volume distribution over a user-defined historical period.
  • Session Volume Profile – shows the volume profile for the current trading session or any selected session range.

This combination allows traders to analyze both the long-term market structure and the current session simultaneously, making it easier to identify where significant trading activity is concentrated.

Supports Both Tick and Real Volumes

Quantum Volumes Profiles works with two different volume sources:

  • Tick Volume – available with virtually every Forex broker and suitable for most trading instruments.
  • Real Volume – supported whenever your broker provides exchange-traded volume data.

This flexibility allows the indicator to be used across virtually any market while taking full advantage of real exchange volume whenever it is available.

What the Indicator Shows

Quantum Volumes Profiles helps traders identify:

✔ High-volume price areas (areas of strong market interest)

✔ Accumulation and distribution zones

✔ Strong support and resistance levels

✔ Price levels where reversals are most likely

✔ Areas where the market spent the most trading activity

✔ High-probability continuation and reversal zones

Unlike traditional technical indicators that focus only on price movement, Quantum Volumes Profiles reveals the true volume interest across the analyzed range, helping traders understand where buyers and sellers were actually most active.

Main Features

  • Global Volume Profile
  • Session Volume Profile
  • Supports Tick Volume
  • Supports Real Volume (when provided by the broker)
  • Automatic Point of Control (POC) calculation
  • Automatic Value Area (VAH/VAL) calculation
  • Adjustable profile width
  • Multiple display styles
  • Fully customizable colors
  • High-performance rendering engine
  • Optimized calculation algorithms
  • Smooth operation even with large historical datasets
  • Stable display during chart zooming and scaling

Who Is It For?

Quantum Volumes Profiles is an excellent tool for traders using:

  • Price Action
  • Smart Money Concept (SMC)
  • ICT
  • Volume Trading
  • Order Flow
  • Support & Resistance trading
  • Intraday trading
  • Swing trading

Supported Markets

The indicator can be used on virtually any financial instrument, including:

  • Forex
  • Gold (XAUUSD)
  • Silver
  • Stock Indices
  • Crude Oil
  • Stocks
  • Futures
  • Cryptocurrencies

Why Choose Quantum Volumes Profiles?

Unlike many similar indicators, Quantum Volumes Profiles is designed with both accuracy and performance in mind. Its optimized algorithms process large amounts of historical data efficiently, allowing smooth operation even when building extensive Global Volume Profiles.

If you are looking for a fast, reliable, and feature-rich volume analysis tool that combines Global and Session Volume Profiles in one indicator while supporting both Tick Volume and Real Volume, Quantum Volumes Profiles will become an essential part of your trading toolbox.
推荐产品
FFXMV Forex Dashboard Indicator MT5
Opengates Success International
FULL FOREX MARKET VIEW 仪表盘指标 MT5 这是一个为 MT5 平台开发的自定义指标,旨在为交易者提供对市场的全面了解。它使用实时数据来分析市场,并显示成功交易所需的所有信息。 安装: 在将此指标附加到图表窗口之前,请进入 MT5 的“市场报价”面板,隐藏所有不需要或不交易的货币对,只保留你交易的那些。原因是 FFMV 仪表盘会显示 MT5 市场报价中的所有货币对,最多可显示 26 种。如果超过 26 种,FFMV 仪表盘上的字体和图像会变得模糊并失真!将无法正确显示。 用途: 单一交易 组合交易(请参阅截图) 也可用于多订单交易 用于确认来自你交易系统的信号等 组件: 时间框架:从 M1 到 MN1 当前蜡烛状态(买/卖) 趋势:货币整体趋势 影响:货币波动的幅度/波动性(见下): Build-up: 货币刚开始形成趋势 Good: 货币走势逐渐增强 High: 值得关注 Strong: 方向应予以考虑 Very strong: 接近完美 Excellent: 信号达到最佳,可以交易 变化:货币横盘、上涨或下跌 评级:交易可靠性 如何使用仪表盘: 所有时间框架从
Fixed Volume Profile
Carlos Pascual Perez Maturano
This indicator, titled "Fixed Volume Profile.mq5", is a custom tool for MetaTrader 5 (MQL5) designed to calculate and display a Volume Profile over a user-defined fixed time range. The Volume Profile shows the distribution of trading volume at different price levels during a specific period, helping to identify areas of high activity (such as Points of Control or POCs) and volume-based support/resistance areas. Main Functionality: Interactive Range: The indicator creates two vertical lines on
FREE
Volume Data on Candles Indicator for MetaTrader 5 Maximize your trading insights with the Volume Data on Candles indicator for MetaTrader 5. This powerful tool provides real-time volume data directly on each candle, allowing you to identify significant shifts in market activity. When the volume of a candle exceeds the average of the last 50 candles, it will be clearly highlighted , ensuring you don't miss out on potential high-volume movements. Key Features: Real-Time Volume Data : Displays volu
FREE
UGenesys Volume MT5
Odaine Ramon Mcmillan
50% Off Today Only! Price Goes Back Up at 11 PM (EST) uGenesys Volume Indicator: Your Key to Mastering Market Volume Analysis What Traders Are Saying: "A must-have indicator...really a game-changer." – wuzzy66 "Amazing indicator...strongly recommend to beginners." – joinbehar Understanding Market Volume:   Volume in the market is a critical indicator of movement and opportunity. The uGenesys Volume Indicator is specially crafted to pinpoint when the market has the most volume, allowing you to
X Sensors Pro
Igor Nagorniuk
X Sensors Pro 是一个专业的成交量轮廓指标,可在选定周期内可视化交易成交量在价格水平上的分布情况。该指标自动识别局部极值点(HH 和 LL),计算控制点(POC)——成交量最大的价位,并根据识别出的范围构建支撑位和阻力位。 主要功能: 以彩色直方图形式可视化成交量轮廓 自动检测 POC(控制点) 构建 HH(更高高点)和 LL(更低低点)水平线 计算枢轴点及多重支撑/阻力位 看涨(绿色)和看跌(红色)成交量的颜色指示 自适应调整适用于任何时间周期 该指标有何用途? 该指标解决交易者的以下任务: 1. 识别积累和分布区域 成交量总是集中在大户进入或退出市场的位置。POC 显示交易量最大的价格——这是一个心理上重要的水平。 2. 寻找公允价值 POC 通常被视为"公允价值"——市场在其周围花费最多时间的水平。 3. 识别支撑位和阻力位 水平成交量构成价格的自然屏障。某一水平的成交量越大,该水平就越重要。 4. 确认趋势 如果价格高于 POC 且成交量向上倾斜,则趋势强劲。如果价格低于 POC 且成交量为红色,则趋势看跌。 5. 突破或反弹交易 交易者使用 PO
The indicator calculates ZigZag using the classic algorithm with three parameters: Depth, Deviation, and Backstep. Its main function is detecting and visualizing repaints — moments when the last ZigZag point shifts to a new bar. Upon loading, the indicator performs a simulation over the specified history depth. The algorithm sequentially recalculates ZigZag for each bar, comparing the current position of the last point with the previous one. If a shift is detected, a repaint line appears on the
FREE
Atlantis Pro
Mohammed Jebbar
Atlantis Pro 指标 — 逐笔数据精准分析与组合化交易优势 Atlantis Pro 指标是一款先进的多功能工具,基于实时逐笔行情数据,精准捕捉关键价格水平和高概率反转区域。它会持续分析每一笔成交,敏锐识别买卖力量的关键变化,并在图表上即时显示清晰的买入/卖出箭头 — 默认可见,随时准备执行。 Atlantis Pro 适用于 任何时间周期和任何资产 ,包括外汇、股票、商品、指数及加密货币。但它真正的强大之处在于可同时在多个品种上使用:交易者可以同步监控多个标的的最佳进出场信号,构建 多样化的投资组合 ,有效降低风险,提升收益稳定性。 借助 Atlantis Pro,您不再局限于单一图表或单一资产 — 同时捕捉相关或非相关市场的信号,自然对冲头寸,平滑收益波动。这种多标的能力有助于锁定更精准的组合利润,在市场波动中保持持续稳定的收益。 无论是短线剥头皮、波段交易,还是中长期布局,Atlantis Pro 都能提供可执行、实时的精准信号,增强交易者的决策信心。 核心功能: ️ 逐笔数据处理,信号更精准 ️ 买卖箭头默认显示,清晰明了 ️ 适用于任何时间周期与品种 ️
Title: Smart VP: Buy/Sell Bars + POC Description: Enhance your trading with the Right Anchored Volume Profile. Visualize buy and sell volumes per price level with near-bar numbers and identify the Point of Control (POC) instantly. Perfect for traders who want clear market structure at a glance. Features: Right Anchored Volume Profile Buy/Sell volume bars Near-bar volume numbers POC (Point of Control) line Customizable colors and display settings
RITZ QUANTUM PULSE Next-Generation Economic Intelligence System Ritz Quantum Pulse — Next-Gen Economic Intelligence System. Experience quantum-level precision in news trading: real-time event detection, AI-powered filtering, and temporal synchronization. Anticipate volatility before it happens — not after. Where Market Intelligence meets Temporal Physics. Ritz Quantum Pulse   represents the convergence of   quantum logic ,   AI-driven analytics , and   real-time economic intelligence . This is
FREE
Poc volume honeyflow
Ali Abdalrasool Ai-sayyd Sobai
POC Highlighter - Volume Profile Indicator This indicator displays the Volume Profile and clearly marks the Point of Control (POC) with a prominent yellow horizontal line. The POC represents the price level with the highest traded volume within the visible chart range or selected period. Key Features: - Automatic calculation and display of Volume Profile histogram at the right side of the chart. - Highlights the POC level with a customizable yellow line (default: solid yellow). - Adjustable p
GoldenX Entry MT5
Kareem Abbas
5 (16)
GoldenX Entry 是一款用于 MT5 的指标,包含自适应 Smart Entry Trend 算法、信号评分系统、市场状态识别器以及波动率过滤器。每个信号都包含计算得出的入场位、三个止盈位(TP1、TP2、TP3)以及止损位。它基于多个分析层构建,旨在适应不同市场条件,将多层分析系统与内置优化器及统计跟踪系统相结合。该指标基于风险收益比(RR)指标和历史交易行为提供量化分析。 开始使用非常简单——在所选时间周期上运行优化器,然后在图表上开始使用该指标。 核心功能 GoldenX Entry 将信号引擎与内置交易管理及历史统计跟踪整合在同一图表中: - 内置优化器: 优化器可在图表上单击运行。它通过两阶段搜索流程测试200种参数组合——先进行探索,再进行优化——并在完成后自动应用选定配置。结果会按时间周期缓存,因此当返回已优化的周期时,会立即恢复相同设置。 - 黄金品种自动周期识别: 将指标加载到任何 XAUUSD 图表(M1 到月线)。系统会自动识别当前周期并加载对应预设。共包含9个时间周期配置文件,专为黄金在标准周期上优化设计。切换周期时,参数会自动调整。 - 资金参考面
ClaroFxAlgo Candle Countdown Timer – MetaTrader 5 Indicator Overview CandleCountdownTimer is a powerful yet lightweight MT5 indicator that displays dynamic countdowns to the next candle close, helping traders gain precise timing awareness across all timeframes. Its sleek, customizable design ensures critical timing data is visible—without cluttering your charts. Key Features ️ Main Timer Display – Live countdown to the next candle close on current timeframe Multi-Timeframe Panel – View
FREE
Horizontal Volumes
Vitalii Zakharuk
Horizontal Volumes Indicator - using a histogram, displays the volume of transactions at a certain price without reference to time. At the same time, the histogram appears directly in the terminal window, and each column of the volume is easily correlated with the quote value of the currency pair. The indicator practically does not require changing the settings, and if desired, any trader can figure them out. The volume of transactions is of great importance in exchange trading, usually an inc
A Market Profile (time price opportunity) implementation with an option to mark a point of control (POC) based on   volume   . Config: Hide default candles. Select a session time using exchange timezone. Experiment with tick multiplier value to achieve desired level of detail. Choose the symbols of your choice, e.g. squares or A-Z chars. For multiple sessions you will have to add additional instances of this script with a different time configuration. Limitations: TradingView has a hard limi
Algo Trading Indicaor MT5 The ATC ALGO indicator has been developed to work on the MetaTrader 5 platform. It has the same specifications and zones as the MetaTrader 4 version. There may be slight lag, which we believe is due to differences in MetaTrader 5 programming. We will work on improving it, God willing. MT5 Version                    https://www.mql5.com/en/market/product/170028 MT4 Version                    https://www.mql5.com/en/market/product/88034 With this indicator , you’ll have
MT5 Trade Manager
Anthony Dewayne Wasome
MT5 Trade Manager is a MetaTrader 5 trade management panel designed to provide order execution, position monitoring, and risk control tools within a single interface. It operates as an on-chart dashboard with multiple pages for different trading functions. The tool is designed to support manual trading by centralizing trade operations and account monitoring in one place without requiring external applications. Interface Structure The dashboard is organized into six main sections: Dashboard Provi
FREE
Here   our more valuable tools SMC Trend Trading   ,  Easy SMC Trading  ,  Institutional SMC Architect Volume Analysis Tools  ,  Volume flow Profile  ,  Market volume profile  , FVG with Volume  , Liquidity Heatmap Profile  ,  Volume Spread Analysis Short Description: Stop overloading your charts with dozens of indicators.   Bollinger Fibo  Pro   is a sophisticated, all-in-one trading system for MetaTrader 5 that merges two legendary concepts into a single, powerful tool. It enhances standard
CONTACT AND SUPPORT At TPFX, we understand that every trader has unique requirements and that efficiency is the key to success. Therefore, I cordially invite you to send me a private message regarding any questions, functional errors, or needs for personalized adjustments. I am committed to providing fast and decisive technical assistance, ensuring your tool is always in perfect condition. Personalized adjustments to adapt the system to your specific strategy can be made at no additional cost
PriceDensity
Andriy Sydoruk
PriceDensity – Professional Price Density Indicator for Accurate Market Level Detection PriceDensity   is a smart, non-volume-based indicator that analyzes historical price action to determine   key price levels with the highest frequency of occurrence . It automatically detects where the market has spent the most time – revealing hidden areas of support and resistance based on actual market behavior, not subjective drawing. This tool is ideal for traders using price action, support/resistance c
Basic Volume Profile MT5
Mehran Sepah Mansoor
使用我们的 Metatrader 交易量曲线指标,探索交易量分析的威力!  /   MT4 版本 基本成交量曲线是专为希望优化交易的手动交易者设计的指标。对于任何希望更好地了解市场行为的严肃交易者而言,成交量曲线指标都是必不可少的工具。利用我们的创新解决方案,您可以清晰、简明地直观了解交易量在不同价格间的分布情况。这样,您就可以确定关键的关注区域,如支撑位和阻力位、累积区和分布区以及重要的控制点。与显示特定日期交易量的普通交易量指标不同,Basic Volume Profile 显示的是特定价格的交易量。 我们的指标具有直观和可定制的界面,让您可以根据自己的交易偏好进行调整。 特点 在价格图表上清晰显示成交量概况。 快速识别高低成交量活动区域。 完全自定义颜色和样式,以适应您的交易风格。 支持多时段综合分析。 专门的技术支持,确保体验顺畅。 配置参数 指标设置 Number of histograms:   要显示的成交量条数 Profile position:     是否希望在第一根蜡烛或侧面显示成交量曲线 Color mode:     是否希望将成交量曲线分为看涨/看
With Fixed Range Volume Profile,The traces left by the big players will not go unnoticed by you. Professional   Volume Profile   Indicator reveals Institutional order flow. This advanced market indicator will teach you to spot the buying and selling. Dont want to say more because its well known by most professionals  trader. This Indicator : -  Quickly Identify the Strongest Institutional S/R Zones. - W orks with all Trading Instruments (Forex, Futures, Indexes, Commodities, Stocks, Cryptocurr
DMJ Magical AVWAP
Dominic Minguy Jean
Automated Anchored Volume Weighted Average Price You set a period, and the indicator will find the highest and lowest price point in the period and derive a AVWAP from there. It also prints out a median line. You can use the generated VWAP lines as a channel, as S/R levels or as a volatility indicator. It's based on tick volume to be compatible with most CFD brokers. Happy trading!
Kiobi
Firas Al-qasimi
KIOBI VISION KIOBI VISION is a multi-factor analysis indicator designed for professional traders who want a clear and structured view of the market across multiple time frames. Objective The indicator offers a unique summary table that combines several technical tools (RSI, MACD, Stochastics, Vortex, Momentum, PSAR, DMI, MFI, Fisher, and general trend) to provide reliable and quick-to-interpret buy and sell signals. Key Features Multi-timeframe analysis (M1 → MN): a consolidated view of the
Smart Volume Profile
Mattia Impicciatore
4.67 (12)
Smart Volume Profile 是一款专业的成交量分布指标,可以在实时图表中计算并显示两个垂直线之间的成交量分布,并带有买卖拆分功能,以及 POC、VAH、VAL 水平。该工具既适用于主观交易,也适用于系统化交易,帮助您了解市场在哪些价格区间交易最活跃,以及买卖压力在所选区间内是如何分布的。 为什么选择这个指标 完全控制分析周期 —— 通过两条可拖动的垂直线(VLINE)来自定义区间。 买卖拆分 —— 不同颜色清晰显示买方或卖方的主导力量。 机构级别的 POC VAH VAL —— 清晰绘制并实时更新。 性能优化 —— 使用真实 tick 数据,当无可用交易 tick 时采用智能回退模式。 自适应显示 —— 轮廓宽度与图表窗口比例匹配,保证最佳可读性。 工作原理 绘制两条名为 VP begin 和 VP finish 的垂直线来限定时间区间。指标将成交量按价格划分为可配置数量的垂直区间(bucket)。如果有交易 tick 数据,则将每笔成交分类为买单或卖单;否则使用基于 K 线的分布并带有可配置的偏移。 POC 是成交量最大的价格水平,而 VAH 和 VAL 会扩展围绕 P
FREE
BookMap HeatMap
Roberto Spadim
1 (2)
This Indicator creates a heatmap based on depth of market of the current symbol or another symbol. Other symbol is useful when you trade futures market and a contract has 'mini' and 'full' split. For example, in Brazil (B3 - BMF&Bovespa), WDO and DOL are future Forex contract of BRL/USD (where 1 DOL = 5 WDO) and big banks work mostly with DOL (where liquidity is important). Please use with M1 timeframe , objects are too small to be displayed at higher timeframes (MT5 limit). The number of level
N/B: All our product purchase comes with our free ‘’DAILY   SCALPER EA’’ Whatsapp Developer for yours after successful purchase   THE ARCHITECTURE OF A PERFECT TRADING SYSTEM Let me break down how all the components in this Ultimate Semafor system work together like a Swiss watch mechanism. This is a multi-layered confirmation system where each piece validates the others.   SYSTEM PHILOSOPHY: "TRIPLE CONFIRMATION" This system follows a simple but powerful principle: No single indicator can
Please feel free to leave an honest review after downloading so that I can continuously improve the indicator—thank you! AUREVYNE Session Liquidity See where session liquidity is resting — and recognize when it gets swept. AUREVYNE Session Liquidity is a clean and focused MT5 indicator designed to visualize the most important liquidity levels of the Asia and London sessions. The indicator automatically displays session highs and lows, monitors their current state and marks confirmed liquidit
FREE
Identify where the "Big Players" are positioned. The Sniper POC Tracker is a professional-grade Volume Profile indicator designed to reveal the Point of Control (POC)—the price level where the most volume has been traded. In SMC trading, the POC acts as a magnetic zone for liquidity and a critical level for institutional decision-making. Key Features: Dynamic POC Tracking: Real-time calculation of the most significant volume level based on a custom lookback period. Institutional Insight: Visuali
BoxChart MT5
Evgeny Shevtsov
5 (7)
The market is unfair if only because 10% of participants manage 90% of funds. An ordinary trader has slim changes to stand against these "vultures". This problem can be solved. You just need to be among these 10%, learn to predict their intentions and move with them. Volume is the only preemptive factor that faultlessly works on any timeframe and symbol. First, the volume appears and is accumulated, and only then the price moves. The price moves from one volume to another. Areas of volume accumu
AUC SR Clusters
Alfonso Urbano Cardenas
AUC - S&R Clusters   是一个基于价格行为分析,用于识别支撑位和阻力位区域的指标。 该指标使用历史数据来检测价格多次发生交互的区域,并根据这些信息将相近水平分组为区域。 与固定水平不同,该指标会根据市场变化调整这些区域,从而帮助观察价格结构中的关键位置。 --------------------------------------------- 工作原理 该指标持续分析: K线历史 价格交互区域 基于历史数据的水平间距 基于这些信息: 将相近水平分组为定义区域 减少不太重要的水平 显示价格曾经活跃的区域 ------------------------------------------------- 特点 自动识别支撑和阻力区域 水平分组为区域 基于历史数据进行调整 图表中清晰显示区域 支持多时间周期和多种交易品种 说明 该指标仅作为分析辅助工具,不替代风险管理或用户决策。
FREE
该产品的买家也购买
本产品已针对 2026 年市场进行更新,并针对最新 MT5 版本进行了优化。 价格更新通知: Smart Trend Trading System 目前价格为 $99 。 接下来的 30 次购买 后,价格将上涨至 $199 。 特别优惠: 购买 Smart Trend Trading System 后,请发送私信给我,即可免费领取 Smart Universal EA ,并将您的 Smart Trend 信号转换为自动交易。 Smart Trend Trading System 是一套完整的交易系统,具备不重绘、不回绘、不延迟的特点,专为希望获得更清晰信号、更准确趋势方向以及更有组织交易方式的交易者打造。   [User Manual]   ,  [PDF]  ,   [Installation manual]   and  [Online course] 它将 10 多种交易工具 整合到一个系统中,包括趋势检测、反转区域、Smart Cloud、移动止损逻辑、支撑与阻力、K线着色、提醒以及多周期分析。 该系统旨在帮助您应对不同的市场环境: 趋势市场: 识别主要趋势,发现回调,跟随
Trend Sniper X
Sarvarbek Abduvoxobov
5 (11)
Trend Sniper X 是一款适用于 MetaTrader 5 的多时间周期趋势跟踪指标,帮助交易者以清晰、精确的方式识别趋势方向和潜在的反转点。 价格信息: 当前价格为促销价,随着未来更新和新功能的发布,价格可能会有所变动。 Code2Profit 频道 通过多时间框架分析掌控市场! 如何使用 Trend Sniper X 最大化您的胜率:核心规则与交易时段技巧 技术规格 平台 MetaTrader 5 指标类型 多时间周期趋势指标 运行时间周期 任何图表时间周期,可独立选择更高的时间周期 (M1–MN1) 主要交易品种 外汇、黄金 (XAUUSD) 及其他差价合约 (CFD) 推荐账户 任何账户类型 可视化 彩色趋势蜡烛 (买入/卖出/微弱/变化) + 买入/卖出箭头 附加模块 交易时段方框 (悉尼、东京、伦敦、纽约) 主要功能 多时间周期趋势分析: 直接在当前图表上投射更高时间周期的趋势方向,提供清晰的宏观视角。 弱势/不确定柱检测: 高亮显示趋势条件不明朗的柱线,让交易者避开震荡区域。 买入/卖出信号箭头: 在确认趋势变化后的柱线上自动绘制箭头,支持警报、推送和电子邮件通
Neuro Poseidon MT5
Daria Rezueva
4.85 (54)
Neuro Poseidon is a new indicator by Daria Rezueva. It combines precise trading signals with adaptive TP/SL levels - creating best possible trades as a result! Message me and get  Neuro Poseidon Assistant  as a gift to automize your trading process! What makes it stand out? 1. Proven profitability on all assets and timeframes 2. Only confirmed BUY and SELL signals present on the chart 3. Adaptive TP & SL levels generated by the software for each trade 4. Easy to understand - suitable for al
Divergence Bomber
Ihor Otkydach
4.89 (94)
我偶爾會親自使用這個系統進行交易。 請評估我在真實帳戶上進行的手動 BOMBER 交易—— LIVE SIGNAL 购买该指标的每位用户将额外免费获得以下内容: 原创工具“Bomber Utility”,该工具会自动跟踪每一笔交易,设置止损和止盈点,并根据策略规则自动平仓; 适用于不同交易品种的指标设置文件(Set 文件); 三种不同风险模式下的 Bomber Utility 设置文件:“最低风险”、“平衡风险” 和 “观望策略”; 一套详细的 视频操作手册,帮助您快速完成安装、配置并开始使用本交易系统。 注意: 要获取以上所有赠品,请通过 MQL5 的私人消息系统联系卖家。 我为您介绍原创的自定义指标 “Divergence Bomber”(背离轰炸机),它是一套基于 MACD 背离交易策略 的“全功能”交易系统。 该技术指标的主要任务是识别 价格与 MACD 指标之间的背离,并发出交易信号(包括推送通知),指示未来价格可能的运动方向。平均而言,这些信号的准确率超过 98%。有关该指标如何工作的详细说明,请观看本页面上的视频演示。 该系统使用 止损订单 和 动态回撤平仓机制 来管理
Entry Points Pro for MT5
Yury Orlov
4.51 (148)
传奇回归:Entry Points Pro 10。 这款传奇指标曾 3 年稳居 MQL5 Market 前三,如今全面重启。 数百条热情好评(两个版本合计 589 条),每天有数千名交易者用它交易,演示版下载 31,000+   MT4+MT5  次。 五年来我读过你们的每一条评价——在第 10 版里,我没有给出许诺,而是把答案直接做进了产品。指标作者自 1999 年入市, 珍视诚信、自己的声誉和自己的客户 。 Entry Points Pro 给出的入场信号严格不重绘。 而且这一次不再只是作者的一面之词,而是可验证的事实:确认信号只在 K 线收盘后标出,自动化测试记录到 零重绘 (在 EURUSD、XAUUSD 和 BTCUSD 上共 2,486,568 次不变量检查——0 次违规)。测试方法完全公开——您可以在策略测试器中自行复现。 购买后请务必第一时间给我发私信。 我会发给您 扩展版说明书《交易者圣经》 ——使用本指标交易的完整指南——并告诉您如何免费获得 赠品:市场扫描器 ,它能同时分析多个品种和多个时间周期,并在一个界面上显示 Entry Points Pro 此刻在哪里表现
M1 Sniper MT5
Oleg Rodin
5 (6)
M1 SNIPER   是一款易于使用的交易指标系统。它是一个专为 M1 时间框架设计的箭头指标。该指标可以作为独立的系统在 M1 时间框架下进行剥头皮交易,也可以作为您现有交易系统的一部分使用。虽然该交易系统专为 M1 时间框架交易而设计,但它也可以用于其他时间框架。我最初设计此方法是为了交易 XAUUSD 和 BTCUSD。但我发现这种方法在其他市场交易中也同样有用。 指标信号既可以顺势交易,也可以逆势交易。我教授一种特殊的交易技巧,帮助您利用指标信号进行双向交易。该方法基于使用特殊的动态支撑位和阻力位区域。 购买后,您可以立即下载 M1 SNIPER 箭头指标。此外,我还为所有 M1 SNIPER 工具用户免费提供下方屏幕截图所示的 Apollo Dynamic SR 指标!这两个指标的组合可以帮助您更轻松、更准确地利用 M1 时间框架进行交易。 购买后请联系我,免费获取交易提示和奖励指标! 祝您交易成功!
Atomic Analyst MT5
Issam Kassas
4.44 (54)
本产品已针对 2026 年市场进行更新,并针对最新 MT5 版本进行了优化。 价格更新通知: Atomic Analyst 目前价格为 $99 。 接下来的 30 次购买 后,价格将上涨至 $199 。 特别优惠: 购买 Atomic Analyst 后,请发送私信给我,即可免费领取 Smart Universal EA ,并将您的 Atomic Analyst 信号转换为自动交易。 Atomic Analyst 是一款不重绘、不回绘、不延迟的 Price Action 交易指标,专为手动交易、清晰信号和 EA 自动化而设计。 User manual: settings, inputs and strategy.   &   User Manual PDF . 它分析价格行为、强度、动能、多周期方向和高级过滤器,帮助交易者减少噪音,避免弱势交易机会,并做出更有结构的交易决策。 该指标将复杂的市场计算转换为简单的视觉信号、彩色K线、趋势读数、止损水平和多个止盈区域,使交易者能够快速理解并应用于真实市场环境。 主要交易用途: 剥头皮和日内交易: 专为快速决策、清晰箭头、提醒、K线颜色和
Superhero
Ihor Otkydach
5 (2)
SUPERHERO 指標是一款基於「全方位」原則設計的多貨幣交易系統。該指標能獨立分析市場,並提供開倉與平倉的交易訊號。它採用止損與獲利了結訂單,風險報酬比(R:R)為 1:1。 我偶爾會根據這個系統的訊號親自進行交易,以下是我獲得的結果—— 即時訊號 此系統可向您的智慧型手機發送推播通知,讓您無需綁定電腦,即可「隨時隨地」進行交易。這對於自營交易公司而言再適合不過了。 每位顧客皆可享額外好禮: 每位購買此指標的買家,都將收到我贈送的一項特別實用工具,該工具: 自動下達止損與獲利了結訂單 當價格達到目標水準時,系統會自動平倉 支援待執行訂單交易 支援均值交易模式 如果您希望將這款優秀且極為便利的工具作為禮物獲贈,請在購買 SUPERHERO 指標後,立即透過 MQL5 平台的私訊與我聯繫。此外,您還將獲得培訓課程「如何安裝與設定 SUPERHERO 並開始穩定獲利」的存取權限。 關於「超級英雄」策略 SUPERHERO 策略是利用價格回調時,順應趨勢方向進行盤中交易。 「超級英雄」程式碼內含數個強大的技術指標,用以分析價格通道的趨勢方向與波動範圍,並能識別在修正性回調後形成的盤中波段反
UZFX {SSS} 超短线智能信号 v4.0 MT5 是一款无重绘的高性能交易指标,专为在快速波动的市场中需要精准、实时信号的超短线交易者、日内交易者和波段交易者设计。该指标由 (UZFX-LABS) 开发,融合了价格行为分析、趋势确认和智能过滤技术,可在所有货币对和时间周期内生成高概率的买卖信号、预警信号以及趋势延续机会。 别再对交易犹豫不决了,开始遵循这一专为追求清晰、精准和纪律性市场执行的交易者设计的结构化信号系统吧。 我的建议* 最佳时间周期:15分钟及以上。 {H1} 是我的最爱。而且效果令人惊叹……!! 更新后的主要功能 • 自动买入和卖出信号检测 • 先进的反转识别逻辑 • 潜在市场反转前的早期预警信号 • 趋势延续确认信号 • 内置风险管理功能,包含入场点、止损点、TP1、TP2和TP3水平 • 完全可自定义的风险回报比 • 实时警报、声音提醒和移动端推送通知 • 带交易建议的专业信息面板 • 适用于所有MT5交易品种和时间周期 • 界面简洁、轻量且用户友好 为什么交易者选择 UZFX SSS? 大多数交易者亏损的原因在于入场过晚、平仓过早,或者缺乏明确的交
Axiom Matrix
Issam Kassas
5 (6)
AXIOM MATRIX MT5 首发价格:$99 Axiom Matrix 现以 $99 的首发价格提供。 前 30 次购买完成后,价格将上涨至 $199。 购买后,请直接私信我,以获取使用说明并领取您的专属赠品奖励。 Axiom Matrix 是一款适用于 MetaTrader 5 的专业多品种、多时间周期市场扫描器和决策仪表板。 它会扫描您的 Market Watch,分析多个时间周期,读取多个证据引擎,比较最强的交易机会,并在一个清晰的矩阵仪表板中显示最佳 BUY、SELL、WAIT 或被阻止的状态。 我开发 Axiom Matrix,是因为我想要一个可以替我完成繁重市场扫描工作的工具。 我不想只单独检查 RSI。 然后单独检查 MACD。 然后检查移动平均线。 然后检查成交量。 然后检查波动率。 然后检查支撑和阻力。 然后还要手动在不同品种和时间周期之间切换,只为了建立一个交易思路。 我想要一个仪表板,可以扫描市场、比较证据、排序最佳机会,并告诉我现在最强的交易设置在哪里。 这就是 Axiom Matrix 背后的核心理念。 AXIOM MATRIX 的功能 Axiom Ma
FiboSniper Pro
Van Minh Nguyen
5 (2)
FiboSniper Pro – 专业多重过滤 Fibonacci 网格交易系统 FiboSniper Pro 是一套先进的技术交易指标系统,将 Fibonacci Envelopes 与 ADX、EMA、RSI、ATR 和时间过滤器等多层过滤条件相结合,用于帮助识别经过过滤的潜在入场机会,并根据 ATR 波动率自动计算止损和止盈水平。该系统专为专注于 M5 剥头皮交易策略的交易者设计。 购买后,请联系我获取使用 Auto Trader X 自动交易 FiboSniper Pro 信号的操作说明。 通过 Auto Trader X 实现自动交易: [Auto Trader X] 查看用户指南并下载推荐的设置文件: [Click here] 加入 FiboSniper Pro MQL5 官方公开频道,获取产品更新和新闻: [Click here] 该系统使用 5 个 Fibonacci 水平(23.6%、38.2%、50%、61.8% 和 100%)识别动态支撑和阻力区域,这些水平基于 Moving Average 与 ATR 的组合计算。当价格触及或突破这些水平时,系统会生成 Buy
SkyHammer Signal Pro
Shengzu Zhong
5 (4)
SkyHammer Signal Pro Professional No-Repaint Trend Signal Indicator with Locked Entry, SL and TP Levels SkyHammer Signal Pro is a structured trend and momentum signal indicator designed for traders who want clear, fixed, and verifiable trading signals. It works best on lower timeframes such as M1 and M5 . The indicator does not try to predict tops or bottoms. Instead, it waits for confirmed market structure, trend direction, momentum strength, volatility quality, and target space before generati
Power Candles MT5
Daniel Stein
5 (9)
Power Candles V3 - 自我优化的强度指标 Power Candles V3 把货币与品种的强度直接转化为图表上可执行的交易方案。指标不再仅根据强度给K线着色,而是在后台持续运行实时自动优化,为您正面对的品种给出最佳 Stop Loss、Take Profit 与信号阈值。一键采用,Entry、Stop Loss、Take Profit 线就以精确价格绘制在图表上,提醒消息中直接包含方向。 本工具是 Stein Investments 生态系统的一部分 - 18+ 款工具,加上 Max,您的一对一 AI 交易导师。  随时在线,深入了解每一款指标,在您需要梳理思路的那一刻就在那里。  立即认识他: https://stein.investments 每根收盘K线运行 3,000+ 次交易模拟。9 种强度状态。2 种策略并行测试。一键采用最优配置。 为什么需要这个 大多数强度指标只给您一个数值,然后留下三个问题:相信哪个阈值、用哪个 Stop Loss、走哪个交易方向。Power Candles V3 在每根收盘K线上自动回答这些问题。结果就是一个完整的交易方案 -
Gem SIGNAL
Shengzu Zhong
5 (1)
GEM Signal Pro GEM Signal Pro 是一款適用於 MetaTrader 5 的趨勢跟隨指標,專為希望在圖表上獲得更清晰訊號、更有結構的交易設定,以及更實用風險管理的交易者而設計。 它不僅僅顯示一個簡單的箭頭,GEM Signal Pro 還能以更清晰、更易讀的方式呈現完整的交易思路。當條件確認完成後,指標可在圖表上顯示進場價、止損價與止盈目標,幫助交易者更有效率地評估交易設定。 運作方式 該指標首先根據其內部邏輯識別有效的初始訊號。 當確認條件滿足後,GEM Signal Pro 會在圖表上顯示完整的交易設定。這讓交易者可以更清楚地看到交易結構,並減少手動分析與計算的工作量。 圖表上的交易價位 對於已確認的訊號,GEM Signal Pro 可顯示: 進場價 止損價 止盈 1 止盈 2 止盈 3 風險報酬比 這讓交易設定更容易理解,也有助於讓圖表分析更有條理。 內建風險管理 風險管理是此指標設計的重要部分。 止損位基於近期市場結構,結合附近的擺動高低點與可選的 ATR 緩衝距離。這能讓交易價位更貼近當前市場條件,而不只是依賴固定距離。 圖表資訊面板 GEM Si
The Oracle Pro
Ottaviano De Cicco
5 (1)
The Oracle Pro:用于 MT5 的合成多周期偏向引擎 ️ 夏季上市优惠 — 早期买家可以 199 USD 获得 The Oracle Pro。价格将随关注度上升;最终价格 399 USD。 The Oracle Pro 是一款面向高要求与专业交易者的 MetaTrader 5 高级多周期 偏向引擎 。它以纪律回答一个问题:当前每个周期的方向偏向是什么、强度如何、各周期之间的一致程度如何?一切仅在已收盘的 K 线上计算——绝不重绘。 The Oracle Pro 是一套多因子共识系统。它将专有指标与优化算法整合为单一而精密的共识向量,并在单个指标实例内,跨当前周期与更高周期的堆栈进行读取——而不是在多个图表上堆叠互不相关的工具。 它是 Oracle 共识方法的专业进化版:完整重建为高级操作控制台,面向希望在一个纪律化工作流中获得深度、多周期背景与背离洞察的交易者。 是偏向引擎,而非信号生成器 The Oracle Pro 明确自身定位。它是一款提供纪律化方向背景的 多周期多因子偏向指标 。它 不是 信号生成器:不承诺入场、出场或盈利。偏向是背景——你在其方向上交易自己的设置
Azimuth Pro
Ottaviano De Cicco
5 (7)
Azimuth Pro V2:MT5合成分形结构分析与确认入场 概述 Azimuth Pro 是 Merkava Labs 推出的多层级波段结构指标。四层嵌套波段层级、锚定波段的VWAP、ABC形态识别、三时间框架结构过滤以及收盘确认入场——一个图表,一个从微观波段到宏观周期的完整工作流程。 这不是盲目的信号产品。它是一个以结构为先的工作流程,专为重视位置、背景和时机的交易者打造。 ️ 夏季促销 — 庆祝夏至与 The Oracle Pro 上市:Azimuth Pro 七折优惠,现价 279 美元(原价 399 美元)。限时夏季优惠。 1. V2的变化 合成多时间框架引擎 高时间框架分析从零开始重建,采用与Meridian Pro相同的专有合成架构。更清晰的HTF背景、稳定的实时行为、无经典MTF同步问题。合成引擎还解锁了 固定比率时间框架级联 (x2、x3、x4、x6)——不再在经纪商的固定时间框架之间任意跳转,您可以按图表时间框架的固定倍数分析结构,在每个尺度上保持相同的分形关系。 确认入场箭头 作为稳定且可恢复的执行层而设计的收盘确认箭头。当ABC设置形成且自适应确认逻辑
本产品已针对 2026 年市场进行更新,并针对最新 MT5 版本进行了优化。 价格更新通知: Smart Price Action Concepts 目前价格为 $200 。 接下来的 30 次购买 后,价格将上涨至 $299 。 特别优惠: 购买后,请发送私信给我,即可领取 免费赠品 + 礼物 。 首先需要强调的是,这款交易工具是不重绘、不回绘、不延迟的指标,因此非常适合专业交易使用。 [Online course] ,   [User Manual]  ,  [How to Install]  ,   [PDF] Smart Price Action Concepts 指标是一款非常强大的工具,适合新手和有经验的交易者使用。它将 20 多个实用指标整合到一个系统中,结合了 Inner Circle Trader Analysis 和 Smart Money Concepts Trading Strategies 等高级交易理念。该指标专注于 Smart Money Concepts,帮助交易者理解大型机构如何交易,并辅助预测其市场行为。 它特别擅长流动性分析,使交易者更容易理解机
Ace Trend
Mikhail Sergeev
5 (3)
我们为您呈现一个革命性的指标,它改变了趋势交易世界的游戏规则。 该指标旨在重新思考性能并将您的交易体验提升到前所未有的高度。 我们的指标拥有先进功能的独特组合,使其有别于竞争对手。 "真实定价因素"的先进技术即使在最困难和最不稳定的市场条件下也能确保无与伦比的稳定性。 告别不稳定的模式,破碎的指标,欢迎有意识的,受控的交易。 该指标不仅仅是一个美丽的画面! 指标应该将赔率转移到交易者身边,从而赚取利润。 熟悉基于指标信号的交易结果(全自动模式): https://www.mql5.com/zh/signals/2339244 AceTrend在根据RBTI版本的趋势指标排名中排名第一。 AceTrend-最大的盈利能力和交易控制. 我们的指标根据当前市场报价而不是历史来突出盈利能力。 加入革命-释放您的交易经验的潜力! 指标不会在已形成的柱上重绘。 如果柱形已形成,指标读数保持不变。 该指标适用于从M1到MN的任何时间框架。 标准是H1时间框架。 您的反馈非常重要! 您有任何问题,建议,或只是想分享您的意见? 写评论或发送消息-我总是保持联系! 指标参数: PreSets - 如果选择
Quant Direction MT5
Georgios Kalomoiropoulos
Quant Direction 是一款三维市场分析工具。它通过同时计算多个维度上的精确百分比偏差,提供完全客观的、基于算法的市场分析视角。该算法采用先进的人工智能建模工具开发,并经过全面测试,旨在以独特的精准度解读市场。它可以分析您平台上的任何货币对或金融工具。 无论您是短线 交易者、日内 交易者还是波段交易者,Quant Direction 都是您的理想之选。 交易者的真正优势 Quant Direction 的真正优势在于彻底消除情绪、屏幕疲劳和过度思考。它无需手动点击十几个图表来寻找方向并反复质疑自己的偏好,引擎即可在几毫秒内即时处理 8 个时间周期(从 5 个月到月线)。它能准确告诉你任何时刻谁在掌控市场,确保你始终朝着概率最高的方向进行交易。 市场分析的三个维度 该算法将市场分为三个不同的交易维度,为您提供完整的宏观和微观视角: 超短线交易分析: 捕捉即时、快速的动量变化和较低时间框架的执行点。 日内分析: 识别真实的、潜在的每日方向性偏差。 波动分析: 专注于宏观趋势,确保您不会与大盘机构的走势背道而驰。 独家评分引擎 Quant Direction 的底层采用了一套
FX-AIEA 供给需求区智能识别指标( Supply and demand indicators MT5 ) 版本:2.51   | 适用平台:MetaTrader 5  为什么交易需要供给需求区? 供给需求区是机构订单流的核心体现,比传统支撑阻力更精准地反映真实买卖力量。但手动绘制不仅耗时,而且主观性强、容易错过关键区域。 FX-AIEA 供给需求区指标   采用自适应 ZigZag 算法,自动识别高概率供需区域,并将它们以彩色矩形直观标注在图表上,让您一眼看清当前市场的“禁区”与“机会区”。 ️ 核心特性 全自动绘制 + 实时刷新 基于改良版 ZigZag 动态提取有效波峰波谷,精准定位潜在供给区(红色)与需求区(天蓝色)。 新 K 线自动更新 :指标使用 MQL5 原生   prev_calculated   机制,每出现一根新 K 线即重新计算并重绘区域,永远不会“卡住不刷新”。 支持手动刷新(双击图表或切换周期),确保数据始终同步。 灵活的时间框架 Forced_TimeFrame   参数 :可强制指标运行在任意周期(如小时图加载指标,但基于日线计
Btmm state engine pro
Garry James Goodchild
5 (4)
BTMM State Engine Pro by G-Labs — Beat The Market Maker indicator for MetaTrader 5. Asian session range, London and New York kill zones, level progression (L1/L2/L3), peak formation detection (PFH/PFL), entry signals, and a multi-pair scanner from one chart. Stop scanning charts one pair at a time. The State Engine tracks the BTMM daily cycle automatically — Asian box, room boundaries, level blocks, peak formations, and filtered entries — while the scanner dashboard shows level, peak status, d
货币强度向导是一个非常强大的指标,为您提供成功交易的一体化解决方案。该指标使用多个时间范围内所有货币的数据来计算这个或那个外汇对的力量。此数据以易于使用的货币指数和货币电力线的形式表示,您可以使用它们来查看这种或那种货币的力量。 您所需要的只是将指标附加到您要交易的图表上,该指标将向您显示您交易的货币的真实强度。该指标还向您显示买卖量压力的极值,您可以在顺势交易时利用这些压力。该指标还显示了基于斐波那契的可能目标。该指标可用于各种交易时间范围。该指标支持各种货币对的交易。   该指标为您提供所有类型的警报,包括推送通知。 购买后请联系我。我将与您分享我的交易技巧,并免费为您提供丰厚的红利指标! 祝您交易愉快,获利丰厚!
M1 Quantum MT5
Hamed Dehgani
4.27 (11)
使用 M1 Quantum 的实盘交易信号 : 信号 (交易由 Quantum Trade Assistant 自动 执行,并作为本产品 免费 提供。) 最新消息: 版本 1.64 已发布。现在所有交易的止损都会设置在相应的支撑位/阻力位之后。Smart Close 功能也进行了改进,以提升此版本 EA 的性能。 自 8 月 9 日起,实盘信号一直运行在版本 1.64 上。 价格计划: 当前价格: $169 (早期用户优惠) 下一阶段计划价格: $189 计划零售价: $299 开发者提示: 购买后请联系我,以获取 最新推荐的参数设置文件(Set File) 、交易建议,以及加入 VIP 支持群组 ,与其他 M1 Quantum 用户交流经验。 常见问题 - 设置文件 - 安装指南 M1 Quantum 是一款专业的 M1 交易系统,提供快速且精准的交易信号,并内置止损(Stop Loss)、止盈(Take Profit)以及智能资金管理功能。 M1 Quantum 包含专业的资金管理系统,通过专注于 连续盈利交易 ,帮助交易者更快地增长账户资金。 M1 Quantum 指标 的主
ARICoins
Temirlan Kdyrkhan
ARICoin is a powerful trading companion designed to generate high-probability entry signals with dynamic TP/SL/DP levels based on volatility. Built-in performance tracking shows win/loss stats, PP1/PP2 hits, and success rates all updated live. Key Features: Buy/Sell signals with adaptive volatility bands Real-time TP/SL/DP levels based on ATR Built-in MA Filter with optional ATR/StdDev volatility Performance stats panel (Success, Profit/Loss, PP1/PP2) Alerts via popup, sound, push, or email Cust
Advanced Supply Demand MT5
Bernhard Schweigert
4.53 (15)
任何新手或专业交易者的最佳解决方案! 该指标是一款独特、高质量、且价格合理的交易工具,因为我们已经整合了许多专有功能和新公式。 依据此更新,您将能够显示双重时间帧区域。 您不仅可以显示一个较高的时间帧,还可以同时显示图表时间帧,加上更高的时间帧:显示嵌套时区。 供需双方所有交易者都会喜欢它。 :) 重要信息披露 高级供需的最大潜力,请访问 https://www.mql5.com/zh/blogs/post/720245   想象您的交易如何得以改善,是因为您能够精准定位入场或目标位吗? 构建于新的底层算法,它可以更轻松地识别出买卖双方之间的潜在失衡。 这是因为它以图形方式展示供需最强劲区域,及其过去的表现(显示旧区域)。 这些功能旨在帮助您更轻松地发现最佳入场区域和价位。 现在您可以针对您的交易品种和时间帧来优化和编辑区域强度! 高级供需指标适用于所有产品和时间帧。 它是一个新的公式,非常新的功能是两个区域强度函数可由用户输入进行调整! 这在交易中是一大优势。 当您学习如何使用专有功能,例如带有价格游离最小 X 因子的区域强度时,您能够判断该区域强劲与否。 供需区域用作警报触发器。
Session High Low Lines Indicator that plots key intraday reference levels directly on the chart: the previous day's high/low and the current day's high/low, updated automatically as the new day forms. An optional previous week high/low can also be displayed. These levels are widely used as reference points for potential support and resistance zones, breakout confirmation, and range context during a trading session. Features Previous day High/Low lines Current day High/Low lines (updates in real
SR Liquidity MT5
Oleg Rodin
5 (2)
SR Liquidity   是一款旨在揭示市场流动性高度集中且价格反应最剧烈的隐蔽区域的交易指标。这些特殊的流动性区域充当着强有力的支撑位与阻力位,为您清晰呈现市场最可能发生反转的位置。 SR Liquidity 指标并非简单地绘制常规的支撑/阻力线,而是通过分析实际的价格行为,识别买卖压力积聚的区域。这些区域实际上是推动市场真实波动的流动性池。通过在图表上直观呈现这些区域,该指标能助您在价格反应发生前预判走势——这意味着它实际上能够预测价格方向可能发生的变化。它将原始的价格行为转化为清晰且具实操价值的市场蓝图,标示出那些可能成为市场转折点的关键价位。 该指标适用于任何交易品种和时间周期——包括外汇、指数、金属、加密货币等。支持任意时间周期。 购买后请联系我,以获取交易指南及免费赠送的优质附加指标!
Basic Harmonic Patterns Dashboard MT5
Mehran Sepah Mansoor
4.36 (11)
该仪表盘显示所选符号的最新可用谐波形态,因此您可以节省时间并提高效率 /  MT4 版本 。 免费指标:  Basic Harmonic Pattern 指标列 Symbol:   显示所选符号 Trend:     看涨或看跌 Pattern:    形态类型(Gartley、蝴蝶、蝙蝠、螃蟹、鲨鱼、Cypher 或 ABCD) Entry:     入口价格 SL: 止损价 TP1: 第一止盈价 TP2: 第二次获利价格 TP3: 第三次获利价格 Current price:    当前价格 Age (in bars):   最后绘制的模式的年龄 主要输入 Symbols :   从 "28 种主要货币对 "或 "选定符号 "中选择。 Selected Symbols :   希望监控的符号,用逗号分隔("EURUSD,GBPUSD,XAUUSD")。如果您的经纪商为货币对设置了后缀或前缀,您必须在以下两个参数中添加(货币对前缀或货币对后缀)。 Max Iteration:   调整模式的最大迭代次数(如果该值越小,则模式越少,性能越快;如果该值越大,则模式越多,性能越慢)
PZ Support Resistance MT5
PZ TRADING SLU
3.71 (7)
厌倦了绘制支撑线和阻力线? 支撑阻力 是一个多时间指标,可以自动检测并绘制图表中的支撑线和阻力线,并具有非常有趣的变化:随着时间的推移测试价格水平及其重要性的提高,线变得越来越粗。 [ 安装指南 | 更新指南 | 故障排除 | 常见问题 | 所有产品 ] 一夜之间增强您的技术分析 无需浏览图表即可检测重要的价格水平 一目了然地识别所有价格水平的相对优势 每次交易最多可节省半小时的绘图线 指标显示所有价格水平的期限 指示器不重涂 过去和现在的价格水平因接近程度而崩溃,并根据当前的市场行为进行了调整。在动作发生的地方绘制了线条,而不一定在峰值处绘制了线条。 价格水平随着时间的推移而被拒绝,变得越来越暗 定期清除不重要的价格水平以避免噪音 可自定义的时间范围选择和崩溃因子 它实现了电子邮件/声音/推送警报的突破 输入参数 指标设置:指标将从当前时间段读取价格,但您可以选择另一个。例如,您可以在H4图表中显示D1支撑线和阻力线。您还可以使用 价格水平密度 参数选择在图表上显示多少价格水平。 颜色设置:根据重要性输入所需的支撑线和阻力线颜色。 标签设置:(可选)可以在指示器中显示用于
Blahtech Supply Demand MT5
Blahtech Limited
4.54 (13)
Was: $299  Now: $99  Supply Demand uses previous price action to identify potential imbalances between buyers and sellers. The key is to identify the better odds zones, not just the untouched ones. Blahtech Supply Demand indicator delivers functionality previously unavailable on any trading platform. This 4-in-1 indicator not only highlights the higher probability zones using a multi-criteria strength engine, but also combines it with multi-timeframe trend analysis, previously confirmed swings a
作者的更多信息
Super volumes
Yerzhan Satov
4 (1)
外汇和二元期权的箭头指示器是基于蜱数量. 与许多交易量指标不同,"超级交易量"指标计算看涨和看跌交易量,并根据其中任何一个交易量的优势给出信号。 如果,比如说,目前在这个范围内有看涨的优势,那么信号将是买入。 或者,如果占主导地位的是看跌量,那么,相应地,信号将是卖出。 在"成交量"变量的指标设置中,您可以增加或减少信号的频率。 值越高,信号越少。 默认情况下,剩下"2"。 在"HistoryBars"变量中,您可以增加历史记录上的信号数量。 默认情况下留下500。 不建议留下超过这个数字。 因为更大的数字将加载终端。 那么,在设置的最后一部分中,您可以选择更改箭头与蜡烛的距离,箭头的厚度,代码和颜色。 信号和箭头根本不画!!! 即使在改变时间框架之后。 严格建议在固定图表上的箭头后使用指标信号进行交易。 信号蜡烛关闭后,它们被彻底固定.
外汇和二元期权的指标基于MT4中的2个标准指标:ADX和RVI。 当两个指示器的线同时相交时,信号被接收。 但信号的反面也被写入代码中。 这是当信号被转换在相反的方向。 您还可以启用和禁用每个指标。 在RVI中也可以使用两种类型的信号:1)当一条线高于/低于另一条线时(这很适合用作无后坐力趋势价格走势);和2)当2条线彼此相交时。 您还可以在设置中启用内置的统计面板,其中包含有关重新计算统计信息的条数以及更新统计信息的条数后的说明。  在filter_bar变量中,您可以更改信号的类型以及相反的类型。 在alert_bar变量中,您可以设置警报将在哪个蜡烛上触发:0-在信号蜡烛上,1-在新蜡烛的打开上。 那么,在设置部分的底部,您可以更改: 1)箭头间隙-箭头从蜡烛(酒吧)的距离 2)arrow_width-箭头的大小 3)arrow_codUP和arrow_codDN-箭头代码 4)arrowa_colorUP和arrowa_colorDN是箭头的颜色。 所有的箭头和信号根本不画!!! 即使在改变时间框架。 如果箭头固定在图表上,它们不会在任何地方消失!
Anaconda LD
Yerzhan Satov
The arrow indicator "Anaconda LD" is a reversal indicator for the Forex market and mainly for Binary options. The algorithm is written on the basis of reversal patterns. It is better to use it together with other indicators to filter signals. Even with the standard ones in MT4, even with other custom ones. Any channel indicators or level indicators are especially suitable... You need to select your expiration time for different assets. Which are 1-5 bars on different pairs.
Cripton
Yerzhan Satov
The arrow indicator for Binary Options and Forex is a reversal indicator. Created and written on the basis of reversal patterns. It is recommended for Binary Options to put it on the M5 chart. Enter into transactions for 1-3 bars. Depending on the trading sessions, you need to select your expiration time for a different asset.  You can change settings in external variables. Thus, you can both increase and decrease the frequency of signals. The arrows of the indicator do not draw at all. So you
箭头指标"创建一个很酷的信号"为二元期权和外汇市场是一种构造它的信号! 您可以根据其中规定的10个标准MT4指标选择自己的信号条件,再加上另一个第三方缓冲指标,您可以添加到"缓冲指标"变量中。 这是简单的! 规定您的指示器的名称并规定它的数字(您将在颜色部分找到它们,其中显示缓冲颜色的数字)。 在屏幕截图中,我展示了一个示例,说明如果第三方指标的缓冲区不是箭头缓冲区,而是例如线条,则如何创建箭头。 他在Keltner通道的例子中显示了2种类型的信号。 1)通道线的交点。      首先要做的是找出缓冲区编号。 这里,通道的上一行是缓冲器no.0,下缓冲器No.2。 因此,为了在穿过通道的较低线时获得信号到顶部,我们写入2>o2<c,其中o打开,c关闭。 为了得到信号,我们规定一切完全相同,只有字符从多到少于2<o2>c。 2)价格落后于通道线。 一切的拼写方式完全相同,只有Open(o)和Close(c)中的字符"more(>)"/"less(<)"的拼写方向相同。 (请参阅屏幕截图中的示例。) 通过这种方式,您可以从绝对任何第三方指标输出信号。 箭头和线条。 进一步。
Highway pro
Yerzhan Satov
二元期权和外汇"公路利润"的指标是基于在通道线后面找到价格的原则。 价格离开通道并逐渐开始回到通道后,信号就会出现。 交易这样的指标非常容易和方便。 即使是新手交易者或具有多年经验的交易者也可以交易它。 您需要为每个资产选择自己的设置。 例如,在变量"A_Period"中设置的计算趋势柱的周期。 趋势由通道中的中线指示。 绿色意味着购买,红色意味着销售。 您还需要在不同的交易时段调整通道宽度,这是在"范围"变量中设置的。 其中的数字值越高,通道越宽。 那么,在较低的变量中,您可以选择您方便的箭头和线条参数。 厚度,箭头与条形的距离,它们的代码和颜色。 箭头不是实时绘制的。 他们不会从一个酒吧跳到另一个酒吧然后消失。 但是在切换时间戳之后,它们会更改它们的值。.. 祝大家好运!!!
Cool volumes
Yerzhan Satov
箭头指示器"冷量"是基于mt4上的滴答量。 指标本身跟踪在一段时间内买入或卖出的数量(时间框架选择)。 当卖家或买家的交易量出现异常过剩时,它会发出卖出或买入的信号。 在较低的窗口中绘制彩色直方图,其中绿色显示了当时买家的主导地位,这意味着在这个价格范围内可能立即逆转增加。 相反,红色表示卖方的优势,这意味着潜在的立即向下逆转。 此外,为了方便视觉感知,箭头已直接添加到主图表窗口。 为了方便用户,外部变量包含信号频率及其在历史记录(HistoryBars)上的编号的设置变量。 但不建议将值设置为1000以上。 更多的这将减慢您的终端的性能。 同样在"===<<箭头设置>>>==="部分中,您可以自己设置任何箭头和直方图参数。 直方图的厚度,箭头与蜡烛的距离,箭头代码及其颜色。 或者您可以完全禁用主图表窗口上的箭头。 箭头和信号根本不画。 即使在更改时间框架和更新终端之后。 但有必要在固定直方图和箭头后进入交易! 祝大家好运!!!
Space signals
Yerzhan Satov
The Space signals signal indicator is my new development for trading on the Forex and Binary options markets. The algorithm of the indicator is written so that it tracks the trend and gives signals for the end of the corrective price movement. In the settings, you can set the signal period yourself. The higher the value in the "period" variable, the less frequent the signals will be. But they will naturally be of higher quality.  You can also choose the arrow codes on the chart, the distance
The indicator for Forex and Binary Options trading is based on the standard Mt4 Simple Moving Average indicator. But the difference from the standard indicator is that its lines are repainted in different colors depending on the state of the trend. If the color is green, then the trend is to buy. If it's red, then it's for sale. During a trend phase change, an audio alert appears along with a buffer on the chart in the middle of the lines. Thus, it is possible to determine the state of the trend
The new Dynamic PACK Hi Tf indicator is based on tick volumes. The middle line shows the average price for the selected period of the selected senior timeframe. The upper and lower lines show the maximum/minimum of the same selected period of the same timeframe. In the settings, the user can optionally choose which timeframe and bar calculation period he needs. You can also change the style, thickness, and color of each of the lines.  In the "StsrtBars" parameter, you can select the start peri
Level Delta
Yerzhan Satov
The Level DELTA indicator for MetaTrader 4 (MT4) – a powerful volume analysis tool that stands out with its capabilities and accuracy. Indicator Description The Level DELTA indicator is designed for volume analysis in a separate MT4 window. Its main task is to identify and display divergences, allowing traders to make more informed and timely decisions. Indicator Features Volume Analysis : The indicator analyzes volumes in financial markets, allowing you to see how volumes are distributed over d
The "Volume POC WVAP" Indicator is a revolutionary tool for traders seeking in-depth analysis across various financial markets. This unique indicator, based on tick volumes in the MT4 terminal, provides indispensable information for making informed trading decisions in the following markets: Forex, binary options, cryptocurrency, spot, futures, and indices. Key Features: WVAP Line: Weighted Volume Average Price: The WVAP calculates the weighted volume average price on the selected timeframe, all
POC, Volume Profile, Market Profile, Volume Indicator, Dynamic POC, Tick Volume, Forex Volume The Dynamic POC Hi Tf Arrow indicator is a reliable volume analysis tool (volume profile, market profile, tick volume) for accurately determining POC levels and price reactions. Dynamic POC Hi Tf arrow for MT4 Description Dynamic POC Hi Tf arrow is a professional volume analysis indicator designed to accurately identify key price levels and market direction. It is built on tick volume data and displ
Quantum Empire GRID PRO - Next Generation Trading System Revolutionary Trading Technology Quantum Empire GRID PRO represents a breakthrough in automated trading, combining intelligent grid strategy with averaging system and signal filtering. After 2+ years of real-market testing, this EA has proven its stability and profitability across various asset classes. Key Features: Smart Averaging System : When closing a series of trades, profit averages 3:1 relative to losses 4 Signal Mode
Volume Profile ASA Professional Volume Profile Indicator for MetaTrader 4 Volume Profile ASA is a modern professional Volume Profile indicator designed for traders who make trading decisions based on real market activity rather than price movement alone. The indicator builds a Volume Profile directly on the chart, displaying the distribution of trading volume across price levels and helping traders quickly identify the most important market areas. Volume Profile ASA automatically calculates and
Golden Rush Robot Pro Professional Trading System for XAUUSD (Gold) An advanced intelligent Grid Expert Advisor specifically designed and optimized for trading Gold (XAUUSD). Why Choose Golden Rush Robot Pro? Most Grid Expert Advisors follow the same simple principle: when the market moves against an open position, another order is opened, then another one, and so on. The entire strategy relies on the expectation that the market will eventually reverse. While this approach can generate profit
Quantum Dynamic POC Hi Tf for MT5 Description: The "Quantum Dynamic POC Hi Tf" is a unique indicator developed for volume analysis. It is suitable for both real volumes (on futures contracts) and tick volumes (on the Forex market). The indicator is a channel tool consisting of three lines that dynamically change depending on the selected timeframe: Middle Line : the main dynamic Point of Control (POC), which reflects the average volume price. Upper Line : the maximum of the selected timeframe. L
Quqntum Delta
Yerzhan Satov
The Quantum   DELTA indicator for MetaTrader 5 (MT5) – a powerful volume analysis tool that stands out with its capabilities and accuracy. Indicator Description The Quantum   DELTA indicator is designed for volume analysis in a separate MT5 window. Its main task is to identify and display divergences, allowing traders to make more informed and timely decisions. Indicator Features Volume Analysis : The indicator analyzes volumes in financial markets, allowing you to see how volumes are distribute
Title: MACD Signals Discover the MACD Signals indicator – your reliable assistant in the world of trading! Description: The "MACD Signals" indicator is designed to make your trading more successful and efficient. It displays signals on the main chart as bright vertical lines that are easy to spot. You can customize the color and thickness of these lines to perfectly match your style and preferences. Features: Signals: Vertical lines on the main chart that stand out among other elements.
Quantum Delta VWAP — Профессиональный Анализ Объемов и Order Flow Quantum Delta VWAP — это мощный индикатор нового поколения для MetaTrader 5, разработанный для интрадей-скальпинга и систем Smart Money (SMC/ICT). Благодаря скоростному движку Canvas с двойным шлюзом кэширования, он выводит объемы на экран в реальном времени без задержек, лагов и мерцания . Индикатор идеально подходит для торговли золотом (XAUUSD), валютами, индексами и криптой, позволяя наглядно видеть действия крупных игроко
Quantum Footprint Delta VWAP is a powerful, expert-level trading and analytical suite for MetaTrader 5, combining 4 professional volume, delta, and liquidity analysis tools into a single interface. Designed for high-speed, real-time performance, it efficiently processes large datasets without slowing down your trading terminal. 4 Analytical Complexes in 1 Indicator: Per-Bar Horizontal Profile (Footprint) : Clearly displays the internal volume structure of each candlestick. The volume relief
筛选:
无评论
回复评论