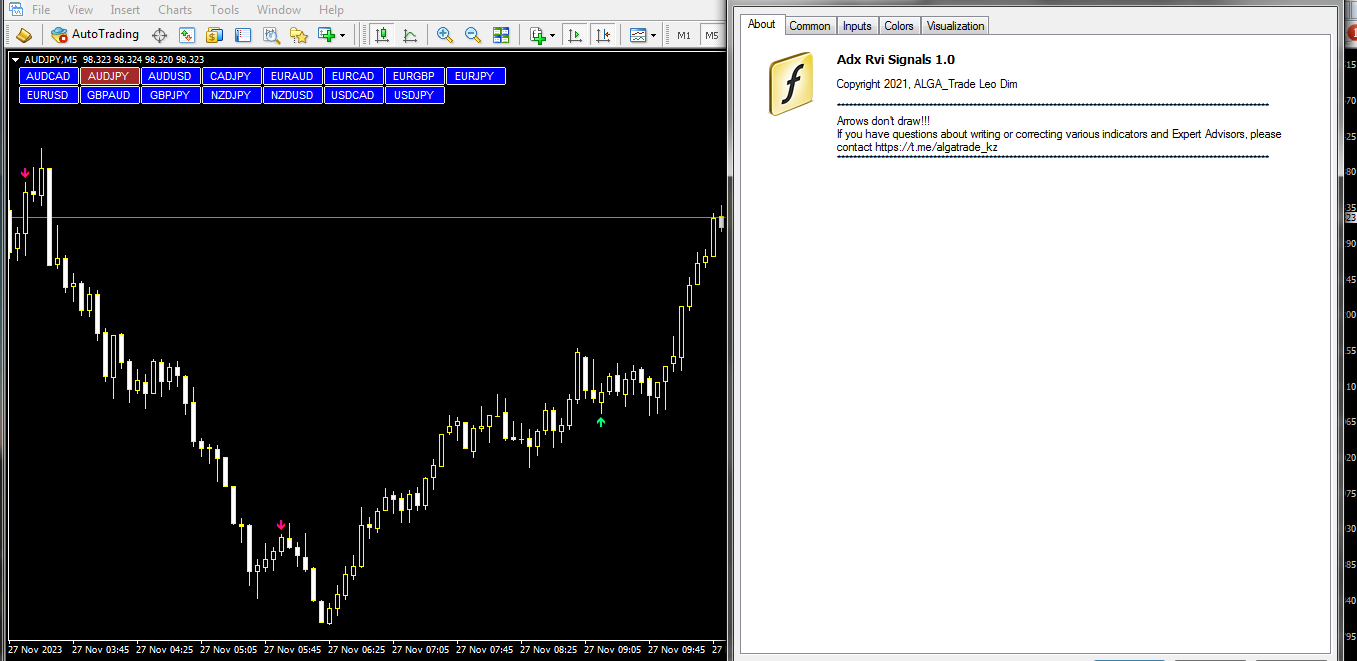
Adx Rvi Signals

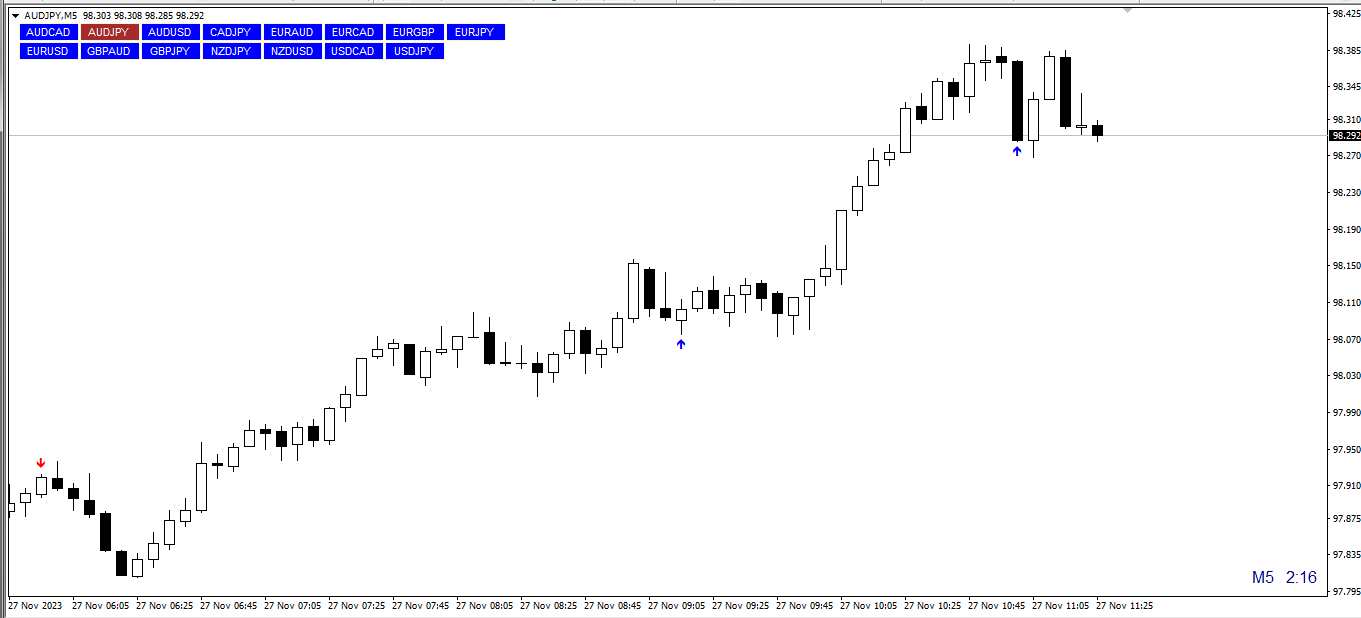
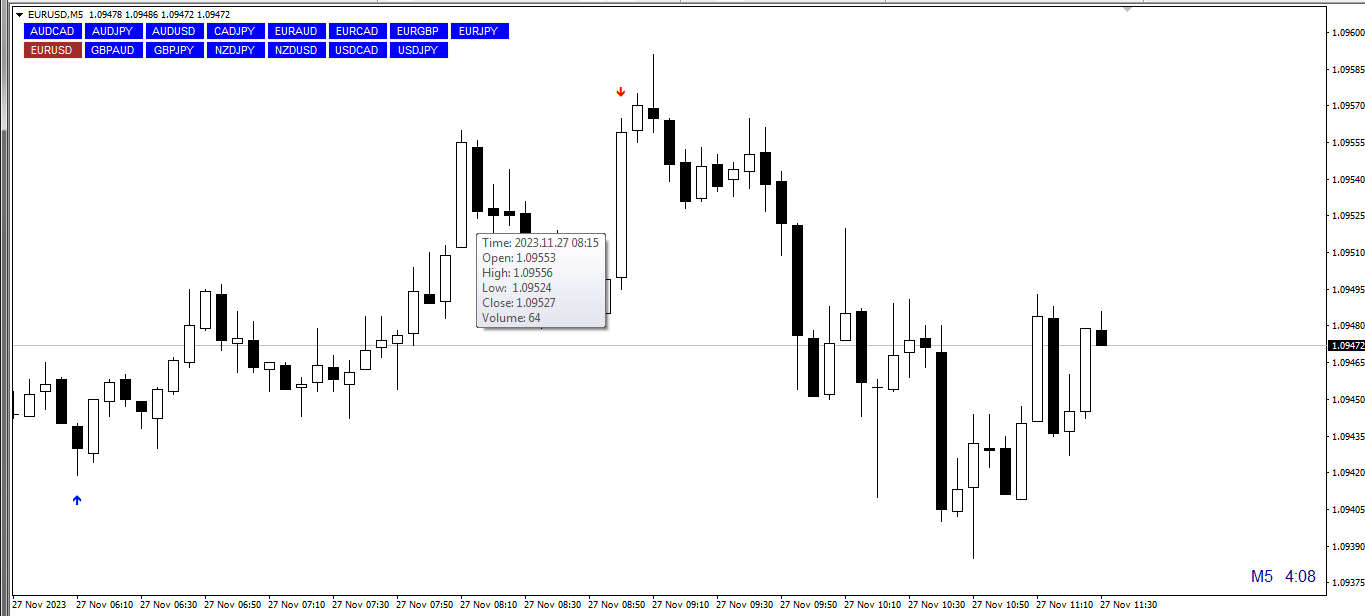
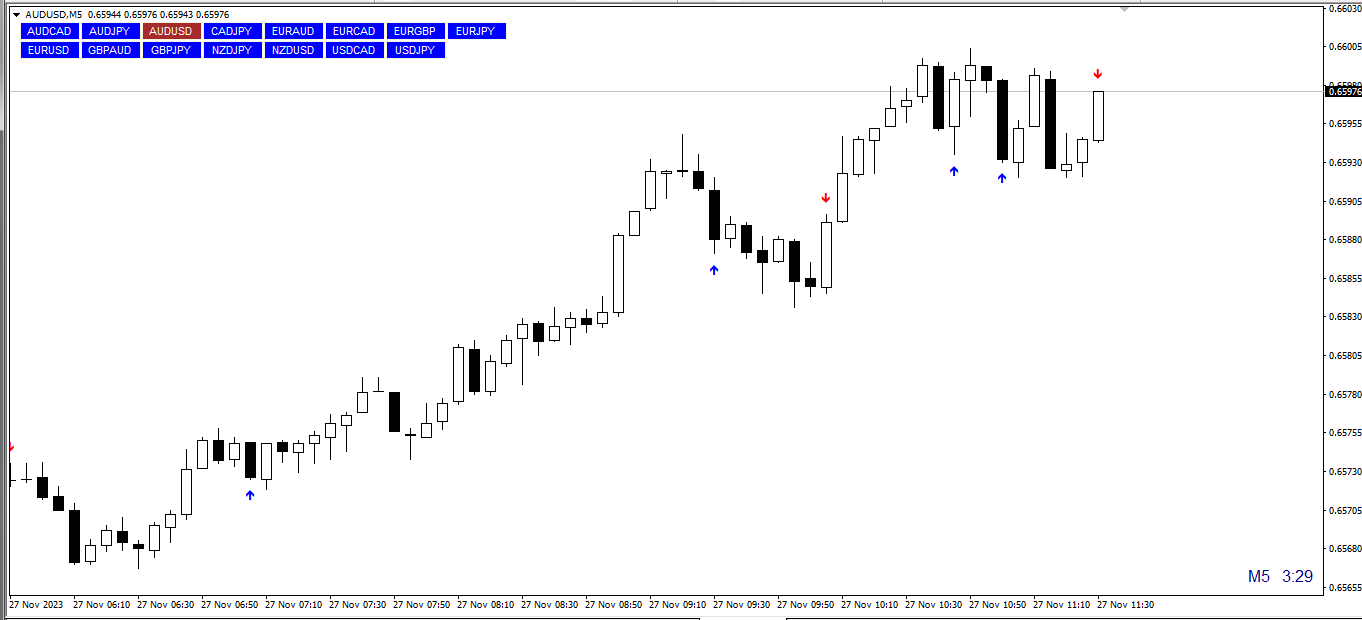
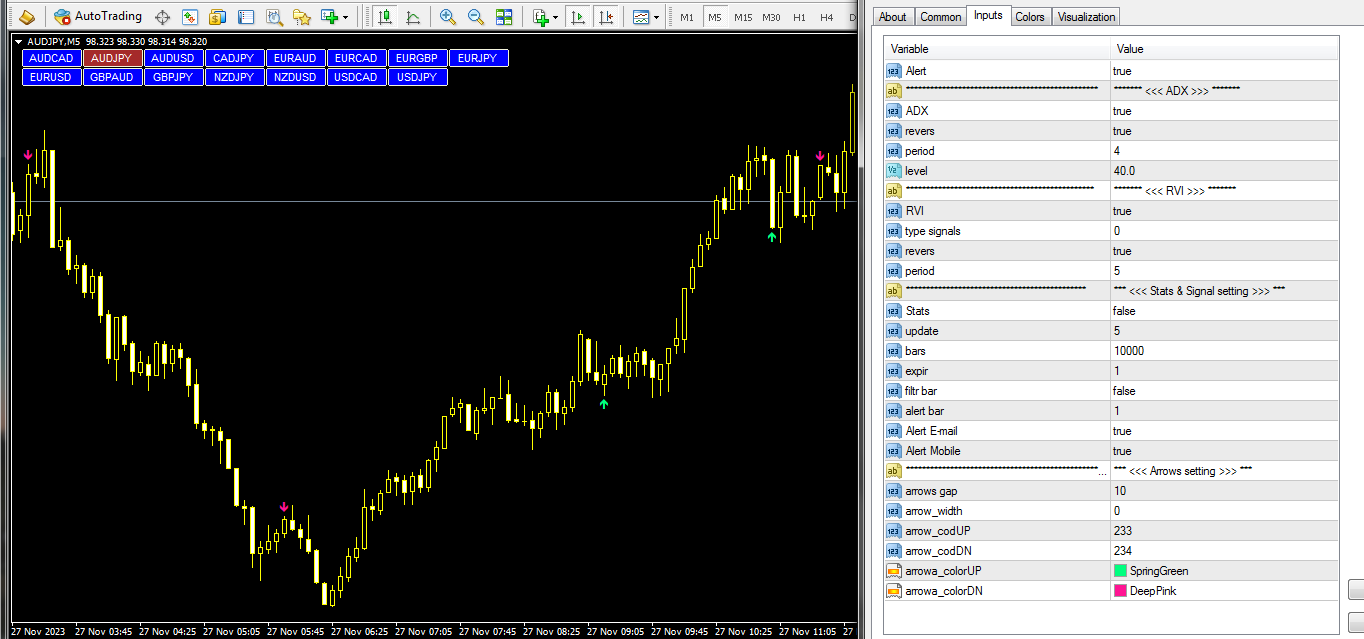
外汇和二元期权的指标基于MT4中的2个标准指标:ADX和RVI。

当两个指示器的线同时相交时,信号被接收。 但信号的反面也被写入代码中。 这是当信号被转换在相反的方向。 您还可以启用和禁用每个指标。 在RVI中也可以使用两种类型的信号:1)当一条线高于/低于另一条线时(这很适合用作无后坐力趋势价格走势);和2)当2条线彼此相交时。

您还可以在设置中启用内置的统计面板,其中包含有关重新计算统计信息的条数以及更新统计信息的条数后的说明。 

在filter_bar变量中,您可以更改信号的类型以及相反的类型。

在alert_bar变量中,您可以设置警报将在哪个蜡烛上触发:0-在信号蜡烛上,1-在新蜡烛的打开上。

那么,在设置部分的底部,您可以更改:

1)箭头间隙-箭头从蜡烛(酒吧)的距离

2)arrow_width-箭头的大小

3)arrow_codUP和arrow_codDN-箭头代码

4)arrowa_colorUP和arrowa_colorDN是箭头的颜色。

所有的箭头和信号根本不画!!! 即使在改变时间框架。 如果箭头固定在图表上,它们不会在任何地方消失!
推荐产品
Before
Nadiya Mirosh
The Before indicator predicts the most likely short-term price movement based on complex mathematical calculations. Most of the standard indicators commonly used in trading strategies are based on fairly simple calculations. This does not mean that there were no outstanding mathematicians in the world at the time of their creation. It is just that computers did not yet exist in those days, or their power was not enough for the sequential implementation of complex mathematical operations. Nowad
MA on Fractals
Evgeny Belyaev
MA on Fractals is a professional trend-following indicator for MetaTrader 4 . It builds a moving average using Bill Williams' fractals. We believe that MA on Fractals is much more efficient than a standard moving average. Its combination with other indicators allows receiving more accurate trading signals. It is most suitable for M15, M30, H1 and H4. Advantages Unique indicator. Generates minimum false signals. Suitable for beginners and experienced traders. Simple and easy indicator configurat
Crypto_Forex 指标“相对回撤显示”适用于 MT4,是实用的交易工具。 ............................................................................ 对于使用网格交易系统的交易者来说,这是必备指标!!! - 相对回撤显示指标显示您账户中当前的相对 DD 或浮动利润(以百分比表示)。 - 内置 PC 和移动警报,触发级别可调。 - 指标还显示账户余额和权益。 - 可以将指标值定位在图表的任何角落: - 还可以设置颜色和字体大小。 - 如果使用相对回撤显示,交易者不再需要任何计算器。 Click here to see high quality Trading Robots and Indicators! 这是仅在 MQL5 网站上提供的原创产品。
Flag Pattern indicator is an indicator designed to find flag patterns. Bullish and bear find flag patterns. It finds these patterns by its own algorithm. The display is easy to use and simple. Features Bullish and bear find flag patterns. Draw patterns on the graphic screen. invalid flag patterns. alert the user with the alert feature. Flag patterns have the ability to change colors. Parameters MinSplashHeight -  Min. height of splash setting MaxBarsDuration -  Max bars before crossing setting
Chaser
Thebo Junior Mahlangu
Introduction  This Indicator Is Based On Average Price/Maximum Price Moves, And Using Moving Bollinger Bands And Moving Averages. The Advantage Of Using It With YOUR own Analysis Will Confirm Potential Supports And Resistances While it Compliments With Your Analysis  The Indicator Is Non-Repainting AND Along With Our Special Trend METRE that Changes With The Conditions OF A Bullish Or Bearish Trend....  Recommend Time-Frames: H1  H4 M15 Usage: The Indicator Is Very Profitable If Use
FREE
EurUsd Binary Options
Daniel Joseph Kibe Wangewa -
YOU CAN ONLY FOWARD TEST THIS INDICATOR. USE DEMO FOR THIS AND SHARE YOUR RESULTS This indicator is a combination of different strategies that in theory drive the market.  Multi-Currency - Using the separate currencies; Euro and Dollar. RSI - from the separate currencies I get two different RSI values that are used to measure the market strength and direction It is important to note that this is not the Holy Grail and you should use a good money management system.  Two signals will appear from
it is an indicator for trading on the forex market and binary options, it is a trend tool with which you can take it most often when the first signal appears, open a trade in the indicated direction stop loss set above the arrow if the signal is lower or below the arrow if the buy signal when signals appear in the same direction where the transaction is open, you can enter into additional stop loss orders; we also set up trading without take profit; you need to close the transaction when a signa
Renko指标是一种技术分析工具,用于外汇市场中可视化价格变动和趋势,消除市场“噪音”。与传统的K线图或柱状图不同,Renko是基于价格变化的指定点数(称为“砖块大小”)来构建的。当价格移动到这一点数时,图表上会添加一个新的“砖块”。此指标忽略时间和成交量,专注于价格变化。Renko指标的主要特点包括: 噪音过滤 :由于Renko过滤器忽略了微小的价格波动,它帮助交易者更好地识别主要趋势和反转。 趋势识别 :由于砖块的清晰可见,识别上升和下降趋势变得更容易。 进出场信号 :该指标可用于生成交易信号。例如,砖块颜色的变化可以作为买入或卖出的信号。 适应性 :交易者可以根据他们的偏好和市场条件调整砖块大小。较小的砖块大小提供更详细的图像,但可能会有更多的噪音,而较大的砖块大小显示主要的价格运动,但可能会遗漏较小的趋势。 Renko指标对长期交易者和喜欢趋势交易的交易者特别有用,因为它有助于忽略不重要的价格波动,专注于重要的价格变动。 指标设置: RenkoBoxSize :Renko砖块的大小。 UpColor :买入信号的Renko线颜色。 DownColor :卖出信号的Renko线颜
KT Renko Live Chart MT4
KEENBASE SOFTWARE SOLUTIONS
KT Renko Live Chart 工具可在 MT5 平台中生成 Renko 图表,这些图表可用于技术分析、实盘交易或策略研究。该工具所创建的 Renko 图支持大多数自定义指标和自动化交易专家顾问(EA)。 完全兼容我们的 Renko Patterns 指标和 Renko Patterns EA。 功能特点 一款简单明了的 Renko 图表工具,在 MT5 上创建 Renko 图表,无需复杂设置。 支持大多数自定义指标和 EA,可实现 100% 自动化交易。 可在策略测试器中对 Renko 图进行回测,提升策略开发效率。  可启用或关闭 Renko 的影线显示功能。 输入参数 Renko 砖块大小(点): 输入用于生成 Renko 图的砖块/箱体大小(单位为点)。 显示影线: 启用或关闭 Renko 图的影线显示。 故障排查 问:  Renko 图没有接收到新的行情数据。 答:  请关闭主图和离线图,重新启动 MetaTrader,再次生成图表。 问:  生成的图表显示不完整或变形。 答:  请确保主图表中有足够的历史数据,数据量应与设定的砖块大小匹配。 问: 为什么
Delta Fusion Pro
Francesco Secchi
5 (2)
Delta Fusion Pro – 高级订单流分析,专为日内交易设计 Delta Fusion Pro 是一款专业的 MetaTrader 4 指标,能够揭示市场中的主动订单流,实时显示机构压力的强度和方向。与传统的成交量指标不同,它分析买盘(Ask)与卖盘(Bid)之间的成交量差值(Delta),用于提前预测反转、确认趋势并识别专业兴趣区域。 主要特点 智能自动调节系统 根据以下条件自动调整所有参数: 交易品种类型(外汇、加密货币、指数、大宗商品、股票) 操作周期 市场波动率(ATR) 最近平均成交量 无需手动配置,适合新手交易者——指标自动完成校准! 核心功能 净Delta与累计Delta 计算主动买盘/卖盘成交量差值,支持自定义 EMA 平滑 实时显示方向性压力 可自定义直方图颜色(买入/卖出) 价格/成交量背离 自动检测常规与隐藏背离 强度分类:强/中/弱 高级过滤:成交量确认、趋势、时间距离 图形信号(彩色箭头) 市场失衡 识别显著的买盘/卖盘比例失衡(可配置比率) 最小成交量阈值验证 图表显示彩色点(多头/空头) Infusion Volume 检测异常成交量峰值(
RRBCTC uses real Tick data to create custom Range, Time, Renko and Volume bar charts for MT4. Tick data use is RRBCTC unique feature, which allows highest quality charting of current and historical price movement. Custom inputs provide option to create range bars with sizes from 0.1 pip all the way to 100+ pip and time bars periods from second all the way to a month. Charts are updated with new data in real time, allowing user use of MT4 indicators and advisors (EA). RRBCTC greatly extends MT4 c
Teknolojide ki yüksek gelişim, üretim, e ticaret, lojistik vb tüm sektörlerde kullanıma başlandığı gibi artık finansal piyasalarda da “ yapay zeka ve algoritma” kullanılmaya başlandı. Smart Algoritma indikatörü; kaynak kodu içinde yer alan algoritma ve yapay zekası ile hiçbir analize ihtiyaç duyulmadan gün içi bütün forex enstrümanları için size buy ve sell sinyalleri yanında hedef kanal (gün içi en yüksek ve en düşük seviyeler) verir. İndikatör texti aşağıda ki bölümlerden oluşur ve herkesin a
Macro Kill Boxer
Sinan Durkan
5 (1)
What is Macro Kill Boxer? Macro Kill Boxer is a technical analysis indicator developed for the MetaTrader platform. It visualizes market movements during specific time intervals (e.g., Asia, London Open/Close, New York AM/PM) by drawing colored boxes on the chart. Each box represents the high and low price levels within the defined time period, often associated with macroeconomic events or high-volatility sessions. What Does It Do? Time-Based Analysis : Displays price movements as boxes for 58 c
FREE
PipMaster is built using a powerful trend + momentum following algorithm. Made after years of testing and with market noise filtering built-in.  Aggressive traders can enter a trade as soon as an arrow appear. Conservative traders should wait for a visual alert after a closed candle bar. This indicator is a great tool to be used with your most trusted trend/momentum trading strategy and with solid money management rules. Key Benefits: -Super easy to use by following color coded arrow pointing t
Fractal Advanced MT4
Siarhei Vashchylka
Fractal Advanced - displays Fractal and Alligator indicators on the price chart. Has wide options for settings and customization. It is also equipped with alerts and a hotkey system. Manual (Be sure to read before purchasing) | Version for MT 5 Advantages 1. The indicator does not fill the entire chart with fractals, but allows you to display only relevant signals. 2. The number of fractals is adjusted by scrolling the mouse while holding down the Shift key. 3. Instantly show/hide the Alligator
This strategy is best used for Trend based trading. While market is trending, price still makes smaller ranges. Darvas boxes show breakouts from these small ranges, while still following the original market trend. Detailed Description: https://www.mql5.com/en/blogs/post/747919 Features: Darvas - Check Darvas Box Breakout -   Check Price Above/Below MA or Darvas Box has crossed MA -   Min, Max Box Height -   Max Distance Between Entry Price and Darvas Box Other Indicators: - NRTR Trend Check
Barry Hood
Nadiya Mirosh
Barry Hood's leading trend indicator is designed to more accurately determine the direction of the trend in financial markets. Here are the main characteristics and operating principles of this indicator: Adaptive Four-Level Smoothing: The indicator uses a mechanism that allows it to effectively adapt to changing market conditions. This allows you to more accurately determine the current trend. Characteristics and features: Redraws only on the zero candle: This means that the indicator is red
Wisteria Trend
Volodymyr Zubov
Indicator for working with a Trend. Trend is your friend! The digital indicator helps to find the optimal points of entry into the market, to stay in the trend as much as possible. If the trend and direction change, exit the position in time. The indicator is recommended for use on timeframes H4 and higher. Works on any trading instrument. The indicator menu contains options for fine tuning the signals and color gamut. Happy trading!
Demark mtf
Sergey Fionin
該指標顯示德馬克模式並以箭頭和警報的形式給出交易信號。 在報價歷史上顯示 De Mark 行。 具有多幀。可以在較低的時間範圍內顯示較高時間範圍的 DeMark 模式。 具有顯示分形的可切換功能。 交易信號伴隨著聲音警報,並將它們發送到郵件和移動設備。 /////////////////////////////////////////////////////////////////////////////////////////////////////////// /////////////////////////////////////////////////////////////////////////////////////////////////////////// /////////////////////////////////////////////////////////////////////////////////////////////////////////////
Pattern Detector Indicator: Your Competitive Edge in Market Analysis - MetaTrader 4 Elevate your trading strategy with the Pattern Detector Indicator , a high-performance tool specifically engineered for the MetaTrader 4 (MT4) platform. Designed for both precision and ease of use, this indicator streamlines technical analysis by identifying high-probability market setups in real-time. Key Features Automated Pattern Scanning: Eliminate the manual effort of hunting for formations; our algorithm sc
Venom
Yaroslav Varankin
Venom indicator is a new type of indicator for scalping with high accuracy of correct predictions in the indicator you can select the indicator signal does not redraw, does not disappear, you can trust it 100% When a red blue arrow appears under the candlestick, an UP option is purchased. When red arrows appear, the DOWN option is purchased. the indicator is based on our new development, if there is an order with a large amount that opens in the direction we need, according to the analysis of th
Power Renko MT4
Pierce Vallieres
Power Renko is an indicator which plots Renko bricks underneath the chart using a histogram. You can select the brick size and the timeframe of the Renko bricks as well as whether or not to use the close price or the high/low price of the candles. Renko bricks are based on price alone, not time, therefor the Renko bricks will not be aligned with the chart's time. They are extremely useful for trend trading and many different strategies can be formed from them. Buffers are provided allowing you t
Vortex MT4
KEENBASE SOFTWARE SOLUTIONS
The Vortex Indicator was first presented by Douglas Siepman and Etienne Botes in January 2010 edition of Technical Analysis of Stocks & Commodities. Despite its based on a complex implosion phenomenon, the vortex is quite simple to interpret. A bullish signal is generated when +VI line cross above the -VI line and vice versa. The indicator is mostly used as a confirmation for trend trading strategies. The Vortex was inspired by the work of Viktor Schauberger, who studied the flow of water in tur
Mother Candle Inside Bar - Advanced Supply and Demand System Mastering price action has never been this simple.   The Mother Candle Inside Bar is a powerful,   fully automated charting tool   specifically designed to locate high-probability Supply and Demand zones using proven Inside Bar formations. The Problem   Most traders struggle in the market because their analysis is   subjective and inconsistent . You likely spend hours staring at charts, manually drawing support and resistance lines, tr
Find and fill Gaps
Leandro Oliveira
This indicator shows the gaps on the current chart with a rectangle shape and indicates when the gap is filled by closing the shape. Gaps are considered over the shadows. Allows sending alerts by e-mail or push notifications when a gap is found. Parameters SizeGAP - Size of the gap that you want to indicate; HGcolor1 - Color of the gap in an upward movement; HGcolor2 - Color of the gap in a downward movement; HGstyle - The style of rectangle to be drawn; StartCalculationFromBar - How many candl
SX Price Action Patterns is a comprehensive indicator which shows various price action patterns on the chart for those who are interested in price action trading. These patterns are as follows: A Pin Bar is a candlestick price bar, which has a long wick on one side and a small body. It is a powerful signal of price reversal in a currency trading strategy. An Inside Bar is characterized by a bar or candle that is entirely ‘inside’ the range of the preceding one and represents the consolidation o
FREE
This is a Pinbar Arrows which will check for reversal pin bars.  They are best when an ongoing trend ends and they signal a reversal. Free Scanner and Detailed Post with Extra Downloads: https://www.mql5.com/en/blogs/post/758569 Features: PinBar Body, Nose and Tail, Left Eye Options Engulfing Bar After Pin Bar Overbought/Oversold with CCI or Stochastic or RSI Distance of Pin bar body from nearest Quarter Point (Option to use Majors, halfpoints, quarters) Volatility Check
RaysFX Candlestick Signals RaysFX Candlestick Signals è un potente strumento progettato per migliorare la tua esperienza di trading su MT4. Questo indicatore personalizzato è stato sviluppato con l’obiettivo di fornire segnali di trading precisi e tempestivi basati su specifiche configurazioni di candele e l’indicatore RSI. Caratteristiche principali : Segnali di acquisto e vendita : L’indicatore genera segnali di acquisto e vendita basati su specifiche configurazioni di candele e valori dell’i
Advanced Trend Breaker Free Dashboard!!!   Advanced Trend Breaker DashBoard: https://www.mql5.com/en/market/product/66336   Breaker's smart algorithm detects the trend,Support and resistance, filters out market noise and find entry signals!!! Test the demo version and explore its features, it would be useful tool added to your trading arsenal. Do not foget down load Free DashBoard!!!   Advanced Trend Breaker DashBoard !!! Advantages You Get Easy, visual and effective trend detection. Support an
Wave Slope
Yuriy Vins
Wave Slope - works on the basis of the ZigZag indicator and is designed to measure the slope of the current wave, in degrees. The sharper the angle of inclination, the stronger the trend. And on this you can build a trading system. In the settings, you can connect the ZigZag indicator, set the color and width of the slope line. And you can also turn on and off the sound signal, which is triggered in case of a change in the slope of the wave.
该产品的买家也购买
Neuro Poseidon MT4
Daria Rezueva
4.95 (37)
Neuro Poseidon is a new indicator by Daria Rezueva. It combines precise trading signals with adaptive TP/SL levels - creating best possible trades as a result! Message me and get  Neuro Poseidon Assistant  as a gift to automize your trading process! What makes it stand out? 1. Proven profitability on all assets and timeframes 2. Only confirmed BUY and SELL signals present on the chart 3. Adaptive TP & SL levels generated by the software for each trade 4. Easy to understand - suitable for all
Gann Made Easy
Oleg Rodin
4.84 (165)
Gann Made Easy 是一个专业且易于使用的外汇交易系统,它基于使用先生理论的最佳交易原则。 W.D.江恩。该指标提供准确的买入和卖出信号,包括止损和获利水平。您甚至可以使用推送通知在旅途中进行交易。 购买后请联系我,即可免费获得交易指导和超棒的额外指标! 您可能已经多次听说过江恩交易方法。通常 Gann 的理论不仅对于新手交易者而且对于那些已经有一定交易经验的人来说都是非常复杂的东西。这是因为江恩的交易方法在理论上并不那么容易应用。我花了几年时间来完善这些知识,并将最好的原则应用到我的外汇指标中。 该指标非常易于应用。您所需要的只是将其附加到您的图表并遵循简单的交易建议。该指标不断进行市场分析工作并寻找交易机会。当它检测到一个好的入口点时,它会为您提供一个箭头信号。该指标还显示止损和获利水平。 换句话说,当您像先生一样进行交易时,该指标会为您提供最佳江恩建议。江恩亲自告诉你此时此刻该做什么。但最好的部分是您不需要了解任何有关江恩交易原则的知识,因为该指标会为您完成整个市场分析工作。
Trend Catcher ind
Ramil Minniakhmetov
5 (3)
趨勢捕捉指標 趨勢捕捉指標結合了作者獨有的客製化自適應趨勢分析指標,用於分析市場價格趨勢。它透過過濾掉短期噪音,並專注於潛在的動能強度、波動性擴張和價格結構行為,來識別真實的市場方向。此外,它還結合了平滑和趨勢過濾等客製化指標,例如移動平均線、相對強弱指標 (RSI) 和波動率過濾器。 您可以在這裡查看實際運行情況以及我的其他產品: https://www.mql5.com/en/users/mechanic/seller 請注意,我不會在 Telegram 上出售 EA 或任何設置,那是騙局。所有設定都可以在我的部落格上免費取得。 重要提示!購買後請立即聯繫我,以獲取使用說明和額外獎勵! 請注意,我不會在 Telegram 上出售 EA 或任何設置,那是騙局。所有設定都可以在我的部落格上免費取得。
Dynamic Forex28 Navigator
Bernhard Schweigert
4.43 (7)
Dynamic Forex28 Navigator - 下一代外汇交易工具。 当前 49% 折扣。 Dynamic Forex28 Navigator 是我们长期流行的指标的演变,将三种功能合二为一: 高级货币强度 28 指标 (695 条评论)+ 高级货币 IMPULSE 带警报 (520 条评论)+ CS28 组合信号(奖励)。 有关指标的详细信息 https://www.mql5.com/en/blogs/post/758844 下一代强度指标提供什么? 您喜欢的原始指标的一切,现在通过新功能和更高的精度进行了增强。 主要特点: 专有货币强度公式。  所有时间范围内的平滑和准确的强度线。 非常适合识别趋势和精确进入。 动态市场斐波那契水平(市场斐波那契)。  此指标独有的独特功能。 斐波那契应用于货币强度,而不是价格图表。 适应实时市场活动以获得准确的反转区域。 实时市场动量。  第 9 行显示市场是活跃还是被动。 对于定时交易至关重要。 全面的警报和显示。  每种货币最强的买入和卖出动量。 ​​28 对的双重动量买入和卖出。 超买/超卖警告外部范围和止损。 反转
M1 Sniper
Oleg Rodin
5 (24)
M1 SNIPER 是一款易于使用的交易指标系统。它是一个专为 M1 时间框架设计的箭头指标。该指标可以作为独立的系统在 M1 时间框架下进行剥头皮交易,也可以作为您现有交易系统的一部分使用。虽然该交易系统专为 M1 时间框架交易而设计,但它也可以用于其他时间框架。我最初设计此方法是为了交易 XAUUSD 和 BTCUSD。但我发现这种方法在其他市场交易中也同样有用。 指标信号既可以顺势交易,也可以逆势交易。我教授一种特殊的交易技巧,帮助您利用指标信号进行双向交易。该方法基于使用特殊的动态支撑位和阻力位区域。 购买后,您可以立即下载 M1 SNIPER 箭头指标。此外,我还为所有 M1 SNIPER 工具用户免费提供下方屏幕截图所示的 Apollo Dynamic SR 指标!这两个指标的组合可以帮助您更轻松、更准确地利用 M1 时间框架进行交易。 购买后请联系我,免费获取交易提示和奖励指标! 祝您交易成功!
MetaBands M4
Vahidreza Heidar Gholami
3.5 (6)
MetaBands使用强大且独特的算法绘制通道并检测趋势,以便为交易者提供进出交易的潜在点。它是一个通道指标和强大的趋势指标。它包括不同类型的通道,可以通过使用输入参数简单地合并以创建新通道。MetaBands使用所有类型的警报通知用户市场事件。 功能 支持大多数通道算法 强大的趋势检测算法 能够合并不同类型的通道 多时间帧和多货币(信号矩阵) 所有类型的警报功能(声音、屏幕闪烁、推送通知、电子邮件、弹出窗口、箭头) 它永远不会重绘 趋势检测 MetaBands使用在通道内振荡的蓝色线来检测趋势。当该线遇到通道的上界时,表明开始下跌趋势,当它遇到下界时,表明开始上涨趋势。如果蓝线接近中线,则市场处于整理期。 该指标使用独特的方法来检测趋势。一开始可能看起来有些复杂,但如果您观看视频教程,您就会意识到它是多么强大且易于使用。 入场和出场信号 当趋势变化或价格穿过上下通道时,MetaBands会立即通过不同的方法提醒交易者,这些方法可以在指标设置中启用。 信号矩阵 要监视来自不同时间框架的多个符号并在一个地方查看信号,请单击右上角按钮或按键盘上的M键以打开信号矩阵。该矩阵可以快速概览
Advanced Supply Demand
Bernhard Schweigert
4.91 (300)
现在优惠 30%! 任何新手或专业交易者的最佳解决方案! 该指标是一款独特、高质量、且价格合理的交易工具,因为我们已经整合了许多专有功能和新公式。 依据此更新,您将能够显示双重时间帧区域。 您不仅可以显示一个较高的时间帧,还可以同时显示图表时间帧,加上更高的时间帧:显示嵌套时区。 供需双方所有交易者都会喜欢它。 :) 重要信息披露 高级供需的最大潜力,请访问 https://www.mql5.com/zh/blogs/post/720245   想象您的交易如何得以改善,是因为您能够精准定位入场或目标位吗? 构建于新的底层算法,它可以更轻松地识别出买卖双方之间的潜在失衡。 这是因为它以图形方式展示供需最强劲区域,及其过去的表现(显示旧区域)。 这些功能旨在帮助您更轻松地发现最佳入场区域和价位。 现在您可以针对您的交易品种和时间帧来优化和编辑区域强度! 高级供需指标适用于所有产品和时间帧。 它是一个新的公式,非常新的功能是两个区域强度函数可由用户输入进行调整! 这在交易中是一大优势。 当您学习如何使用专有功能,例如带有价格游离最小 X 因子的区域强度时,您能够判断该区域强劲与否。 供需
Scalper Inside PRO
Alexey Minkov
4.68 (69)
Scalper Inside PRO Scalper Inside PRO 是一款日内趋势与剥头皮指标,采用独家的内置算法来评估市场方向和关键目标位。该指标会自动计算进场点、出场点以及多个止盈目标位,并显示详细的绩效统计数据,让您能够看到不同品种和策略在历史数据上的表现。这有助于您选择符合当前市场状况的交易品种。您还可以将自己的箭头指标连接到 Scalper Inside PRO,并快速查看它们的统计数据和历史信号。 Scalper Inside PRO 使用手册及参数说明: 点击阅读 该指标适用于任何品种和时间周期(日内交易推荐使用 M5),并包含多种内置策略。它既可作为独立的剥头皮工具使用,也可作为您交易系统的分析组件。 主要功能 基于独家的新一代趋势检测算法 Next-Generation Trend Detection Algorithm (NG TDA) 进行趋势识别。 自动计算进场点和出场点,并提供多级止盈目标(TP1、TP2、TP3)。 三种内置策略和一个优化器,用于将信号适配到当前品种和时间周期(仅在实时模式下可用)。 提供品种和策略在历史数据上的详细绩效统计。 提
Gann 方块指标是一种强大的市场分析工具,基于 W.D. Gann 在其“市场预测数学公式”一文中介绍的数学概念。该指标融合了与平方数(如 144、90 和 52)有关的 Gann 技术,以及平方 9。此外,它还融入了  关于如何将平方 9 与通道和星形图案结合使用的方法。 用户手册和使用方式: 在使用该指标之前,我们建议您阅读用户手册,并与我们联系以获得任何澄清。您可以在我们的网站上找到完整的用户手册。 该指标提供了 MT5 的完整版本供购买,也提供了 MT4 的免费版本供测试。提供了两个版本的链接供您方便使用。 主要特点和功能: Gann 方块指标为您的交易环境提供了全套工具,使您能够基于几何图案和 Gann 的概念做出明智的决策。以下是主要特点: 平方 9 分析: 该指标可以绘制与平方 9 有关的各种元素,包括水平线、星形图案、网格、Gann 扇形等。这在您的图表上提供了 Gann 的几何概念的视觉表示。 Gann 方块: 该指标绘制了 Gann 方块 52、90 和 144,使您能够可视化和分析它们与价格走势的关系。 自由 Gann 星形图案: 该指标使您能够直接在图表上绘制
Breakout Arrows Mt4
Michael Oko Oboh
5 (1)
Trend Breakout Arrows Indicator The Trend Breakout Arrows Indicator is a momentum-based signal tool designed to identify potential bullish and bearish breakout opportunities. It displays clear arrow signals directly on the price chart, helping traders quickly recognize possible trend changes and continuation setups. Up Arrow (Buy Signal) A magenta up arrow appears below a candle when bullish momentum begins to strengthen. This signal indicates that buying pressure may be overtaking selling press
Neo Wave PRO
Nikolay Raykov
5 (1)
Price & Time Market Structure Indicator A professional market structure tool that analyzes waves through both price and time — not price alone. Main Description NeoWave PRO is a professional market structure indicator for MetaTrader 4 designed for traders who want to move beyond traditional one-dimensional wave tools such as ZigZag, swing indicators, and basic high/low systems. Most wave indicators analyze only one thing: Price. But a real market wave is not only a price movement. A true wave de
本产品已针对 2026 年市场进行更新,并针对最新 MT5 版本进行了优化。 价格更新通知: Smart Trend Trading System 目前价格为 $99 。 接下来的 30 次购买 后,价格将上涨至 $199 。 特别优惠: 购买 Smart Trend Trading System 后,请发送私信给我,即可免费领取 Smart Universal EA ,并将您的 Smart Trend 信号转换为自动交易。 Smart Trend Trading System 是一套完整的交易系统,具备不重绘、不回绘、不延迟的特点,专为希望获得更清晰信号、更准确趋势方向以及更有组织交易方式的交易者打造。 Online course , manual and download presets . 它将 10 多种交易工具 整合到一个系统中,包括趋势检测、反转区域、Smart Cloud、移动止损逻辑、支撑与阻力、K线着色、提醒以及多周期分析。 该系统旨在帮助您应对不同的市场环境: 趋势市场: 识别主要趋势,发现回调,跟随动能,并通过止损指导和移动止损选项寻找更清晰的入场机会。 震荡
BTMM State Engine Pro MT4
Garry James Goodchild
BTMM State Engine Pro is a MetaTrader 4 indicator for traders who use the Beat The Market Maker approach: Asian session context, kill zone timing, level progression, peak formation detection, and a multi-pair scanner from a single chart. It combines cycle state logic with a built-in scanner dashboard so you do not need the same tool on many charts at once. What it does Draws the Asian session range; session times can follow broker server offset or be set in inputs. Tracks level progression (L
IQ FX Gann Levels
INTRAQUOTES
5 (2)
IQ FX Gann Levels a precision trading indicator based on W.D. Gann’s square root methods . It plots real-time, non-repainting support and resistance levels to help traders confidently spot intraday and scalping opportunities with high accuracy. William Delbert Gann (W.D. Gann) was an exceptional market analyst, whose trading technique was based on a complex blend of mathematics, geometry, astrology, and ancient mathematics which proved to be extremely accurate. Setup & Guide:  Download  MT5 Ver
PRO Renko System
Oleg Rodin
5 (30)
PRO Renko Arrow Based System for trading renko charts.  准确的信号交易任何外汇工具. 另外,我将免费提供系统的附加模块! PRO Renko系统是RENKO图表上高度准确的交易系统。该系统是通用的。 该交易系统可应用于各种交易工具。 该系统有效地中和了所谓的市场噪音,打开了获得准确反转信号的通道。 该指标易于使用,只有一个参数负责产生信号。 您可以很容易地使算法适应您感兴趣的交易工具和renko酒吧的大小。 我很乐意通过提供任何咨询支持来帮助所有客户有效地使用该指标。 祝您交易成功!购买后,立即写信给我! 我将与您分享我的建议和我的renko发电机。 另外,我将免费提供系统的附加模块!
GOLD Impulse with Alert
Bernhard Schweigert
4.67 (12)
这个指标是我们2个产品 Advanced Currency IMPULSE with ALERT  +   Currency Strength Exotics 的一个超级组合。 它适用于所有时间框架,并以图形方式显示8种主要货币和一种符号的强势或弱势冲动! 该指标专门用于显示任何符号的货币强度加速,如黄金、异国货币对、商品、指数或期货。这是它的第一个指标,任何符号都可以被添加到第9行,以显示黄金、白银、石油、DAX、US30、MXN、TRY、CNH等的真实货币强度加速(冲动或速度)。 建立在新的基础算法上,它使识别和确认潜在的交易更加容易。这是因为它以图形方式显示了一种货币的强势或弱势是否正在加速,并测量了这种加速的速度--把它想象成你汽车中的速度表。当你加速时,事情显然会发生得更快,这在外汇市场上也是一样的,即如果你配对的货币正在向相反的方向加速,你就会发现一个潜在的有利可图的交易。 动态市场斐波那契28水平被用作警报触发器,将适应市场活动。如果冲动击中黄色触发线,你将收到警报。然后你就知道作为一个交易员应该做什么。货币对和方向已经给出。只需点击警报按钮,就可以切换到该货
Advanced Currency Strength28 Indicator
Bernhard Schweigert
4.91 (657)
目前40%的折扣 任何新手或专家交易者的最佳解决方案! 这个指标是一个独特的、高质量的、可负担得起的交易工具,因为我们纳入了一些专有的功能和一个新的公式。只需一个图表,你就可以读出28个外汇对的货币强度!想象一下,你的交易将如何得到改善,因为你的交易是在你的手中进行的。想象一下,你的交易将如何改善,因为你能够准确地确定新趋势或剥头皮机会的触发点? 用户手册:点击这里  https://www.mql5.com/en/blogs/post/697384 这是第一本,原版的! 不要买一个毫无价值的崇拜者的克隆品。 特别的 子窗口中的箭头显示强劲的货币势头GAP将指导你的交易! 当基础货币或报价货币处于超卖/超买区域(外盘斐波那契水平)时,在个人图表的主窗口中出现警告信号。 当货币力量从外围区间回落时,回撤/反转警报。 十字星模式的特别警报 可选择多个时间框架,以快速查看趋势! 货币强度线在所有的时间框架中都非常平稳,当使用较高的时间框架来识别总体趋势,然后使用较短的时间框架来确定精确的入口时,效果非常好。你可以根据自己的意愿选择任何时间框架。每个时间框架都由其自身进行了优化。
The indicator scans for Dinapoli thrust pattern in multiple timeframes for the all markets filtered and shows the results on Dashboard. Key Features Dashboard can be used for all markets It can scan for thrust pattern on MN1, W1, D1, H4, H1, M30, M15 ,M5, M1 timeframes Ability to choose number of bars required above/below displaced moving average to define thrust Parameters UseMarketWatch: Set true to copy all symbols available in market watch MarketWatchCount : Set the number of symbols that
Enigmera
Ivan Stefanov
5 (8)
ENIGMERA: 市场的核心 重要提示:MQL5.com 演示版本在策略测试器中运行,可能无法完全反映 Enigmera 的功能。请查看描述、截图和视频了解详细信息。如有任何问题,请随时联系我! 该指标的代码已完全重写。版本 3.0 增加了新功能并修复了自指标发布以来积累的错误。 简介 这个指标和交易系统是金融市场的一种独特方法。ENIGMERA 使用分形周期来精确计算支撑和阻力水平。它展示了真实的积累阶段,并提供了方向和目标。无论是在趋势中还是在修正中,这个系统都能工作。 它是如何工作的 指标的大部分功能通过图表左侧的按钮控制,使得能够快速响应不同的市场情况。 按钮 ON/OFF – 显示或隐藏整个指标。 Channel – 激活支撑通道,显示可接受的偏差范围。 Dev1 (第一偏差) – 指示价格在支撑偏差内的波动,信号表示市场正在整合或积累力量。 Dev2 (第二偏差) – 显示价格在偏差之间的波动,表示趋势形成和方向。 Dev3 (第三偏差) – 表示趋势的显著加速和高波动性。 45deg (45度) – 显示市场的节奏和相对于 45 度线的运动稳定性。 Tgt1/2
本指标是实践实战交易完善的波浪自动分析的指标 !  案例... 注: 波浪分级用西方叫法不习惯,因受到缠论(缠中说禅)命名方式习惯的影响,我是将基础波浪命名为 笔 ,将二级波段命名为 段 ,同时具有趋势方向的段命名为 主趋段 (以后笔记中都是这种命名方式,先告知大家),但是算法上和缠论关系不大切勿混淆.反映的是本人分析盘面总结的 千变万化纷繁复杂的运行规律 . 对波段进行了标准化定义,不再是不同人不同的浪  ,    对人为干扰的画法进行了排除,在严格分析进场起到了关键的作用 . 使用这个指标,等于将交易界面提升美感,抛弃最原始的K线交易带你进入新的交易层次.如果不是为了交易,在宣传上也将使客户观感提升层次. 指标内容: 1. 基础波浪 (笔) : 首先我们找出了价格波动过程中的基础波动拐点,当然他的有序性低,为下一步的计算提供基础. 2. 二级波段( 段 ) :在基础波浪的基础上,通过算法分析得到层级更明显的二级波段,二级波段为波浪提供了分析基础 3. 波浪( 浪 ): 有着更清晰的趋势,更清晰直观的方向.分析一个波浪是否延续,需要看二级波段的形态,分析二级的构成,可以得出波浪
Harmonic Pattern Plus MT4
Young Ho Seo
4.44 (18)
Introduction Harmonic Patterns are best used to predict potential turning point. Traditionally, Harmonic Pattern was identified manually connecting peaks and troughs points in the chart. Manual harmonic pattern detection is painfully tedious and not suitable for everyone. You are often exposed under subjective pattern identification with manual pattern detection. To avoid these limitations, Harmonic Pattern Plus was designed to automate your harmonic pattern detection process. The functionality
Current event:  https://c.mql5.com/1/326/A2SR2025_NoMusic.gif A. 什么是 A2SR ?   * 这是一个领先的技术指标(没有重绘,没有滞后)。  -  指导 : -- 在  https://www.mql5.com/en/blogs/post/734748/page4#comment_16532516 -- 和  https://www.mql5.com/en/users/yohana/blog A2SR 在确定支撑(需求)和阻力(供应)水平方面有一种特殊的技术。 与我们在网上看到的普通方式不同,A2SR 在确定实际 SR 级别时有一个独创的概念。 原技术不是从网上拿来的,也没有在网上公开过。 A2SR 将根据您的交易风格自动选择 SR 级别。 即使您正在更改时间范围,但 SR 级别仍将保留在其位置上。 因为实际的 SR 不是从你使用的时间范围内获得的。 A2SR 拥有完整的交易工具 。 实际支持(需求)和阻力(供应)的真正概念。 新闻事件和央行讲话的市场情绪。 新闻事件和趋势的主要货币强度 (MCS) 的真正概念
KT Alpha Hunter Arrows MT4
KEENBASE SOFTWARE SOLUTIONS
大多数箭头指标只给你一个信号,然后把剩下的判断全部留给你自己。KT Alpha Hunter Arrows 给你的,是一套完整的交易计划。 每一个信号箭头出现时,图表上都会同时绘制完整计划:入场线、止损位、四个止盈目标,以及实时 Edge 结论,告诉你当前品种和时间周期是否值得交易。套装中还包含 Trade Manager EA,在你手动入场后负责后续执行,让你在市场波动和情绪干扰下依然保持纪律。非重绘。只在K线收盘后给出信号。适用于 Forex、黄金、指数,以及你交易的其他任何品种。 核心功能 非重绘买入和卖出箭头,只在K线收盘后出现。 每个信号都带有入场线、结构性止损和四个止盈目标。 Edge Dashboard 会分别评估当前图表上的买入和卖出机会。 结论系统:No Edge、Marginal、Tradeable、Good 或 Strong。 一键 Auto Optimize 按钮,可根据当前品种和时间周期自动调整设置。 完整套装包含 Trade Manager EA,并内置五种专为本指标设计的交易管理方案。 Prop Firm Risk Panel 可在图表上实时追踪日内回撤
Market Structure Patterns MT4
Samuel Manoel De Souza
5 (18)
Market Structure Patterns   is an indicator based on   smart money concepts   that displays   SMC/ICT   elements that can take your trading decisions to the next level. Take advantage of the   alerts ,   push notifications   and   email messages   to keep informed from when an element is formed on the chart, the price crosses a level and/or enters in a box/zone. Developers can access the values of the elements of the indicator using the   global variables  what allows the automation of trading d
PZ ABCD Retracement
PZ TRADING SLU
4 (5)
该指标找到AB = CD回撤形态。 AB = CD回调模式是一种4点价格结构,其中初始价格区间被部分回调,然后与回调完成后等距移动,这是所有谐波模式的基本基础。 [ 安装指南 | 更新指南 | 故障排除 | 常见问题 | 所有产品 ] 可定制的图案尺寸 可定制的AC和BD比率 可定制的突破时间 可定制的线条,颜色和大小 它根据CD纤维水平显示SL和TP水平 视觉/声音/推送/邮件警报,用于模式和突破 AB = CD Retracements可以扩展和重新绘制很多内容。为了使事情变得更容易,该指标实施了一个转折:它在向交易发出信号之前等待正确方向的Donchian突破。最终结果是带有非常可靠的交易信号的重新粉刷指示器。输入donchian突破时段作为输入。 看涨回撤是蓝色的 空头回撤是红色的 请注意,价格模式(例如AB = CD)可以扩展,指标必须重新绘制以跟随该模式的扩展。如果图案重涂超出了参数中输入的AC / BD / AB = CD比率,则该图案将消失,因为它将不再有效。要交易这些模式,请求助于donchian突破信号。 输入参数 幅度:AB = CD模式的大小 突围
Trend Lines PRO
Roman Podpora
5 (1)
TREND LINES PRO 帮助您了解市场真正的方向转变点。该指标显示真实的趋势反转点以及主要参与者重新入场的时机。 您可以看到 BOS线、 趋势变化和更高时间框架的关键水平——无需复杂的设置或不必要的干扰。信号不会重绘,并在K线收盘后仍然保留在图表上。 VERSION MT 5    -   与……搭配使用时,可发挥其最大潜力   RFI LEVELS PRO 指示器 该指标显示的内容: 实际变化 趋势(BOS 线) 一旦信号出现,它就始终有效!这与会重绘的指标有着重要的区别,后者可能会发出信号后又改变信号,从而导致资金损失。现在,您可以更精准、更准确地进入市场。此外,还有一个功能,会在箭头出现后为K线着色,直到达到目标价位(止盈)或出现反转信号为止。 重复条目   以及主要玩家的充值 为了提高寻找入场点时的视觉清晰度,我们创建了一个模块,该模块首先显示买入/卖出区域,并在该区域内寻找最佳入场点。此外,我们还加入了智能逻辑来管理止损位,该逻辑会随着时间的推移逐步降低止损位的大小,从而降低入场交易时的初始风险(移动止损位)。 信号强度水平(BOS) 该指标采用三个显著性等级来衡量
The Propfolio Master Suite is the ultimate all-in-one analytical workstation for professional traders. Combining the power of the Beat The Market Maker (BTMM) methodology, Smart Money Concepts (SND/Liquidity), and Advanced Volume Profile, this suite replaces multiple different indicators with one optimized engine. Monitor up to 14 pairs simultaneously from a single chart, instantly identify market cycles, and seamlessly map institutional footprints with the click of a button. The Command Center
Legacy of Gann
Pavel Zamoshnikov
4.83 (12)
The indicator very accurately determines the levels of the possible end of the trend and profit fixing. The method of determining levels is based on the ideas of W.D.Gann, using an algorithm developed by his follower Kirill Borovsky. Extremely high reliability of reaching levels (according to K. Borovsky  - 80-90%) Indispensable for any trading strategy – every trader needs to determine the exit point from the market! Precisely determines targets on any timeframes and any instruments (forex, met
RFI levels PRO
Roman Podpora
5 (1)
该指标能够准确显示反转点和价格回落区域。     行业领军人物 。您能洞察新趋势的形成,并以最高的精准度做出决策,掌控每一笔交易。 与……结合时,展现其最大潜力     趋势线专业版   指标  VERSION MT5 该指标显示的内容: 新趋势开始时的反转结构和反转水平及其激活。 显示屏   获利了结   和   止损   风险回报比最低的水平     RR 1:2       。 具有智能减值逻辑的止损。 显示指定指标中两种趋势类型的反转形态。 指标: 根据     趋势线     (全球趋势变化) 潮流专业版     (趋势快速变化) 简单有效   扫描器   实时趋势(新增)。 多时间框架工具筛选。 展示   利润   在 LOGIC AI 信号之后。 以下列出今日走势积极的金融工具。(RB键) 能够为终端启用通知(警报)功能,并向移动设备推送通知。 逻辑人工智能     — 利用人工智能寻找最佳切入点。 只有在启用 MTF(多时间框架分析)模式时,该功能才可用。 兼容性。 当与趋势线指标结合使用时,该指标能发挥其最大潜力。 这     RFI LEVELS PRO    
Advanced Currency IMPULSE with ALERT
Bernhard Schweigert
4.9 (490)
目前40%的折扣!! 对任何新手或专家交易者来说都是最好的解决方案! 这个指标是一个独特的、高质量的、负担得起的交易工具,因为我们已经纳入了一些专有的功能和一个秘密的公式。只需一张图表,它就能给出所有28种货币对的警报。想象一下,你的交易将如何改善,因为你能够准确地确定新趋势或剥头皮机会的触发点 建立在新的基础算法上,它使识别和确认潜在交易变得更加容易。这是因为它以图形方式显示了一种货币的强势或弱势是否正在加速,并测量了这种加速的速度--把它想象成你汽车中的速度表。当你加速时,事情显然会发生得更快,这在外汇市场上也是一样的,即如果你配对的货币正在向相反的方向加速,你就会发现一个潜在的有利可图的交易。 货币动量的垂直线和箭头将指导你的交易! 动态的市场斐波那契23水平被用作警报触发器,将适应市场活动。如果冲动触及黄色触发线,您将在MetaTrader或您的电子邮件或推送警报中收到警报。然后你就知道作为一个交易员应该做什么。货币对和方向已经给出。只要点击警报按钮,就可以切换到该货币对或打开一个新的图表,以便进一步分析。警报级别可以通过用户输入来改变,可以选择3个敏感度级别。 尽
作者的更多信息
Super volumes
Yerzhan Satov
4 (1)
外汇和二元期权的箭头指示器是基于蜱数量. 与许多交易量指标不同,"超级交易量"指标计算看涨和看跌交易量,并根据其中任何一个交易量的优势给出信号。 如果,比如说,目前在这个范围内有看涨的优势,那么信号将是买入。 或者,如果占主导地位的是看跌量,那么,相应地,信号将是卖出。 在"成交量"变量的指标设置中,您可以增加或减少信号的频率。 值越高,信号越少。 默认情况下,剩下"2"。 在"HistoryBars"变量中,您可以增加历史记录上的信号数量。 默认情况下留下500。 不建议留下超过这个数字。 因为更大的数字将加载终端。 那么,在设置的最后一部分中,您可以选择更改箭头与蜡烛的距离,箭头的厚度,代码和颜色。 信号和箭头根本不画!!! 即使在改变时间框架之后。 严格建议在固定图表上的箭头后使用指标信号进行交易。 信号蜡烛关闭后,它们被彻底固定.
Anaconda LD
Yerzhan Satov
The arrow indicator "Anaconda LD" is a reversal indicator for the Forex market and mainly for Binary options. The algorithm is written on the basis of reversal patterns. It is better to use it together with other indicators to filter signals. Even with the standard ones in MT4, even with other custom ones. Any channel indicators or level indicators are especially suitable... You need to select your expiration time for different assets. Which are 1-5 bars on different pairs.
Cripton
Yerzhan Satov
The arrow indicator for Binary Options and Forex is a reversal indicator. Created and written on the basis of reversal patterns. It is recommended for Binary Options to put it on the M5 chart. Enter into transactions for 1-3 bars. Depending on the trading sessions, you need to select your expiration time for a different asset.  You can change settings in external variables. Thus, you can both increase and decrease the frequency of signals. The arrows of the indicator do not draw at all. So you
箭头指标"创建一个很酷的信号"为二元期权和外汇市场是一种构造它的信号! 您可以根据其中规定的10个标准MT4指标选择自己的信号条件,再加上另一个第三方缓冲指标,您可以添加到"缓冲指标"变量中。 这是简单的! 规定您的指示器的名称并规定它的数字(您将在颜色部分找到它们,其中显示缓冲颜色的数字)。 在屏幕截图中,我展示了一个示例,说明如果第三方指标的缓冲区不是箭头缓冲区,而是例如线条,则如何创建箭头。 他在Keltner通道的例子中显示了2种类型的信号。 1)通道线的交点。      首先要做的是找出缓冲区编号。 这里,通道的上一行是缓冲器no.0,下缓冲器No.2。 因此,为了在穿过通道的较低线时获得信号到顶部,我们写入2>o2<c,其中o打开,c关闭。 为了得到信号,我们规定一切完全相同,只有字符从多到少于2<o2>c。 2)价格落后于通道线。 一切的拼写方式完全相同,只有Open(o)和Close(c)中的字符"more(>)"/"less(<)"的拼写方向相同。 (请参阅屏幕截图中的示例。) 通过这种方式,您可以从绝对任何第三方指标输出信号。 箭头和线条。 进一步。
Highway pro
Yerzhan Satov
二元期权和外汇"公路利润"的指标是基于在通道线后面找到价格的原则。 价格离开通道并逐渐开始回到通道后,信号就会出现。 交易这样的指标非常容易和方便。 即使是新手交易者或具有多年经验的交易者也可以交易它。 您需要为每个资产选择自己的设置。 例如,在变量"A_Period"中设置的计算趋势柱的周期。 趋势由通道中的中线指示。 绿色意味着购买,红色意味着销售。 您还需要在不同的交易时段调整通道宽度,这是在"范围"变量中设置的。 其中的数字值越高,通道越宽。 那么,在较低的变量中,您可以选择您方便的箭头和线条参数。 厚度,箭头与条形的距离,它们的代码和颜色。 箭头不是实时绘制的。 他们不会从一个酒吧跳到另一个酒吧然后消失。 但是在切换时间戳之后,它们会更改它们的值。.. 祝大家好运!!!
Cool volumes
Yerzhan Satov
箭头指示器"冷量"是基于mt4上的滴答量。 指标本身跟踪在一段时间内买入或卖出的数量(时间框架选择)。 当卖家或买家的交易量出现异常过剩时,它会发出卖出或买入的信号。 在较低的窗口中绘制彩色直方图,其中绿色显示了当时买家的主导地位,这意味着在这个价格范围内可能立即逆转增加。 相反,红色表示卖方的优势,这意味着潜在的立即向下逆转。 此外,为了方便视觉感知,箭头已直接添加到主图表窗口。 为了方便用户,外部变量包含信号频率及其在历史记录(HistoryBars)上的编号的设置变量。 但不建议将值设置为1000以上。 更多的这将减慢您的终端的性能。 同样在"===<<箭头设置>>>==="部分中,您可以自己设置任何箭头和直方图参数。 直方图的厚度,箭头与蜡烛的距离,箭头代码及其颜色。 或者您可以完全禁用主图表窗口上的箭头。 箭头和信号根本不画。 即使在更改时间框架和更新终端之后。 但有必要在固定直方图和箭头后进入交易! 祝大家好运!!!
Space signals
Yerzhan Satov
The Space signals signal indicator is my new development for trading on the Forex and Binary options markets. The algorithm of the indicator is written so that it tracks the trend and gives signals for the end of the corrective price movement. In the settings, you can set the signal period yourself. The higher the value in the "period" variable, the less frequent the signals will be. But they will naturally be of higher quality.  You can also choose the arrow codes on the chart, the distance
The indicator for Forex and Binary Options trading is based on the standard Mt4 Simple Moving Average indicator. But the difference from the standard indicator is that its lines are repainted in different colors depending on the state of the trend. If the color is green, then the trend is to buy. If it's red, then it's for sale. During a trend phase change, an audio alert appears along with a buffer on the chart in the middle of the lines. Thus, it is possible to determine the state of the trend
The new Dynamic PACK Hi Tf indicator is based on tick volumes. The middle line shows the average price for the selected period of the selected senior timeframe. The upper and lower lines show the maximum/minimum of the same selected period of the same timeframe. In the settings, the user can optionally choose which timeframe and bar calculation period he needs. You can also change the style, thickness, and color of each of the lines.  In the "StsrtBars" parameter, you can select the start peri
Level Delta
Yerzhan Satov
The Level DELTA indicator for MetaTrader 4 (MT4) – a powerful volume analysis tool that stands out with its capabilities and accuracy. Indicator Description The Level DELTA indicator is designed for volume analysis in a separate MT4 window. Its main task is to identify and display divergences, allowing traders to make more informed and timely decisions. Indicator Features Volume Analysis : The indicator analyzes volumes in financial markets, allowing you to see how volumes are distributed over d
The "Volume POC WVAP" Indicator is a revolutionary tool for traders seeking in-depth analysis across various financial markets. This unique indicator, based on tick volumes in the MT4 terminal, provides indispensable information for making informed trading decisions in the following markets: Forex, binary options, cryptocurrency, spot, futures, and indices. Key Features: WVAP Line: Weighted Volume Average Price: The WVAP calculates the weighted volume average price on the selected timeframe, all
POC, Volume Profile, Market Profile, Volume Indicator, Dynamic POC, Tick Volume, Forex Volume The Dynamic POC Hi Tf Arrow indicator is a reliable volume analysis tool (volume profile, market profile, tick volume) for accurately determining POC levels and price reactions. Dynamic POC Hi Tf arrow for MT4 Description Dynamic POC Hi Tf arrow is a professional volume analysis indicator designed to accurately identify key price levels and market direction. It is built on tick volume data and displ
Quantum Empire GRID PRO - Next Generation Trading System Revolutionary Trading Technology Quantum Empire GRID PRO represents a breakthrough in automated trading, combining intelligent grid strategy with averaging system and signal filtering. After 2+ years of real-market testing, this EA has proven its stability and profitability across various asset classes. Key Features: Smart Averaging System : When closing a series of trades, profit averages 3:1 relative to losses 4 Signal Mode
Quantum Dynamic POC Hi Tf for MT5 Description: The "Quantum Dynamic POC Hi Tf" is a unique indicator developed for volume analysis. It is suitable for both real volumes (on futures contracts) and tick volumes (on the Forex market). The indicator is a channel tool consisting of three lines that dynamically change depending on the selected timeframe: Middle Line : the main dynamic Point of Control (POC), which reflects the average volume price. Upper Line : the maximum of the selected timeframe. L
Quqntum Delta
Yerzhan Satov
The Quantum   DELTA indicator for MetaTrader 5 (MT5) – a powerful volume analysis tool that stands out with its capabilities and accuracy. Indicator Description The Quantum   DELTA indicator is designed for volume analysis in a separate MT5 window. Its main task is to identify and display divergences, allowing traders to make more informed and timely decisions. Indicator Features Volume Analysis : The indicator analyzes volumes in financial markets, allowing you to see how volumes are distribute
Title: MACD Signals Discover the MACD Signals indicator – your reliable assistant in the world of trading! Description: The "MACD Signals" indicator is designed to make your trading more successful and efficient. It displays signals on the main chart as bright vertical lines that are easy to spot. You can customize the color and thickness of these lines to perfectly match your style and preferences. Features: Signals: Vertical lines on the main chart that stand out among other elements.
筛选:
无评论
回复评论