Quantum Volumes Profiles

Quantum Volumes Profiles

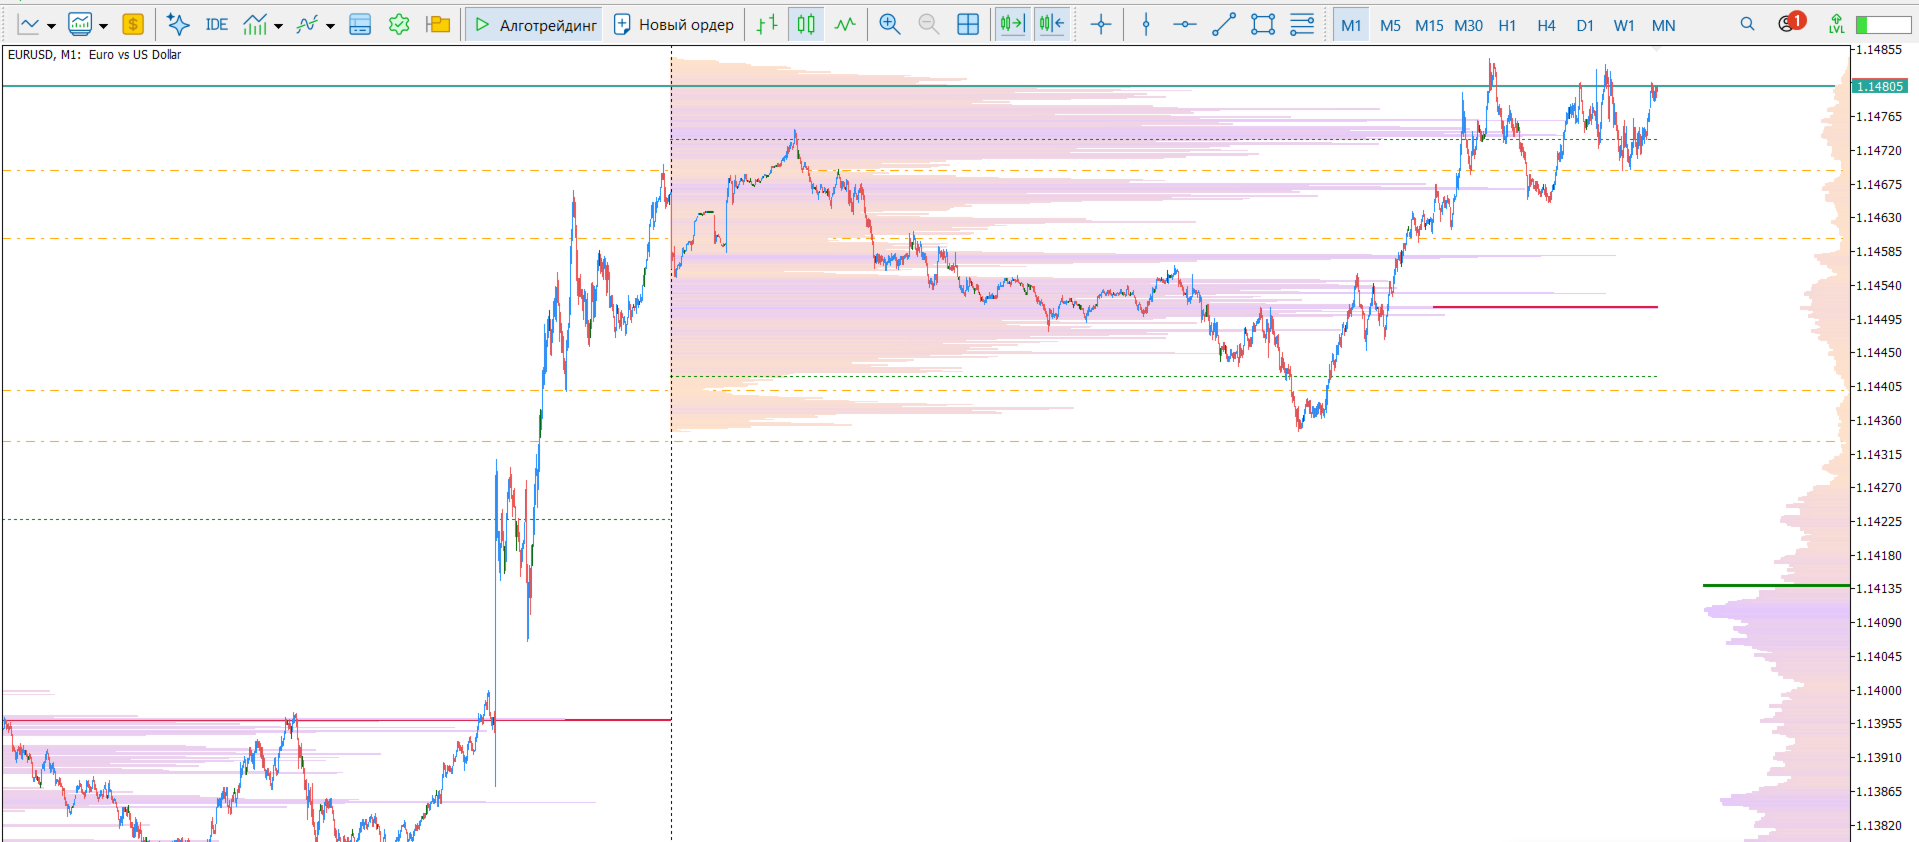
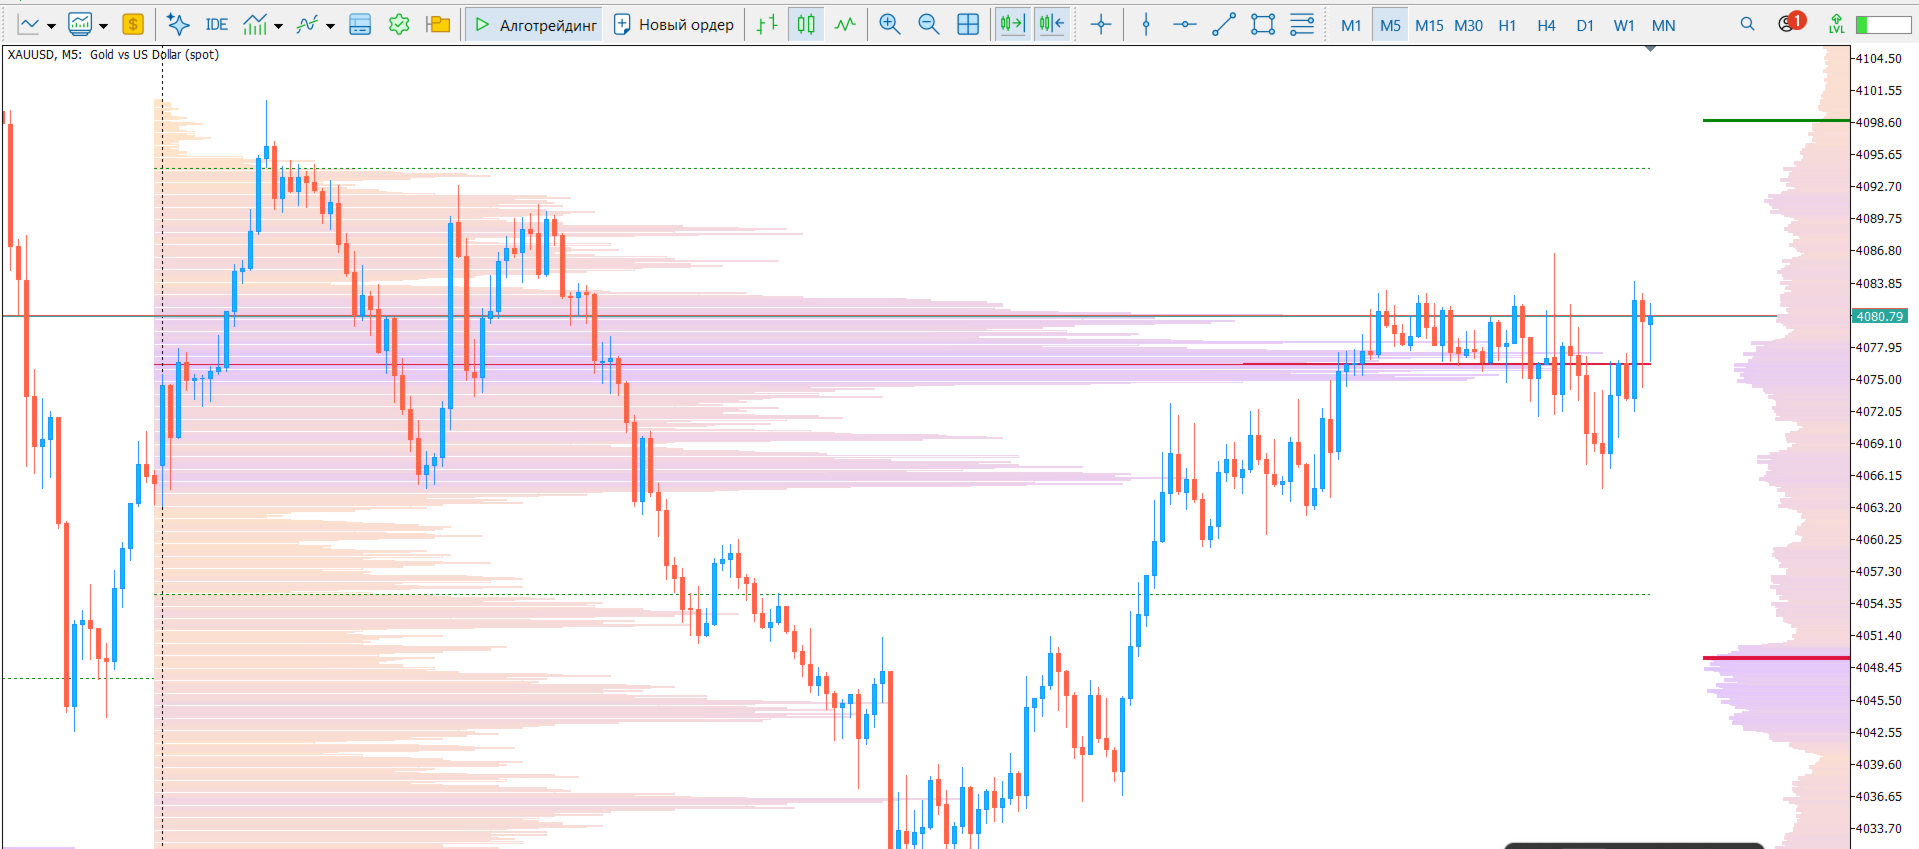
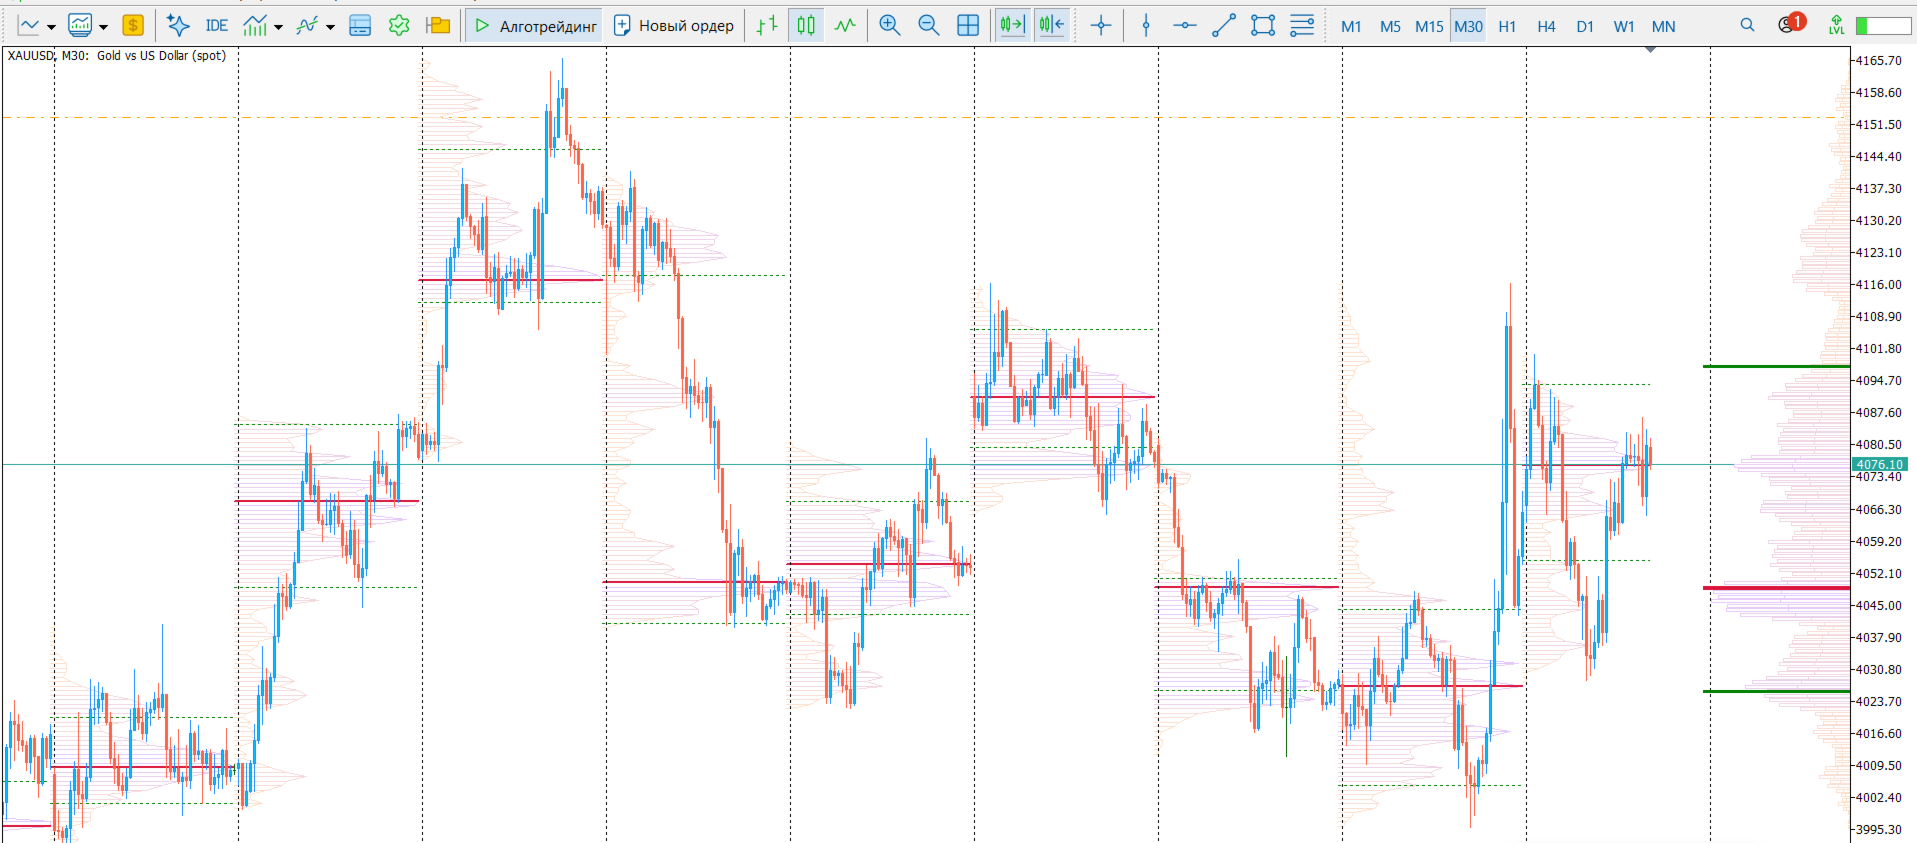
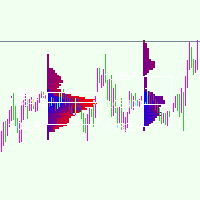
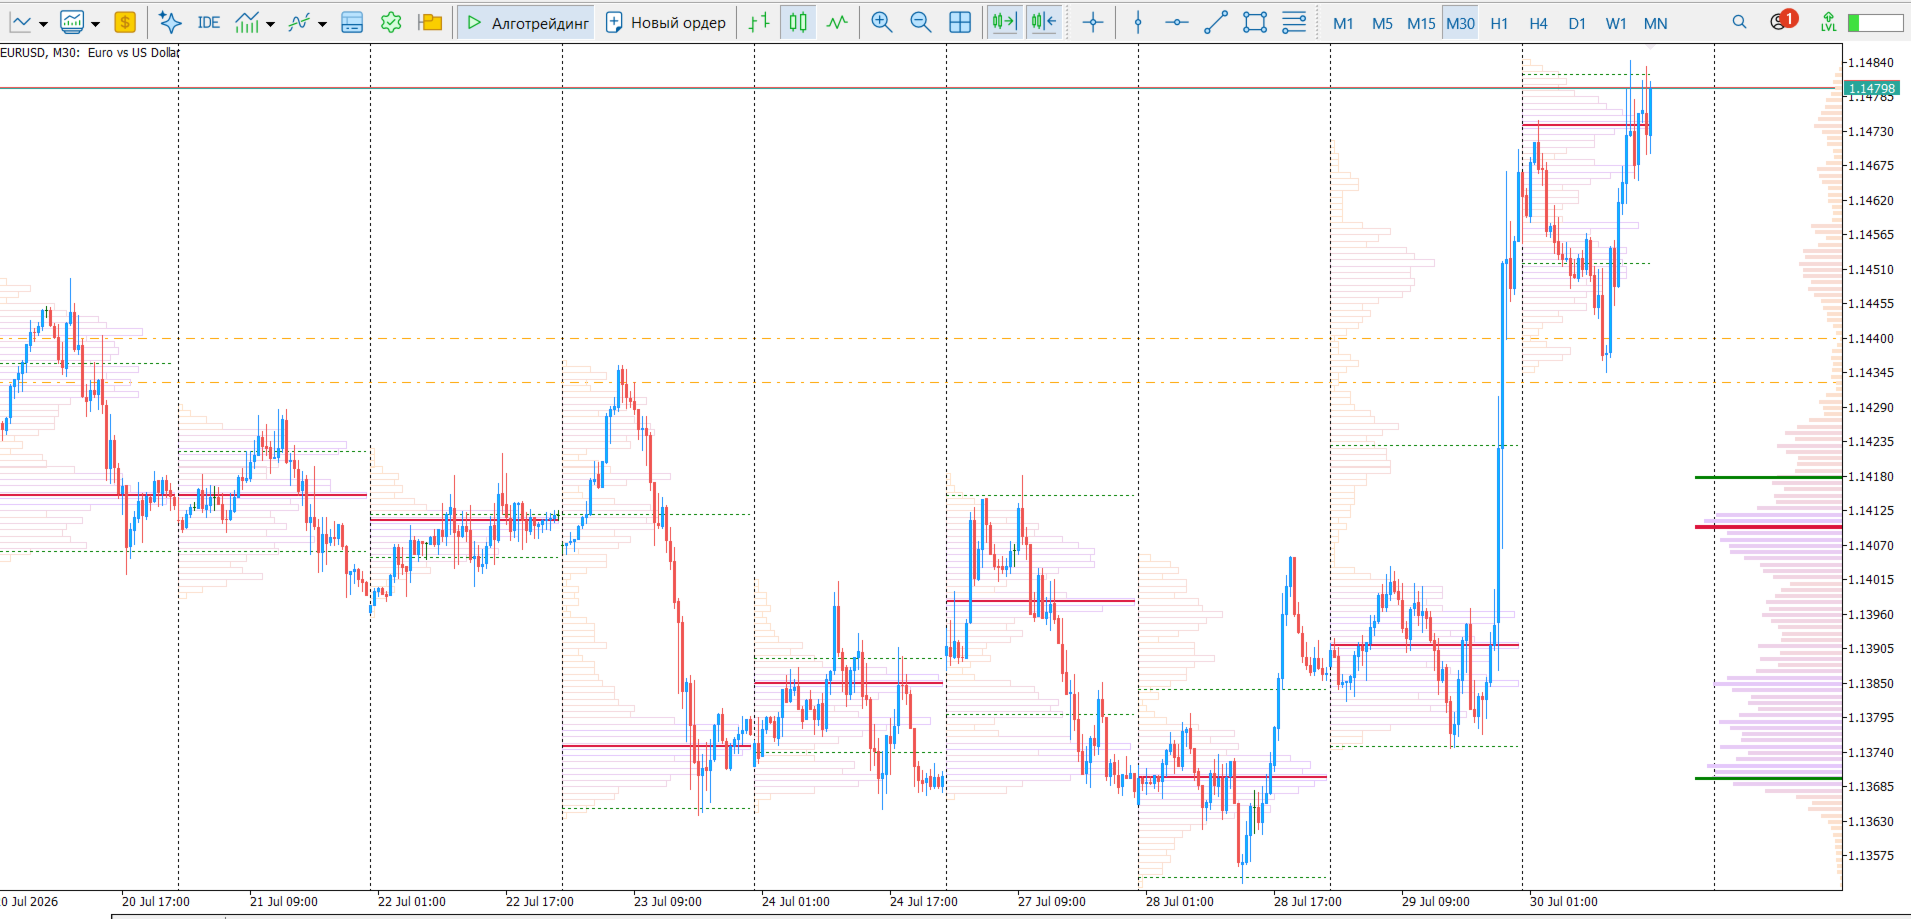
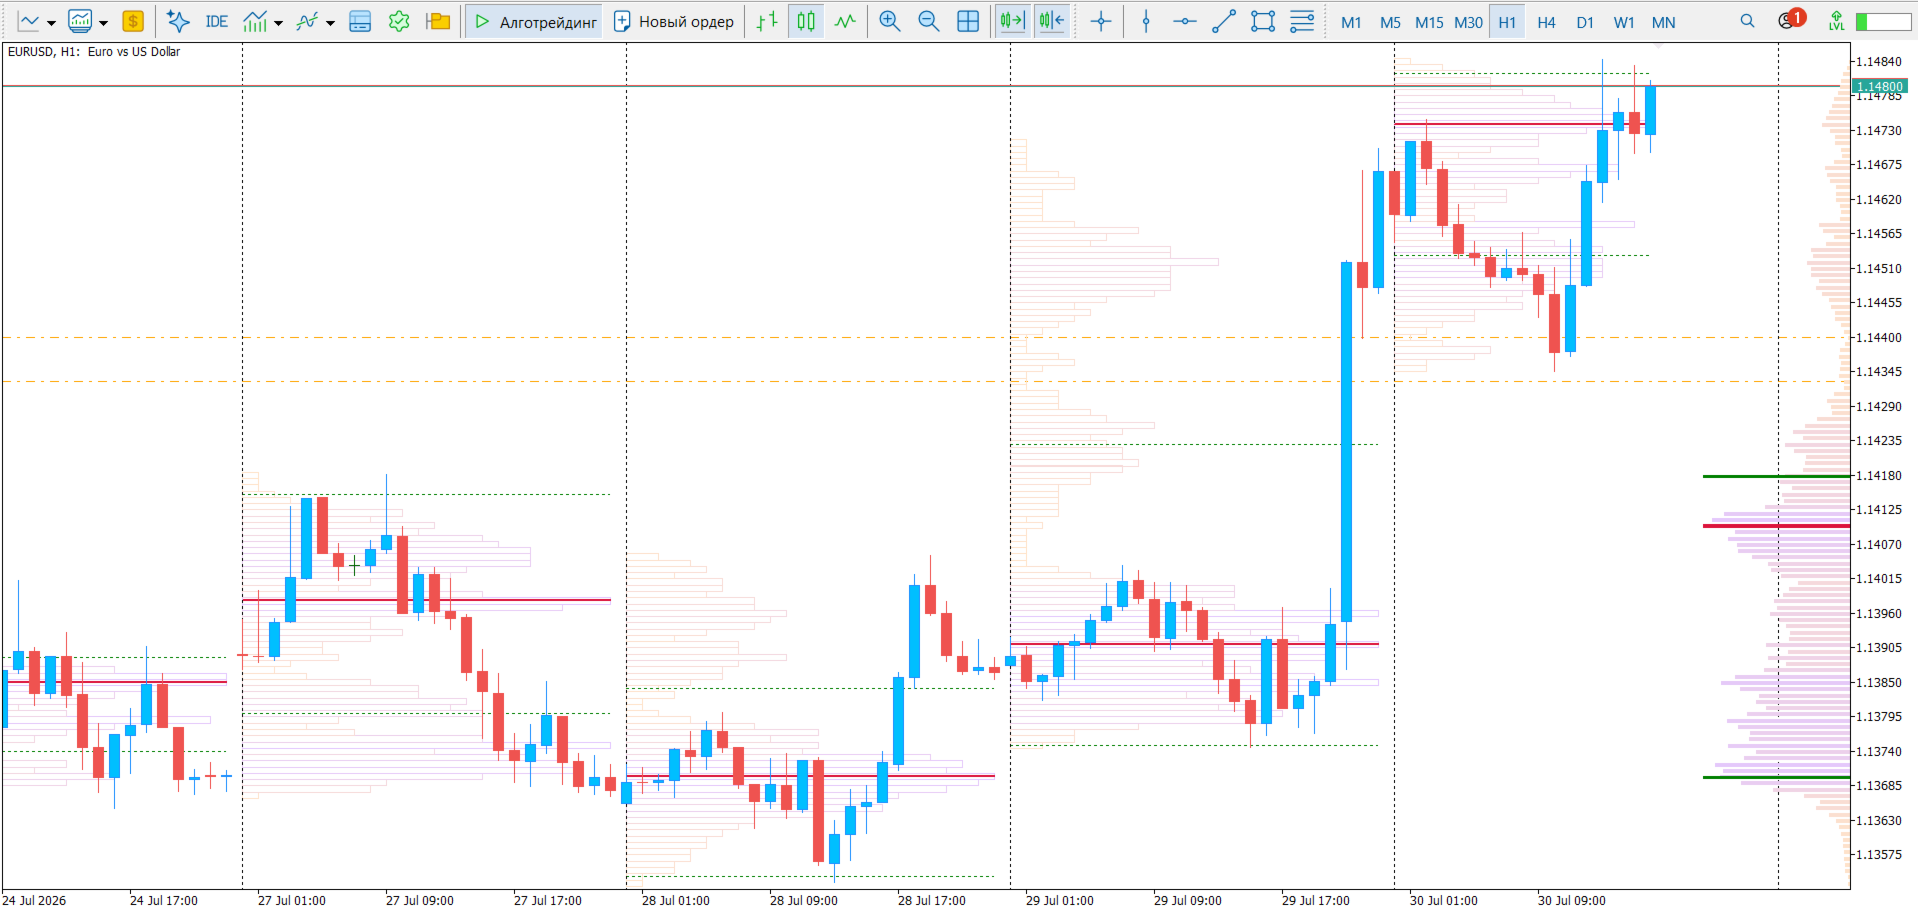
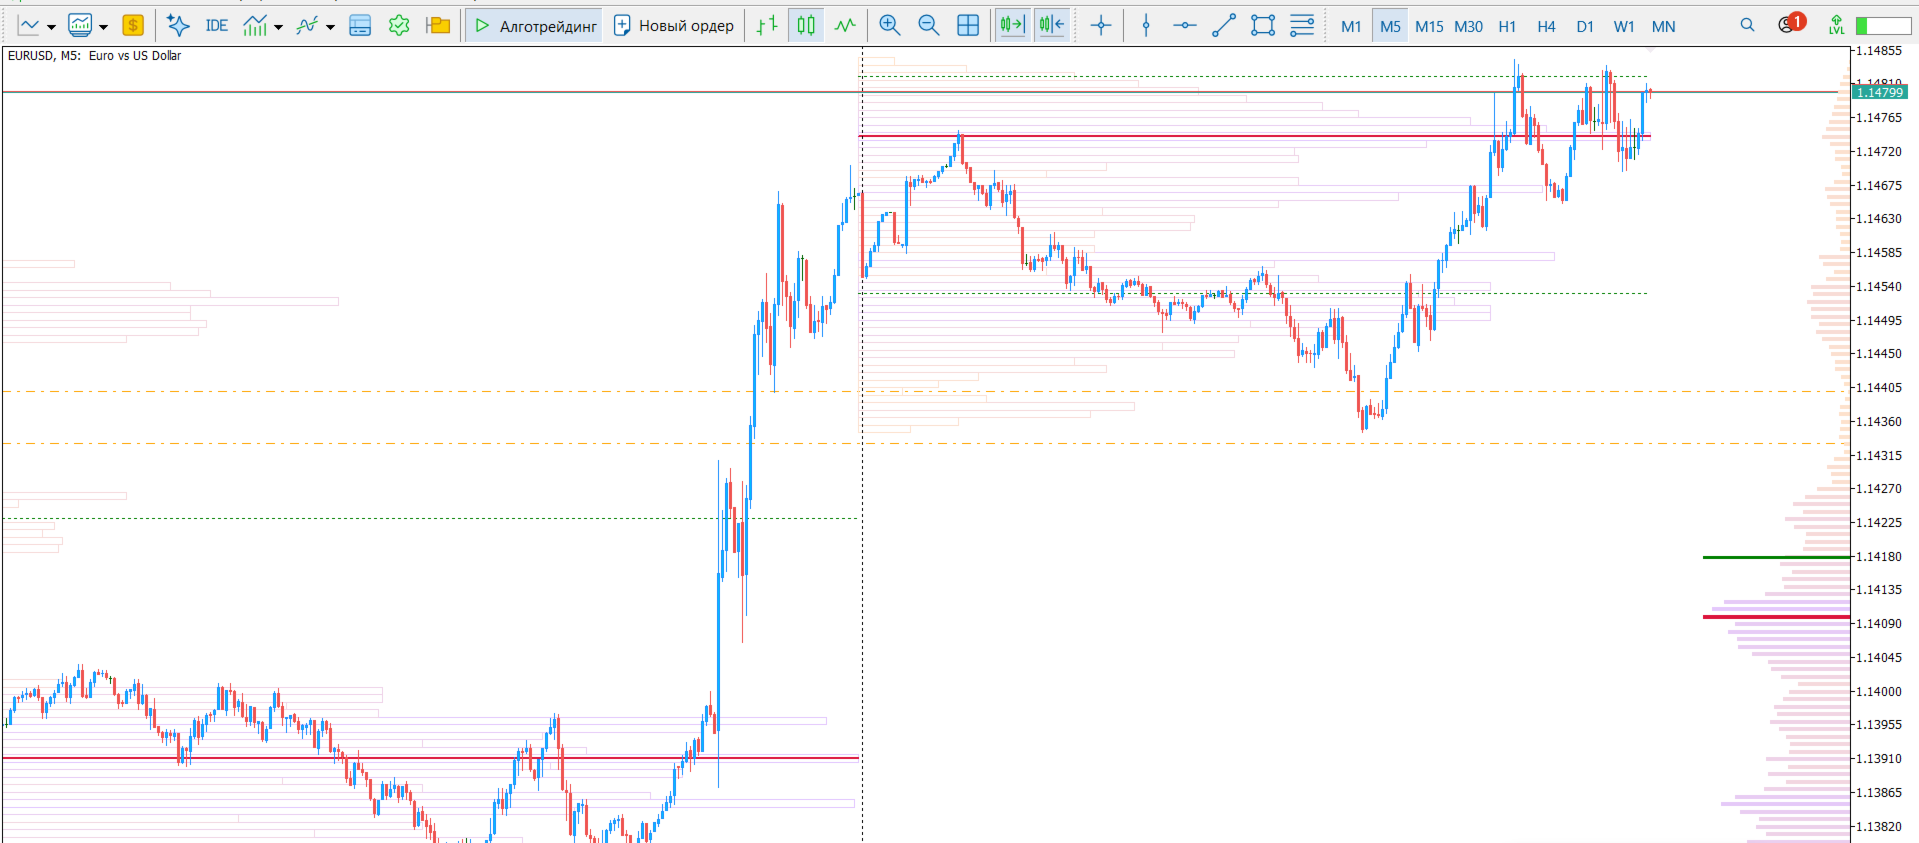
Quantum Volumes Profiles is a professional volume analysis indicator for MetaTrader 5 designed to identify key price levels, reveal areas of institutional interest, and provide a clear understanding of volume distribution within any selected trading range.

The indicator combines two of the most powerful volume analysis tools into a single product:

  • Global Volume Profile – displays volume distribution over a user-defined historical period.
  • Session Volume Profile – shows the volume profile for the current trading session or any selected session range.

This combination allows traders to analyze both the long-term market structure and the current session simultaneously, making it easier to identify where significant trading activity is concentrated.

Supports Both Tick and Real Volumes

Quantum Volumes Profiles works with two different volume sources:

  • Tick Volume – available with virtually every Forex broker and suitable for most trading instruments.
  • Real Volume – supported whenever your broker provides exchange-traded volume data.

This flexibility allows the indicator to be used across virtually any market while taking full advantage of real exchange volume whenever it is available.

What the Indicator Shows

Quantum Volumes Profiles helps traders identify:

✔ High-volume price areas (areas of strong market interest)

✔ Accumulation and distribution zones

✔ Strong support and resistance levels

✔ Price levels where reversals are most likely

✔ Areas where the market spent the most trading activity

✔ High-probability continuation and reversal zones

Unlike traditional technical indicators that focus only on price movement, Quantum Volumes Profiles reveals the true volume interest across the analyzed range, helping traders understand where buyers and sellers were actually most active.

Main Features

  • Global Volume Profile
  • Session Volume Profile
  • Supports Tick Volume
  • Supports Real Volume (when provided by the broker)
  • Automatic Point of Control (POC) calculation
  • Automatic Value Area (VAH/VAL) calculation
  • Adjustable profile width
  • Multiple display styles
  • Fully customizable colors
  • High-performance rendering engine
  • Optimized calculation algorithms
  • Smooth operation even with large historical datasets
  • Stable display during chart zooming and scaling

Who Is It For?

Quantum Volumes Profiles is an excellent tool for traders using:

  • Price Action
  • Smart Money Concept (SMC)
  • ICT
  • Volume Trading
  • Order Flow
  • Support & Resistance trading
  • Intraday trading
  • Swing trading

Supported Markets

The indicator can be used on virtually any financial instrument, including:

  • Forex
  • Gold (XAUUSD)
  • Silver
  • Stock Indices
  • Crude Oil
  • Stocks
  • Futures
  • Cryptocurrencies

Why Choose Quantum Volumes Profiles?

Unlike many similar indicators, Quantum Volumes Profiles is designed with both accuracy and performance in mind. Its optimized algorithms process large amounts of historical data efficiently, allowing smooth operation even when building extensive Global Volume Profiles.

If you are looking for a fast, reliable, and feature-rich volume analysis tool that combines Global and Session Volume Profiles in one indicator while supporting both Tick Volume and Real Volume, Quantum Volumes Profiles will become an essential part of your trading toolbox.
おすすめのプロダクト
Fixed Volume Profile
Carlos Pascual Perez Maturano
This indicator, titled "Fixed Volume Profile.mq5", is a custom tool for MetaTrader 5 (MQL5) designed to calculate and display a Volume Profile over a user-defined fixed time range. The Volume Profile shows the distribution of trading volume at different price levels during a specific period, helping to identify areas of high activity (such as Points of Control or POCs) and volume-based support/resistance areas. Main Functionality: Interactive Range: The indicator creates two vertical lines on
FREE
The indicator calculates ZigZag using the classic algorithm with three parameters: Depth, Deviation, and Backstep. Its main function is detecting and visualizing repaints — moments when the last ZigZag point shifts to a new bar. Upon loading, the indicator performs a simulation over the specified history depth. The algorithm sequentially recalculates ZigZag for each bar, comparing the current position of the last point with the previous one. If a shift is detected, a repaint line appears on the
FREE
Volume Data on Candles Indicator for MetaTrader 5 Maximize your trading insights with the Volume Data on Candles indicator for MetaTrader 5. This powerful tool provides real-time volume data directly on each candle, allowing you to identify significant shifts in market activity. When the volume of a candle exceeds the average of the last 50 candles, it will be clearly highlighted , ensuring you don't miss out on potential high-volume movements. Key Features: Real-Time Volume Data : Displays volu
FREE
FULL FOREX MARKET VIEW ダッシュボードインジケーター MT5 これは、トレーダーに市場の全体像を提供するためにMT5プラットフォーム用に作成されたカスタムインジケーターです。リアルタイムデータを使用して市場を分析し、成功するために必要なすべての情報を表示します。 インストール方法: このインジケーターをチャートに適用する前に、MT5の「気配値表示」パネルで、不要または取引しない通貨ペアを非表示にし、必要なものだけを残してください。理由は、FFMVダッシュボードはMT5の「気配値表示」にあるすべての通貨ペアを表示するためです。最大で26ペアまで表示可能です。それ以上あると、FFMVダッシュボードのフォントや画像がぼやけ、崩れてしまいます!正しく表示されません。 使用目的: 単独取引用 バスケット取引用(スクリーンショット参照) 複数注文取引にも使用可能 自分の取引システムからのシグナルの確認 構成要素: 時間足: M1からMN1までの現在のローソク足の状態(買い/売り) トレンド: 通貨の全体的な傾向 インパクト: 通貨の動きの強さ/ボラティリティ(以下参照) Bu
X Sensors Proは、選択した期間における取引量の価格レベル別分布を可視化するプロフェッショナルな出来高プロファイル指標です。この指標は自動的にローカルな極値(HHとLL)を特定し、最大出来高のレベルであるPOC(Point of Control)を計算し、特定された範囲に基づいてサポートラインとレジスタンスラインを構築します。 主な機能: カラーヒストグラムによる出来高プロファイルの可視化 POC(Point of Control)の自動検出 HH(より高値)とLL(より安値)レベルの構築 ピボットレベルと複数のサポート/レジスタンスレベルの計算 強気(緑)と弱気(赤)の出来高の色別表示 あらゆる時間足に適応する調整機能 この指標の目的は? この指標はトレーダーの以下の課題を解決します: 1. 蓄積と分配ゾーンの特定 出来高は常に大口プレイヤーが市場に参入または退出する場所に集中します。POCは最大数の取引が発生した価格を示します。これは心理的に重要なレベルです。 2. 適正価格の探索 POCはしばしば「適正価格」と見なされます。これは市場が最も長く滞留するレベル
Here   our more valuable tools SMC Trend Trading   ,  Easy SMC Trading  ,  Institutional SMC Architect Volume Analysis Tools  ,  Volume flow Profile  ,  Market volume profile  , FVG with Volume  , Liquidity Heatmap Profile  ,  Volume Spread Analysis Short Description: Stop overloading your charts with dozens of indicators.   Bollinger Fibo  Pro   is a sophisticated, all-in-one trading system for MetaTrader 5 that merges two legendary concepts into a single, powerful tool. It enhances standard
Title: Smart VP: Buy/Sell Bars + POC Description: Enhance your trading with the Right Anchored Volume Profile. Visualize buy and sell volumes per price level with near-bar numbers and identify the Point of Control (POC) instantly. Perfect for traders who want clear market structure at a glance. Features: Right Anchored Volume Profile Buy/Sell volume bars Near-bar volume numbers POC (Point of Control) line Customizable colors and display settings
Horizontal Volumes Indicator - using a histogram, displays the volume of transactions at a certain price without reference to time. At the same time, the histogram appears directly in the terminal window, and each column of the volume is easily correlated with the quote value of the currency pair. The indicator practically does not require changing the settings, and if desired, any trader can figure them out. The volume of transactions is of great importance in exchange trading, usually an inc
GoldenX Entryは、MT5向けのインジケーターであり、適応型Smart Entry Trendアルゴリズム、シグナルスコアリングシステム、マーケットレジーム検出機能、およびボラティリティフィルターを備えています。各シグナルには、計算されたエントリーレベル、3つのテイクプロフィット(TP1、TP2、TP3)、およびストップロスレベルが含まれます。本インジケーターは、異なる市場環境に適応するために設計された複数の分析レイヤー上に構築されており、マルチレイヤー分析システムと内蔵オプティマイザーおよび統計トラッキングシステムを組み合わせています。リスク・リワード(RR)指標および過去のトレード履歴に基づく定量分析を提供します。 使い始めは簡単です — 選択した時間足でオプティマイザーを実行し、そのままチャート上でインジケーターを使用します。 コア機能 GoldenX Entryは、シグナルエンジンとトレード管理機能、そして過去統計トラッキングを1つのチャートに統合しています: - 内蔵オプティマイザー: オプティマイザーはチャート上でワンクリックで実行できます。200通りのパラメー
RITZ QUANTUM PULSE Next-Generation Economic Intelligence System Ritz Quantum Pulse — Next-Gen Economic Intelligence System. Experience quantum-level precision in news trading: real-time event detection, AI-powered filtering, and temporal synchronization. Anticipate volatility before it happens — not after. Where Market Intelligence meets Temporal Physics. Ritz Quantum Pulse   represents the convergence of   quantum logic ,   AI-driven analytics , and   real-time economic intelligence . This is
FREE
50% Off Today Only! Price Goes Back Up at 11 PM (EST) uGenesys Volume Indicator: Your Key to Mastering Market Volume Analysis What Traders Are Saying: "A must-have indicator...really a game-changer." – wuzzy66 "Amazing indicator...strongly recommend to beginners." – joinbehar Understanding Market Volume:   Volume in the market is a critical indicator of movement and opportunity. The uGenesys Volume Indicator is specially crafted to pinpoint when the market has the most volume, allowing you to
Please feel free to leave an honest review after downloading so that I can continuously improve the indicator—thank you! AUREVYNE Session Liquidity See where session liquidity is resting — and recognize when it gets swept. AUREVYNE Session Liquidity is a clean and focused MT5 indicator designed to visualize the most important liquidity levels of the Asia and London sessions. The indicator automatically displays session highs and lows, monitors their current state and marks confirmed liquidit
Smart Volume Profile
Mattia Impicciatore
4.69 (13)
Smart Volume Profile は、2 本の縦線の間で出来高分布をリアルタイムに計算・表示するプロフェッショナルなインジケーターです。買いと売りを分割表示し、POC・VAH・VAL レベルも描画します。裁量取引にもシステム取引にも対応し、市場がどの価格帯で最も多く取引されたか、そして買い手と売り手の力関係がどのように分布しているかを確認できます。 このインジケーターを選ぶ理由 分析期間を完全にコントロール — 2 本のドラッグ可能な VLINE で範囲を定義。 買いと売りの分割表示 — 専用カラーでどちらが主導しているか一目で把握。 POC・VAH・VAL の機関投資家レベル — 明確に描画され常に更新。 最適化されたパフォーマンス — ティックデータを使用し、利用できない場合はスマートな代替処理。 アダプティブ表示 — プロファイル幅をチャートサイズに比例させて高い可読性を維持。 動作方法 VP begin と VP finish という 2 本の VLINE を描画して時間範囲を設定します。インジケーターは価格レベルごとの出来高を、設定可能な数のバケットに集計します。取引
FREE
Market Profile Osw MT5
William Oswaldo Mayorga Urduy
ユーザーマニュアル:Market Profile Osw Market Profile Oswは、特定の期間におけるボリュームと価格の分布を可視化する高度なオークション分析ツールです。従来のローソク足チャートとは異なり、このシステムは最も活発な取引が行われた場所を明らかにし、実際の市場参加に基づいた心理的なサポートおよびレジスタンスゾーンを特定することを可能にします。 1. パラメータガイド(入力メニュー) 全般設定 Show Market Profile: チャート上のプロファイル表示を有効または無効にします。 Volume Type: 価格変動回数(ティック)または実際の取引ボリューム(特定のブローカーおよび銘柄で利用可能)のいずれかでアクティビティを測定するかを選択します。 Look Back Bars: 現在のプロファイルを構築するために指標が何本のローソク足を遡るかを定義します。 Profile Right Side: プロファイルを価格軸の隣(右側)に描画するか、分析期間の開始点(左側)に描画するかを決定します。 Seconds Refresh: 指標がデータを更新し、
A Market Profile (time price opportunity) implementation with an option to mark a point of control (POC) based on   volume   . Config: Hide default candles. Select a session time using exchange timezone. Experiment with tick multiplier value to achieve desired level of detail. Choose the symbols of your choice, e.g. squares or A-Z chars. For multiple sessions you will have to add additional instances of this script with a different time configuration. Limitations: TradingView has a hard limi
Volume Arrow Scanner MT5 The Volume Arrow Scanner is a professional multi-timeframe trend and momentum indicator designed to identify high-probability buying and selling opportunities by analyzing market direction, momentum changes, and crossover events. It displays all trading signals directly on the price chart, allowing traders to quickly identify potential entries and exits without using a separate indicator window. Key Features Multi-Timeframe Trend Analysis The indicator can analyze price
FREE
Automated Anchored Volume Weighted Average Price You set a period, and the indicator will find the highest and lowest price point in the period and derive a AVWAP from there. It also prints out a median line. You can use the generated VWAP lines as a channel, as S/R levels or as a volatility indicator. It's based on tick volume to be compatible with most CFD brokers. Happy trading!
Poc volume honeyflow
Ali Abdalrasool Ai-sayyd Sobai
POC Highlighter - Volume Profile Indicator This indicator displays the Volume Profile and clearly marks the Point of Control (POC) with a prominent yellow horizontal line. The POC represents the price level with the highest traded volume within the visible chart range or selected period. Key Features: - Automatic calculation and display of Volume Profile histogram at the right side of the chart. - Highlights the POC level with a customizable yellow line (default: solid yellow). - Adjustable p
Sentinel PRO — RixiRooによるエクイティプロテクター エクイティ保護の最終形。 Sentinel PRO は Sentinel の完全版です。 資本保護には上限がありません。購入前に試してみたいですか? 無料版をご覧ください Sentinel Equity Protector Mini MT5 たった一度のミスが、マージンコールにつながることもあります。 SentinelはAuthorootyであなたのエクイティを保護します。 エクイティが設定値を下回ると、Sentinelが完全停止を実行します。 Sentinelが行うこと: すべてのアクティブなポジションをクローズします。 すべての未約定注文をクローズします。 すべての開いているチャートを閉じ、他のEAを無効化します。 。 プッシュ通知を送信します(有効化されている場合)。 Sentinelを使う理由: 入力は1つだけ:EquityToProtect 複雑な設定は不要 ― プラグインしてすぐに保護 。 高速かつ信頼性重視の設計 。 バックグラウン
ClaroFxAlgo Candle Countdown Timer – MetaTrader 5 Indicator Overview CandleCountdownTimer is a powerful yet lightweight MT5 indicator that displays dynamic countdowns to the next candle close, helping traders gain precise timing awareness across all timeframes. Its sleek, customizable design ensures critical timing data is visible—without cluttering your charts. Key Features ️ Main Timer Display – Live countdown to the next candle close on current timeframe Multi-Timeframe Panel – View
FREE
The "MR Volume Profile 5" indicator is a charting tool that displays trading volume at different price levels rather than time intervals. A key concept in volume profile is the point of control (POC)—the price level with the highest volume traded during the session or time range. While tools like VWAP or OBV provide volume trends, the "MR Volume Profile 5" indicator offers granular detail about where the most market activity occurs at specific price levels. This makes it a more precise tool for
MTForge Volume AI
Hyumilkumar Suryakantbhai Patel
MTForge Volume AI — User Guide This indicator gives you a real-time dashboard on your chart that breaks down volume into buying and selling pressure, so you can see who's in control — buyers or sellers — at both the daily session level and the individual bar level. SESSION Row — This always shows the full day's picture. It tells you what percentage of today's total volume is buying vs selling, the actual buy and sell volume numbers, the delta (difference between buy and sell), and how imbalance
FREE
CONTACT AND SUPPORT At TPFX, we understand that every trader has unique requirements and that efficiency is the key to success. Therefore, I cordially invite you to send me a private message regarding any questions, functional errors, or needs for personalized adjustments. I am committed to providing fast and decisive technical assistance, ensuring your tool is always in perfect condition. Personalized adjustments to adapt the system to your specific strategy can be made at no additional cost
Moving Average Distance Indicator The “Moving Average Distance Indicator” calculates the difference between the instrument's price and the moving average of your choice, showing this difference in percentage values ​​or in price. In other words, it indicates how far the price is from the moving average. What is it for? The great advantage of this indicator is the ease to compare movement expansions that occurred in the past, at different price levels, as the indicator works in a levelled wa
OB FVG Trade Copier: Unified Master & Slave EA Version: 2.00 Type: Trade Copier / Risk Management Utility Compatibility: MetaTrader 4 & MetaTrader 5 (Cross-compatible codebase) Overview The OB FVG Trade Copier is a professional-grade, unified trade copying system designed to mirror trades between Master and Slave accounts seamlessly. Built with a unified architecture, a single EA file serves as both the sender (Master) and receiver (Slave) simply by toggling the EA Mode in the settings. It uti
FREE
MT4 バージョン: https://www.mql5.com/ja/market/product/157433 MT5 バージョン: https://www.mql5.com/ja/market/product/167286 出来高インバランスは、設定可能なルックバックレンジ内で、活発な価格帯、方向性のプレッシャー、そして「空」の価格帯を特定できるように設計された、軽量な出来高プロファイルとデルタ・インバランスの可視化ツールです。 総出来高のみを表示する従来の出来高プロファイルとは異なり、このインジケーターは各価格帯を以下のように分割します。 ブル出来高(買い圧力) - 強気のローソク足(終値 > 始値)から推定 ベア出来高(売り圧力) - 弱気のローソク足(終値 ≤ 始値)から推定 その結果、チャート右側にTradingView風のすっきりとしたプロファイルが描画され、さらにデルタ・サマリー・パネルには価格帯全体の不均衡率(Δ%)が表示されるため、買い手と売り手が優勢な場所を簡単に特定できます。 また、ゼロ出来高ゾーン(選択したルックバックレンジ内で出来高がゼロの価格帯)も強
Atlantis Pro Indicator — ティック単位の市場分析とポートフォリオ戦略を両立 Atlantis Pro Indicator は、リアルタイムのティックデータを駆使して、重要な価格帯と高確率の反転ゾーンを高い精度で捉える多機能インジケーターです。市場のすべてのティックを連続的に解析し、買い/売り圧力の転換点を正確に見極め、チャート上に鮮明な Buy/Sell の矢印を即座に表示 — デフォルトで可視化され、すぐに行動可能です。 Atlantis Pro は あらゆる時間足・銘柄 に対応し、FX、株式、商品、指数、暗号資産など幅広く活用可能です。本当の強みは複数銘柄を 同時に監視・活用 できること。複数のシンボルで最適なエントリー・イグジットを同時に捉え、 分散ポートフォリオ を構築してリスクを分散し、安定した利益を目指せます。 単一のチャートや銘柄に縛られず、相関性のある・ない市場を横断してシグナルをキャッチすることで、自然なヘッジが効き、利益のブレを抑制。マルチ銘柄対応で、より精度の高いポートフォリオ収益を確保し、市場の変動にも揺らがない安定性を支えます。 スキャ
place a vwap line starting from the line placed on the chart parameters: tick_mode: enable to use ticks instead of bars. this uses a lot more cpu processing power prefix: prefix to add for line created by indicator line_color: set the color of the line created line_style: set the line style of the line created applied_price: set the price of bar to use of the bar std_dev_ratio: set the multiplier for the std dev channel
The Institutional Flow Sentinel (Net Sentiment Volume AKA NSV) SEE VOLUME HAPPENING ON THE GO!!!!!!! Overview Retail traders look at price. Institutions look at order flow . The Institutional Flow Sentinel is a high-precision algorithmic system designed to decode the hidden battle between buyers and sellers. By analyzing real-time volume delta and identifying supply/demand imbalances, this system allows you to stop guessing and start trading with the "Smart Money." Why Order Flow? Price charts
With Fixed Range Volume Profile,The traces left by the big players will not go unnoticed by you. Professional   Volume Profile   Indicator reveals Institutional order flow. This advanced market indicator will teach you to spot the buying and selling. Dont want to say more because its well known by most professionals  trader. This Indicator : -  Quickly Identify the Strongest Institutional S/R Zones. - W orks with all Trading Instruments (Forex, Futures, Indexes, Commodities, Stocks, Cryptocurr
このプロダクトを購入した人は以下も購入しています
この製品は 2026 年の市場向けに更新され、最新の MT5 ビルドに最適化されています。 価格更新のお知らせ: Smart Trend Trading System は現在 $99 で提供されています。 次の 30 件の購入 後、価格は $199 に上がります。 特別オファー: Smart Trend Trading System を購入後、私にプライベートメッセージを送ることで、 Smart Universal EA を無料 で受け取り、Smart Trend のシグナルを自動売買に変えることができます。 Smart Trend Trading System は、リペイントなし、再描画なし、遅延なしの完全なトレーディングシステムです。よりクリーンなシグナル、より明確なトレンド方向、そしてより整理された取引方法を求めるトレーダー向けに作られています。 Learn Smart Trend Trading System Everything you need to learn, install, and use the product is available here: Online
Trend Sniper X
Sarvarbek Abduvoxobov
4.88 (32)
Trend Sniper X は、トレードの方向性と潜在的な反転ポイントを明確かつ正確に特定するのに役立つ、MetaTrader 5 用のマルチタイムフレーム・トレンドフォロー指標です。 MT4用: https://www.mql5.com/en/market/product/193245 価格情報: 現在の価格はプロモーション価格であり、今後のアップデートや新機能のリリースに伴い変更される場合があります。 ボーナス特典: このインジケーター用の無料自動売買アシスタントEAを入手するには、購入後に an 著者(開発者)へメッセージをお送りください。 Code2Profit チャンネル マルチタイムフレーム分析で相場をマスターしよう! Trend Sniper X で勝率を最大化する方法:重要なルールとセッションのコツ 技術仕様 プラットフォーム MetaTrader 5 インジケータータイプ マルチタイムフレーム・トレンドインジケーター 操作タイムフレーム あらゆるチャートタイムフレームに対応。個別に選択可能な上位タイムフレーム (M1–MN1) を搭載 主要銘柄 FX、ゴールド (X
Neuro Poseidon is a new indicator by Daria Rezueva. It combines precise trading signals with adaptive TP/SL levels - creating best possible trades as a result! Message me and get  Neuro Poseidon Assistant  as a gift to automize your trading process! What makes it stand out? 1. Proven profitability on all assets and timeframes 2. Only confirmed BUY and SELL signals present on the chart 3. Adaptive TP & SL levels generated by the software for each trade 4. Easy to understand - suitable for al
UNIX Scalper — Gold Scalping Indicator for MetaTrader 5 UNIX Scalper is a focused Gold scalping indicator designed primarily for XAUUSD on M1, M2, M3, M5, M10 and M15. It gives the trader a clear BUY, SELL or WAIT decision together with the complete trade plan: Entry, Stop Loss, TP1 and TP2 . The concept is simple: wait for the signal, follow the levels, move the Stop Loss to Break Even after TP1, and trade with discipline. Learn UNIX Scalper Everything you need to learn and use the product is
Gann Made Easy   は、ミスター・ギャンの理論を使用した取引の最良の原則に基づいた、プロフェッショナルで使いやすい外国為替取引システムです。 W・D・ガン。このインジケーターは、ストップロスとテイクプロフィットレベルを含む正確な買いと売りのシグナルを提供します。 PUSH通知を利用して外出先でも取引可能です。 ご購入後、取引方法の説明と優れた追加インジケーターを無料で入手するには、私にご連絡ください! おそらく、ギャンの取引手法についてはすでに何度も聞いたことがあるでしょう。通常、ギャンの理論は初心者のトレーダーだけでなく、すでにある程度の取引経験がある人にとっても非常に複雑なものです。なぜなら、ギャンの取引手法は理論的にはそれほど簡単に適用できるものではないからです。私はその知識を磨き、最良の原則を私の外国為替インジケーターに組み込むために数年を費やしました。 このインジケーターは非常に簡単に適用できます。必要なのは、それをチャートに添付し、簡単な取引推奨事項に従うだけです。このインジケーターは常に市場分析の仕事を行い、取引の機会を探します。適切なエントリーポイントを検
UZFX {SSS} スキャルピング・スマートシグナル v5.0 MT5は、変動の激しい市場において正確かつリアルタイムのシグナルを求めるスキャルパー、デイトレーダー、スイングトレーダー向けに設計された、リペイントのない高性能な取引インジケーターです。(UZFX-LABS)によって開発されたこのインジケーターは、価格行動分析、トレンド確認、スマートフィルタリングを組み合わせることで、すべての通貨ペアおよび時間枠において、高確率の売買シグナル、警告シグナル、トレンド継続の機会を生成します。 トレードの判断に迷うのはもうやめましょう。明確さ、正確さ、そして規律ある市場執行を求めるトレーダーのために設計された、体系的なシグナルシステムに従い始めましょう。 間違いなく、MQL5で入手可能な最高のインジケーターの一つです。絶対に見逃さないでください!!「スマートなトレーダーのためのスマートシグナル」 最新バージョン5.0がリリースされました。価格は予告なく最大499.99ドルまで値上がりする可能性がありますので、チャンスを逃さないようお早めにお求めください!! 購入を決める前に!無料トライアル
この製品は 2026 年の市場向けに更新され、最新の MT5 ビルドに最適化されています。 価格更新のお知らせ: Atomic Analyst は現在 $99 で提供されています。 次の 30 件の購入 後、価格は $199 に上がります。 特別オファー: Atomic Analyst を購入後、私にプライベートメッセージを送ることで、 Smart Universal EA を無料 で受け取り、Atomic Analyst のシグナルを自動売買に変えることができます。 Atomic Analyst は、リペイントなし、再描画なし、遅延なしの Price Action トレーディングインジケーターで、手動取引、シグナルの明確化、EA 自動化のために設計されています。 User manual: settings, inputs and strategy.   &   User Manual PDF . 価格行動、強さ、モメンタム、マルチタイムフレーム方向、高度なフィルターを分析し、トレーダーがノイズを減らし、弱いセットアップを避け、より構造化された取引判断を行えるようにします。 このイ
伝説が帰ってきました:Entry Points Pro 10。 MQL5 Marketのトップ3に3年間入り続けた伝説的インジケーターの再始動です。 2つのバージョンで合計589件の高評価レビュー、毎日数千人のトレーダーが実際のトレードに使用し、デモのダウンロードは31,000件以上   MT4+MT5 。 私はこの5年間に寄せられたレビューをすべて読み、約束を並べる代わりに、その答えをバージョン10に組み込みました。1999年から相場に携わり、 誠実さ、自らの評判、そして顧客を大切にする 作者による製品です。 Entry Points Proのエントリーシグナルは、リペイント(再描画)を一切行いません。 そして今回初めて、これは作者の言葉ではなく検証可能な事実になりました。確定シグナルはローソク足の終値確定後にのみ表示され、自動テストで リペイントはゼロ と確認されています(EURUSD、XAUUSD、BTCUSDで2,486,568回の不変条件チェック、違反0件)。検証方法は公開されており、ストラテジーテスターでご自身で再現できます。 ご購入後は、必ずすぐにダイレクトメッセージでご
M1 SNIPER は使いやすいトレーディングインジケーターシステムです。M1時間足向けに設計された矢印インジケーターです。M1時間足でのスキャルピングのためのスタンドアロンシステムとして、また既存のトレーディングシステムの一部としても使用できます。このトレーディングシステムはM1時間足での取引に特化して設計されていますが、他の時間足でも使用できます。元々、この手法はXAUUSDとBTCUSDの取引用に設計しましたが、他の市場においても役立つと考えています。 インジケーターのシグナルは、トレンドの方向と逆方向に取引できます。インジケーターのシグナルを利用して両方向に取引するのに役立つ特別な取引テクニックをご紹介します。この手法は、特別な動的なサポートとレジスタンスの価格帯を利用することに基づいています。 ご購入後、M1 SNIPER矢印インジケーターをすぐにダウンロードできます。さらに、M1 SNIPERツールのすべてのユーザーに、以下のスクリーンショットに表示されているApollo Dynamic SRインジケーターを無料で提供しています。この2つのインジケーターを組み合わせることで
通貨強さウィザードは、取引を成功させるためのオールインワン ソリューションを提供する非常に強力な指標です。このインジケーターは、複数の時間枠のすべての通貨のデータを使用して、このまたはその外国為替ペアのパワーを計算します。このデータは、使いやすい通貨インデックスと通貨パワーラインの形式で表され、特定の通貨のパワーを確認するために使用できます。 必要なのは、取引したいチャートにインジケーターを接続することだけです。インジケーターは、取引する通貨の実際の強さを示します。このインジケーターは、トレンドに合わせて取引するときに有利に利用できる売買高の圧力の極値も示します。このインジケーターには、フィボナッチに基づく可能なターゲットも表示されます。 このインジケーターは、PUSH 通知を含むあらゆるタイプのアラートを提供します。 購入後ご連絡下さい。私の取引のヒントをあなたと共有し、素晴らしいボーナスインジケーターを無料で提供します! 幸せで有益な取引をお祈りします。
GEM Signal Pro GEM Signal Pro は、MetaTrader 5 向けのトレンドフォロー型インジケーターです。より明確なシグナル、より整理されたトレードセットアップ、そして実用的なリスク管理をチャート上で確認したいトレーダーのために設計されています。 単純な矢印だけを表示するのではなく、GEM Signal Pro はトレード全体の考え方を、より見やすく分かりやすい形で表示します。条件が確認されると、インジケーターはエントリー価格、ストップロス、利確目標をチャート上に表示し、トレードセットアップをより効率的に確認できるようにします。 動作の仕組み このインジケーターは、まず内部ロジックに基づいて有効なシードシグナルを検出します。 確認条件が満たされると、GEM Signal Pro はチャート上に完全なセットアップを表示します。これにより、トレーダーはトレード構造をより明確に把握し、手作業による分析を減らすことができます。 チャート上のトレードレベル 確認済みシグナルに対して、GEM Signal Pro は以下を表示できます。 エントリー価格 ストップロス テ
Scalper Vault は、スキャルピングを成功させるために必要なすべてを提供するプロフェッショナルなスキャルピング システムです。このインジケーターは、外国為替およびバイナリー オプションのトレーダーが使用できる完全な取引システムです。推奨される時間枠は M5 です。 システムは、トレンドの方向に正確な矢印シグナルを提供します。また、トップとボトムのシグナルとギャン マーケット レベルも提供します。 インジケーターは、プッシュ通知を含むすべてのタイプのアラートを提供します。 インジケータの購入後にご連絡ください。私の個人的な取引の推奨事項と素晴らしいボーナス指標を無料で共有します! 幸せで有益な取引をお祈りします!
このインジケーターを購入された方には、以下の特典を 無料 で提供しています: 各トレードを自動で管理し、ストップロスとテイクプロフィットを設定し、戦略ルールに基づいてポジションを決済する補助ツール 「Bomber Utility」 様々な銘柄に合わせたインジケーターの設定ファイル(セットファイル) 「最小リスク」、「バランスリスク」、「待機戦略」 の3つのモードで使用できる Bomber Utility 用の設定ファイル このトレーディング戦略をすぐに導入・設定・開始できる ステップバイステップのビデオマニュアル ご注意: 上記の特典を受け取るには、MQL5のプライベートメッセージシステムを通じて販売者にご連絡ください。 オリジナルのカスタムインジケーター 「Divergence Bomber(ダイバージェンス・ボンバー)」 をご紹介します。これは、MACDのダイバージェンス(乖離)戦略に基づいた 「オールインワン」型のトレーディングシステム です。 このテクニカルインジケーターの主な目的は、価格とMACDインジケーターの間に発生するダイバージェンスを検出 し、将来の価格の動きを示
SR Liquidity は、市場の流動性が集中し、価格が最も強く反応する「隠れたゾーン」を可視化するために設計されたトレーディング指標です。こうした流動性の高いエリアは強力なサポート(支持)およびレジスタンス(抵抗)レベルとして機能し、市場が反転する可能性が最も高いポイントを明確に示してくれます。 単なる一般的なサポートラインやレジスタンスラインを描画するのではなく、「SR Liquidity」は実際の価格変動を分析し、売りと買いの圧力が集中するゾーンを特定します。これらは、市場の真の動きを牽引する「流動性のプール(溜まり場)」そのものです。それらをチャート上に直接可視化することで、価格が実際に反応する前に、その動きを予測することが可能になります。つまり、このインジケーターは価格の方向性が変わる可能性を予測するのです。生のプライスアクションを、市場の重要な水準(転換点となり得るポイント)を示す、明確で実用的なロードマップへと変換してくれます。 このインジケーターは、FX、株価指数、貴金属、仮想通貨など、あらゆる銘柄や時間足で使用可能です。 ご購入後、取引手順や無料の優れた追加インジケ
SUPERHEROインジケーターは、「オールインワン」方式に基づいて設計された多通貨対応の取引システムです。このインジケーターは市場を独自に分析し、取引の開始および終了のタイミングに関するシグナルを提供します。ストップロス注文とテイクプロフィット注文を使用します。R:R比率は1:1です。 このシステムはスマートフォンにプッシュ通知を送信できるため、PCに縛られることなく「外出先」からでも取引を行うことができます。自己勘定取引を行う企業に最適です。 すべてのお客様への特典: このインジケーターをご購入いただいたすべてのお客様に、私から特別なユーティリティをプレゼントいたします。その内容は以下の通りです: 自動的にストップロス注文とテイクプロフィット注文を発注します 価格が目標水準に達すると、自動的に取引を決済します 指値注文による取引に対応しています 平均化取引モードに対応しています この優れた、しかも非常に便利なユーティリティをプレゼントとして受け取りたい場合は、SUPERHEROインジケーターをご購入後、直ちにMQL5プラットフォームのプライベートメッセージを通じて私までご連絡くださ
M1 Quantum MT5
Hamed Dehgani
4.27 (11)
M1 Quantum を使用したライブトレードシグナル : シグナル (取引は 自動的に Quantum Trade Assistant によって実行され、この製品に 無料 で含まれています。) 最新ニュース: バージョン1.64がリリースされました。現在、すべての取引で、関連するサポート/レジスタンスゾーンの後ろにStop Lossが設定されます。今回のバージョンでは、EAのパフォーマンスを向上させるためにSmart Close機能も改善されました。 8月9日から、ライブシグナルはバージョン1.64で稼働しています。 価格プラン: 現在価格: $169 (早期購入者向けオファー) 次回予定価格: $189 予定小売価格: $299 開発者からのお知らせ: ご購入後、 最新の推奨設定ファイル(Set File) 、運用アドバイス、および他の M1 Quantum ユーザーと交流できる VIPサポートグループ への招待をご希望の場合は、お気軽にご連絡ください。 よくある質問 - 設定ファイル - インストールガイド M1 Quantum は、M1専用のプロフェッショナルトレーディング
Elliott Wave Hunter - SMC Edition Elliott Wave Hunter identifies Elliott Wave 2 and Wave 5 setups and combines them with Smart Money Concepts to filter entries to high-probability zones only. Wave 2 signals mark continuation entries in the direction of the dominant Wave 1 impulse. The indicator waits for the retracement to confirm, locates an Order Block, Fair Value Gap or Liquidity Sweep zone within the impulse, then triggers only when price returns to retest that zone with a qualifying revers
ICT PO3 (Power of 3) AMD Protocol Framework Indicator True Time & Structure Integration   |  Non-Repainting | Real-Time  | Multi-Asset  | MT4 Version Available Full Setup Guide & Strategy Playbook: https://www.mql5.com/en/blogs/post/768683 MT4 Version: https://www.mql5.com/en/market/product/171742 Indicator Overview The ICT PO3 AMD Protocol Framework is a complete structural overlay for MetaTrader 5 that maps the True Daily Cycle directly onto your lower-timeframe execution chart. It project
Trend Forecaster は、ブレイクアウトシグナル、反転の可能性があるエリアの分析、マーケットレンジデータ、視覚的な統計パネルを1つのチャート作業スペースにまとめた MetaTrader 5 インジケーターです。 Buy と Sell シグナルを表示し、Average Range と Current Range を追跡できます。また、現在の銘柄と時間足に合わせて Sensitivity を自動調整できます。Sensitivity の手動設定も可能です。 このインジケーターは、FX通貨ペア、金属、株式、指数、暗号資産で使用できます。複数の時間足に対応しており、M5 は実用的な開始点として使えます。 主な機能 ブレイクアウトと反転エリアの分析 Trend Forecaster は、検出されたエリア付近の価格の動きを分析し、内部のブレイクアウト条件が満たされたときに Buy または Sell シグナルを表示します。このインジケーターは、トレンド継続と反転の可能性があるゾーンの両方を確認するために使用できます。 複数フィルターによるシグナルロジック このインジケーターは、複数の内部
* 主要通貨のデータの信頼性を確保するため、ライブチャートのご利用を推奨いたします。 Get   UEX Reader - Expert Advisor   for free: https://www.mql5.com/en/market/product/166805 UEX Pure USD Euro Index とは: 英語での説明: https://www.mql5.com/en/market/product/152936 Pure USD & Euro Indexで、外国為替市場の真の脈動を探りましょう。 — 世界で最も強力な2つの通貨間の隠れた強みと弱みを真に明らかにする革新的なインジケーターです。 EURUSDのような単一の通貨ペアに頼るのではなく、このツールは複数の主要通貨ペアにわたる米ドルとユーロの総合的なパフォーマンスを測定し、 真の市場センチメントを明確かつバランスよく把握します。 このインジケーターは、すべての主要USDおよびEuroペアのデータを組み合わせることで、 真の通貨変動を反映した同期インデックスチャートを構築します。 単一の通貨ペア
初心者やエキスパートトレーダーに最適なソリューション! このインジケーターは、独自の機能と新しい計算式を取り入れた、ユニークで高品質、かつ手頃な価格のトレーディングツールです。たった1枚のチャートで28の為替ペアの通貨強度を読み取ることができます。新しいトレンドやスキャルピングチャンスの引き金となるポイントを正確に特定することができるので、あなたのトレードがどのように改善されるか想像してみてください。 ユーザーマニュアルはこちら  https://www.mql5.com/en/blogs/post/697384 これが最初の1本、オリジナルだ! 価値のないクローンを買わないでください。 特別な サブウィンドウの矢印で強い通貨の勢いを表示 GAPがあなたのトレードを導く! 基準通貨や気配値が売られすぎ・買われすぎのゾーン(外相フィボナッチレベル)にあるとき、個別チャートのメインウィンドウに警告表示。 通貨がレンジの外側から反落した場合、プルバック/リバーサルのアラート。 クロスパターンの特別なアラート 複数の時間枠を選択可能で、トレンドを素早く確認できます。通貨強度のライン
現在33%オフ 初心者にもエキスパートトレーダーにも最適なソリューション このインジケーターは独自の機能と新しい公式を多数内蔵しており、ユニークで高品質かつ手頃な取引ツールです。このアップデートでは、2つの時間枠ゾーンを表示できるようになります。より長いTFだけでなく、チャートTFとより長いTF(ネストゾーンを表示)の両方を表示できます。すべてのSupply Demandトレーダーの皆さんのお気に召すはずです。:) 重要情報の公開 Advanced Supply Demandの可能性を最大化するには、 https://www.mql5.com/ja/blogs/post/720245 にアクセスしてください。   エントリーまたはターゲットの正確なトリガーポイントを正確に特定できれば取引がどのように改善されるか想像してみてください。新しい基盤となるアルゴリズムに基づいて構築されているため、買い手と売り手の間の潜在的な不均衡をさらに簡単に特定できます。これは、最も強い需要と供給のゾーンと、過去のパフォーマンス(古いゾーンを表示)がグラフィカルに表現されるためです。これらの機能は、最適な
初心者やエキスパートトレーダーに最適なソリューション! このインジケータは、独自の機能と秘密の数式を組み込んだ、ユニークで高品質かつ手頃な価格のトレーディングツールです。たった1枚のチャートで28の通貨ペアのアラートを表示します。新しいトレンドやスキャルピングチャンスの引き金となるポイントを正確に把握することができるので、あなたのトレードがどのように改善されるか想像してみてください! 新しい基本的なアルゴリズムに基づいて構築されているため、潜在的な取引の特定と確認がより簡単になります。これは、通貨の強さや弱さが加速しているかどうかをグラフィカルに表示し、その加速のスピードを測定するためです。加速すると物事は明らかに速く進みますが、これはFX市場でも同じです。つまり、反対方向に加速している通貨をペアにすれば、利益を生む可能性のある取引を特定することができるのです。 通貨の勢いを示す縦の線と矢印は、あなたの取引の指針となるでしょう。 ダイナミックマーケットフィボナッチ23レベルはアラートトリガーとして使用され、市場の動きに適応します。もしインパルスが黄色のトリガーラインに当たった場
Azimuth Pro
Ottaviano De Cicco
5 (7)
Azimuth Pro V2:MT5向けシンセティック・フラクタル構造分析と確認済みエントリー 概要 Azimuth Pro は Merkava Labs によるマルチレベルスイング構造インジケーターです。4つのネストされたスイングレイヤー、スイングアンカーVWAP、ABCパターン検出、3タイムフレーム構造フィルタリング、そして確定バーでの確認済みエントリー — 1つのチャートで、ミクロスイングからマクロサイクルまでを網羅するワークフロー。 これはブラインドシグナル製品ではありません。ロケーション、コンテキスト、タイミングを重視するトレーダーのための構造ファーストワークフローです。 ️ サマーセール — 夏至とThe Oracle Proの発売を記念して、Azimuth Proが30%オフ。現在279 USD(通常399 USD)。期間限定の夏季オファー。 1. V2での変更点 シンセティック・マルチタイムフレームエンジン 上位タイムフレーム分析をMeridian Proと同じ独自のシンセティックアーキテクチャで一から再構築。よりクリーンなHTFコンテキスト、安定したライブ動作、
Precision Spike Detector
Francisco Mandomo Simbine
5 (2)
Precision Spike Detector V3 – Institutional-Grade AI Trading System Attention: The price increases by US$50 for every 10 purchases.  Final price: US$599 Precision Spike Detector V3   is a   state-of-the-art, institutional-grade market analysis system   for   MetaTrader 5 , designed to detect   high-probability market movements   in synthetic indices such as   Boom, Crash, GainX, and PainX . After purchase, send me a private message to receive the optimized configuration files,  the installation
Golden Spike Premium
Kwaku Bondzie Ghartey
5 (1)
Golden Spike Premium Golden Spike Premium is a MetaTrader 5 technical indicator for studying synthetic index charts on the M1 timeframe. It is designed for Boom/Crash indices on Deriv and Gain/Pain indices on Weltrade, depending on the instruments available through the user's broker. Main features Uses Parabolic SAR, RSI, and Bollinger Bands analysis. Three risk modes: Low, Medium, and High. Configurable trade direction: Buy, Sell, or Both. Audio and push notification alerts. Dashboard with sele
SkyHammer Signal Pro Entry、SL、TP レベルを固定表示する、プロ仕様のノーリペイント・トレンドシグナルインジケーター SkyHammer Signal Pro は、明確で固定され、検証可能なシグナルを求めるトレーダー向けに設計された、構造的なトレンド・モメンタム系シグナルインジケーターです。 特に M1 と M5 などの短期時間足で最も効果を発揮します。 このインジケーターは、天井や底を予測するためのものではありません。シグナルを出す前に、確認された市場構造、トレンド方向、モメンタムの強さ、健全なボラティリティ、そしてターゲットまでの十分な値幅を確認します。 主な機能 固定シグナルメカニズム シグナルが確認されると、矢印、Entry、Stop Loss、TP1、TP2 の各レベルはチャート上に永久的に固定されます。 その後のローソク足の動きによって、シグナルが消えたり、移動したり、変更されたりすることはありません。 これにより、トレーダーは各シグナルを明確に確認でき、リアルタイム相場中にシグナルが消えるという一般的な問題を避けることができます。 完全な過去シ
The Oracle Pro
Ottaviano De Cicco
5 (1)
The Oracle Pro:MT5向け合成マルチタイムフレーム・バイアスエンジン ️ サマー・ローンチ・オファー — The Oracle Pro を 199 USD で(早期購入者向け)。価格は普及に応じて上昇します。最終価格 399 USD。 The Oracle Pro は、要求の高いプロのトレーダーのために作られた MetaTrader 5 向けのプレミアム・マルチタイムフレーム バイアスエンジン です。ひとつの問いに規律をもって答えます。すなわち、各タイムフレームの現在の方向バイアスは何か、その強さはどれほどか、そしてタイムフレーム同士はどれだけ一致しているか。すべては確定足のみで計算され、リペイントはありません。 The Oracle Pro はマルチファクター・コンセンサス・システムです。独自のインジケーターと最適化されたアルゴリズムを単一の高度なコンセンサス・ベクトルに統合し、それを単一のインジケーター・インスタンス内で現在足と上位足のスタックにわたって読み取ります。複数のチャートにばらばらのツールを積み重ねる代わりに、です。 これは Oracle コンセンサス手法
Title:FX-AIEA Supply and Demand Zone Indicator (MT5) — Technical Overview Version: 2.51 | Platform: MetaTrader 5 Introduction Supply and demand zones are considered a core manifestation of institutional order flow, providing a more direct reflection of buying and selling pressure than traditional support/resistance levels. This indicator attempts to automate the identification of high-probability supply and demand zones using an adaptive ZigZag algorithm, reducing the subjectivity and time asso
MOST ELLIOTT WAVE TOOLS JUST DRAW LINES. THIS ONE VALIDATES EVERY PATTERN AGAINST THE 3 CARDINAL RULES — OR REJECTS IT. Elliott Wave analysis is one of the most powerful — and most difficult — methods in technical trading. Most indicators fake it. They draw zigzag lines and call them waves without checking a single Elliott Wave rule. Elliott Wave Detector Pro is different. It was built from the ground up to detect, v
作者のその他のプロダクト
The arrow indicator for Forex and Binary options is based on tick volumes. Unlike many volume indicators, the "Super volumes" indicator calculates bullish and bearish volumes and gives signals based on the predominance of any of them. If, say, there was an advantage of bullish volumes in this range at the moment, then the signal will be on Buy. Or if the predominance was bearish volumes, then, accordingly, the signal will be on Sell. In the indicator settings in the "volumes" variable, you can
The indicator for Forex and Binary options is based on 2 standard indicators in MT4: ADX and RVI. The signals are received when the lines of both indicators intersect simultaneously. But the reverse of the signals is also written into the codes. This is when the signals are converted in the opposite direction. You can also enable and disable each of the indicators. And also 2 types of signals can be used in RVI: 1) Just when one line is above/below the other (this is good to use as a recoilles
The arrow indicator "Anaconda LD" is a reversal indicator for the Forex market and mainly for Binary options. The algorithm is written on the basis of reversal patterns. It is better to use it together with other indicators to filter signals. Even with the standard ones in MT4, even with other custom ones. Any channel indicators or level indicators are especially suitable... You need to select your expiration time for different assets. Which are 1-5 bars on different pairs.
The arrow indicator for Binary Options and Forex is a reversal indicator. Created and written on the basis of reversal patterns. It is recommended for Binary Options to put it on the M5 chart. Enter into transactions for 1-3 bars. Depending on the trading sessions, you need to select your expiration time for a different asset.  You can change settings in external variables. Thus, you can both increase and decrease the frequency of signals. The arrows of the indicator do not draw at all. So you
The arrow indicator "Create a cool signal" for the Binary options and Forex market is a kind of constructor of its signals! In which you can choose your own signal conditions based on 10 standard MT4 indicators prescribed in it, plus another third-party buffer indicator that you can add to the "buffer indicators" variable. This is done simply! Prescribe the name of your indicator and prescribe its numbers (you will find them in the colors section where the numbers up to the buffer color are in
バイナリオプションと外国為替"高速道路の利益"の指標は、チャネルラインの背後にある価格を見つけるという原則に基づいています。 価格がチャネルを離れ、徐々にそれに戻り始めた後、信号が表示されます。 そのような指標を取引することは非常に簡単で便利です。 そして、初心者のトレーダーや長年の経験を持つトレーダーでさえ、それを取引することができます。 アセットごとに独自の設定を選択する必要があります。 たとえば、変数"A_Period"に設定されているトレンドのバーを計算するための期間です。 トレンドは、チャネルの中央の線で示されます。 緑の色は購入を意味し、赤い色は販売を意味します。 また、"Range"変数で設定されている異なる取引セッションでチャネル幅を調整する必要があります。 その中のデジタル値が高いほど、チャンネルは広くなります。 さて、下の変数では、便利な矢印と線のパラメータを選択できます。 厚さ、バーからの矢印の距離、それらのコードと色。 矢印はリアルタイムでは描画されません。 彼らはバーからバーにジャンプして消えることはありません。 しかし、タイムスタンプを切り替えた後
矢印インジケーター「クールボリューム」は、Mt4のティックボリュームに基づいています。 インジケータ自体は、一定期間(時間枠の選択)で購入または売却するボリュームの数を追跡します。 そして、売り手または買い手の量が異常に過剰になると、それは売るか買うためのシグナルを与えます。 色付きのヒストグラムは下のウィンドウに描かれており、緑色は現時点での買い手の優位性を示しています。これは、この価格帯で増加する可能性のある即時の逆転を意味します。 逆に、赤い色は売り手の優位性を示しており、これは潜在的な即時の下向きの逆転を意味します。 また、視覚的な利便性のために、矢印がメインチャートウィンドウに直接追加されました。 ユーザーの便宜のために、外部変数には、信号の周波数と履歴(HistoryBars)上のそれらの数の設定変数が含まれています。 ただし、値を1000を超えるように設定することはお勧めしません。 これの多くはあなたの端末のパフォーマンスを遅くします。 また、"===<<矢印設定>>>==="セクションでは、任意の矢印とヒストグラムパラメータを自分で設定することができます。
The Space signals signal indicator is my new development for trading on the Forex and Binary options markets. The algorithm of the indicator is written so that it tracks the trend and gives signals for the end of the corrective price movement. In the settings, you can set the signal period yourself. The higher the value in the "period" variable, the less frequent the signals will be. But they will naturally be of higher quality.  You can also choose the arrow codes on the chart, the distance
The indicator for Forex and Binary Options trading is based on the standard Mt4 Simple Moving Average indicator. But the difference from the standard indicator is that its lines are repainted in different colors depending on the state of the trend. If the color is green, then the trend is to buy. If it's red, then it's for sale. During a trend phase change, an audio alert appears along with a buffer on the chart in the middle of the lines. Thus, it is possible to determine the state of the trend
The new Dynamic PACK Hi Tf indicator is based on tick volumes. The middle line shows the average price for the selected period of the selected senior timeframe. The upper and lower lines show the maximum/minimum of the same selected period of the same timeframe. In the settings, the user can optionally choose which timeframe and bar calculation period he needs. You can also change the style, thickness, and color of each of the lines.  In the "StsrtBars" parameter, you can select the start peri
The Level DELTA indicator for MetaTrader 4 (MT4) – a powerful volume analysis tool that stands out with its capabilities and accuracy. Indicator Description The Level DELTA indicator is designed for volume analysis in a separate MT4 window. Its main task is to identify and display divergences, allowing traders to make more informed and timely decisions. Indicator Features Volume Analysis : The indicator analyzes volumes in financial markets, allowing you to see how volumes are distributed over d
The "Volume POC WVAP" Indicator is a revolutionary tool for traders seeking in-depth analysis across various financial markets. This unique indicator, based on tick volumes in the MT4 terminal, provides indispensable information for making informed trading decisions in the following markets: Forex, binary options, cryptocurrency, spot, futures, and indices. Key Features: WVAP Line: Weighted Volume Average Price: The WVAP calculates the weighted volume average price on the selected timeframe, all
POC, Volume Profile, Market Profile, Volume Indicator, Dynamic POC, Tick Volume, Forex Volume The Dynamic POC Hi Tf Arrow indicator is a reliable volume analysis tool (volume profile, market profile, tick volume) for accurately determining POC levels and price reactions. Dynamic POC Hi Tf arrow for MT4 Description Dynamic POC Hi Tf arrow is a professional volume analysis indicator designed to accurately identify key price levels and market direction. It is built on tick volume data and displ
Quantum Empire GRID PRO - Next Generation Trading System Revolutionary Trading Technology Quantum Empire GRID PRO represents a breakthrough in automated trading, combining intelligent grid strategy with averaging system and signal filtering. After 2+ years of real-market testing, this EA has proven its stability and profitability across various asset classes. Key Features: Smart Averaging System : When closing a series of trades, profit averages 3:1 relative to losses 4 Signal Mode
Volume Profile ASA Professional Volume Profile Indicator for MetaTrader 4 Volume Profile ASA is a modern professional Volume Profile indicator designed for traders who make trading decisions based on real market activity rather than price movement alone. The indicator builds a Volume Profile directly on the chart, displaying the distribution of trading volume across price levels and helping traders quickly identify the most important market areas. Volume Profile ASA automatically calculates and
Golden Rush Robot Pro Professional Trading System for XAUUSD (Gold) An advanced intelligent Grid Expert Advisor specifically designed and optimized for trading Gold (XAUUSD). Why Choose Golden Rush Robot Pro? Most Grid Expert Advisors follow the same simple principle: when the market moves against an open position, another order is opened, then another one, and so on. The entire strategy relies on the expectation that the market will eventually reverse. While this approach can generate profit
Quantum Dynamic POC Hi Tf for MT5 Description: The "Quantum Dynamic POC Hi Tf" is a unique indicator developed for volume analysis. It is suitable for both real volumes (on futures contracts) and tick volumes (on the Forex market). The indicator is a channel tool consisting of three lines that dynamically change depending on the selected timeframe: Middle Line : the main dynamic Point of Control (POC), which reflects the average volume price. Upper Line : the maximum of the selected timeframe. L
The Quantum   DELTA indicator for MetaTrader 5 (MT5) – a powerful volume analysis tool that stands out with its capabilities and accuracy. Indicator Description The Quantum   DELTA indicator is designed for volume analysis in a separate MT5 window. Its main task is to identify and display divergences, allowing traders to make more informed and timely decisions. Indicator Features Volume Analysis : The indicator analyzes volumes in financial markets, allowing you to see how volumes are distribute
Title: MACD Signals Discover the MACD Signals indicator – your reliable assistant in the world of trading! Description: The "MACD Signals" indicator is designed to make your trading more successful and efficient. It displays signals on the main chart as bright vertical lines that are easy to spot. You can customize the color and thickness of these lines to perfectly match your style and preferences. Features: Signals: Vertical lines on the main chart that stand out among other elements.
Quantum Delta VWAP — Профессиональный Анализ Объемов и Order Flow Quantum Delta VWAP — это мощный индикатор нового поколения для MetaTrader 5, разработанный для интрадей-скальпинга и систем Smart Money (SMC/ICT). Благодаря скоростному движку Canvas с двойным шлюзом кэширования, он выводит объемы на экран в реальном времени без задержек, лагов и мерцания . Индикатор идеально подходит для торговли золотом (XAUUSD), валютами, индексами и криптой, позволяя наглядно видеть действия крупных игроко
Quantum Footprint VWAP Pro Quantum Footprint VWAP Pro is a multi-layer market-analysis indicator for MetaTrader 5. It combines candle footprint data, bid/ask delta, VWAP channels, global volume profile, Low Volume Nodes and Fixed Range Volume Profile in one chart workspace. The indicator is designed for traders who want to study how volume is distributed inside price movement, identify important auction levels and observe the interaction between price, VWAP and volume profile structure. It is a
フィルタ:
レビューなし
レビューに返信