PZ Support Resistance MT5
- 指标
- 版本: 7.0
- 更新: 19 七月 2024
- 激活: 20

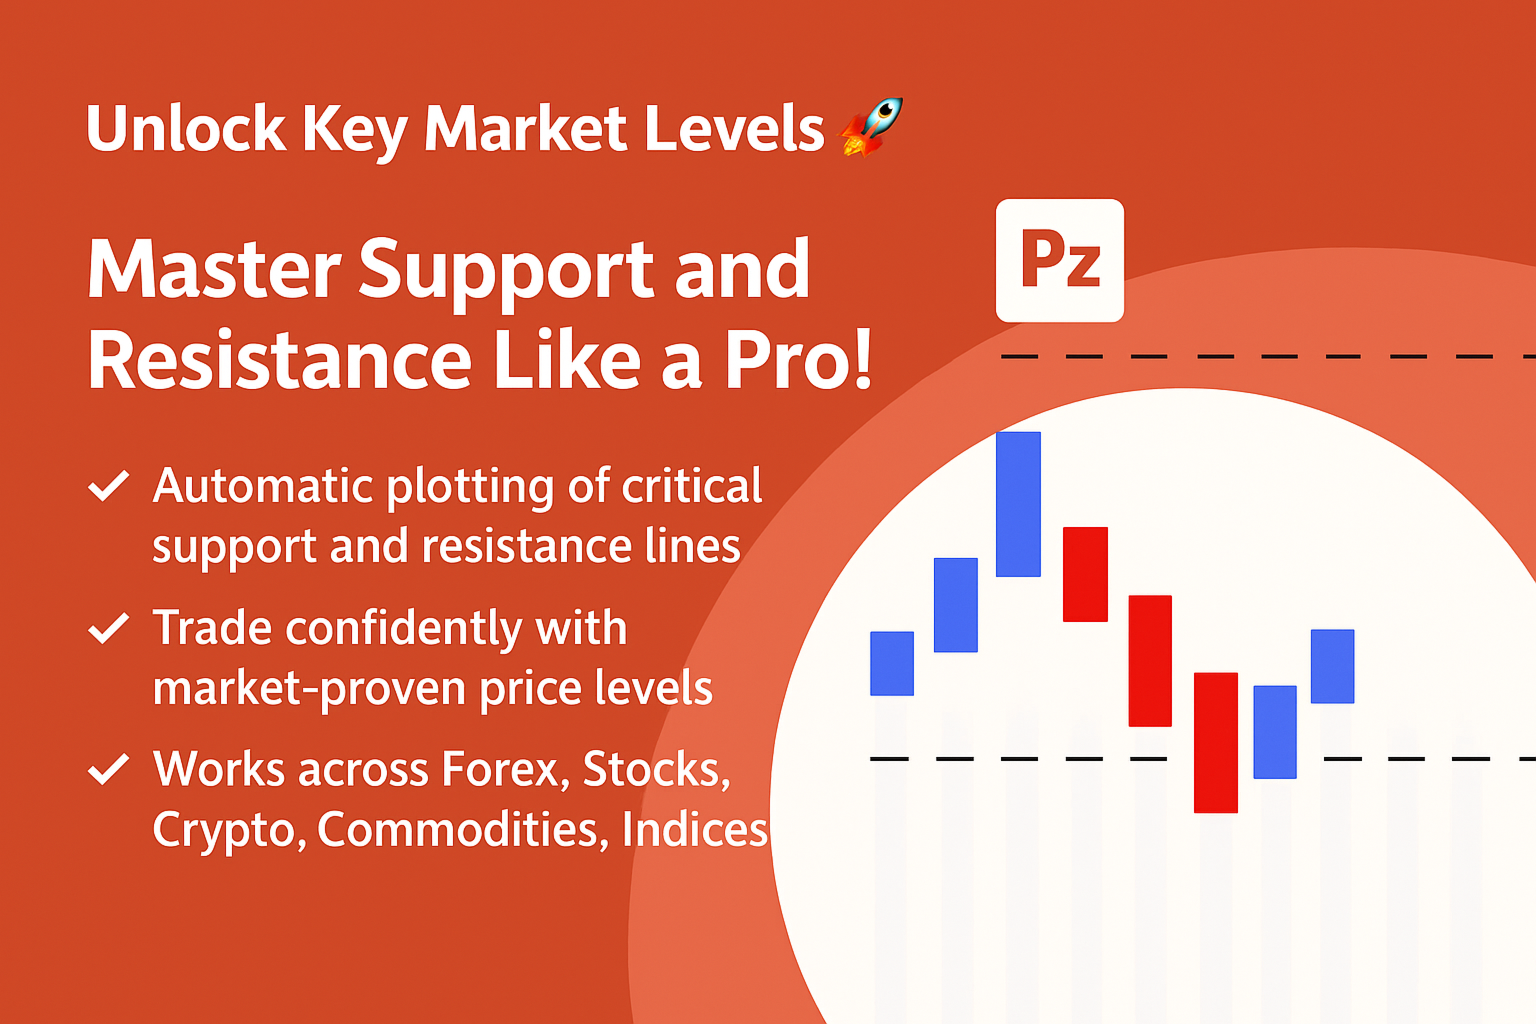
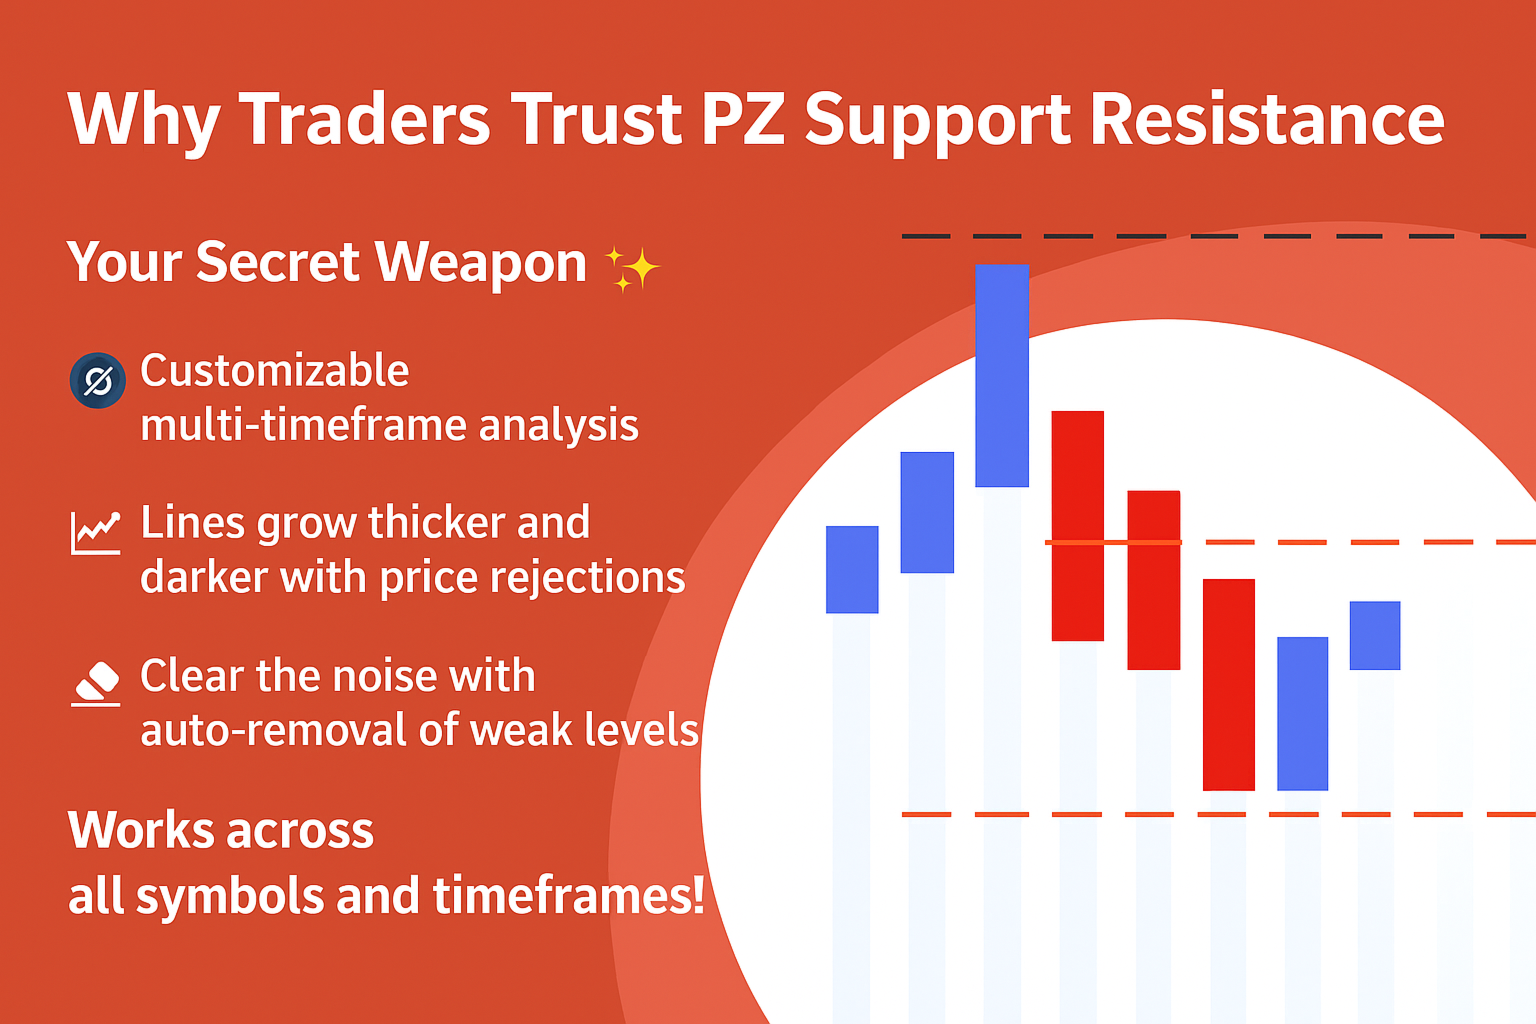
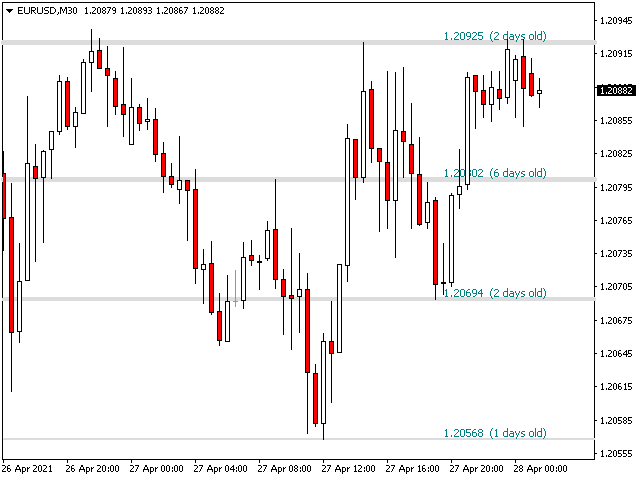
厌倦了绘制支撑线和阻力线? 支撑阻力是一个多时间指标,可以自动检测并绘制图表中的支撑线和阻力线,并具有非常有趣的变化:随着时间的推移测试价格水平及其重要性的提高,线变得越来越粗。
[ 安装指南 | 更新指南 | 故障排除 | 常见问题 | 所有产品 ]
- 一夜之间增强您的技术分析
- 无需浏览图表即可检测重要的价格水平
- 一目了然地识别所有价格水平的相对优势
- 每次交易最多可节省半小时的绘图线
- 指标显示所有价格水平的期限
- 指示器不重涂
过去和现在的价格水平因接近程度而崩溃,并根据当前的市场行为进行了调整。在动作发生的地方绘制了线条,而不一定在峰值处绘制了线条。
- 价格水平随着时间的推移而被拒绝,变得越来越暗
- 定期清除不重要的价格水平以避免噪音
- 可自定义的时间范围选择和崩溃因子
- 它实现了电子邮件/声音/推送警报的突破
输入参数
- 指标设置:指标将从当前时间段读取价格,但您可以选择另一个。例如,您可以在H4图表中显示D1支撑线和阻力线。您还可以使用价格水平密度参数选择在图表上显示多少价格水平。
- 颜色设置:根据重要性输入所需的支撑线和阻力线颜色。
- 标签设置:(可选)可以在指示器中显示用于显示每个支撑线和阻力线寿命的标签。默认情况下禁用此功能。您可以选择标签字体和大小。
- 警报:启用显示/电子邮件/推送/声音警报的突破。
作者
ArturoLópezPérez,私人投资者和投机者,软件工程师,零零点交易解决方案的创始人。

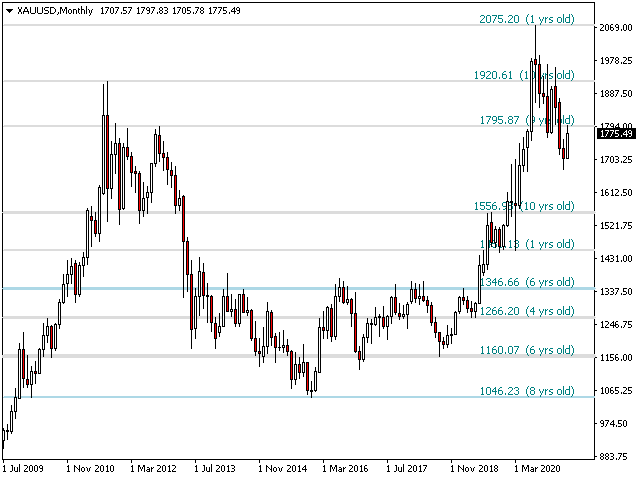
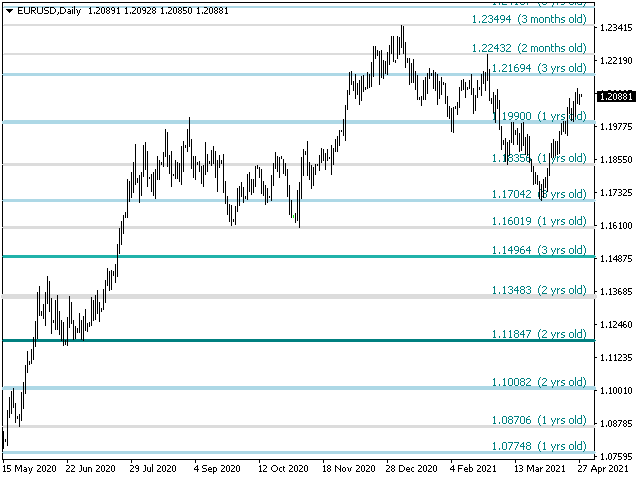

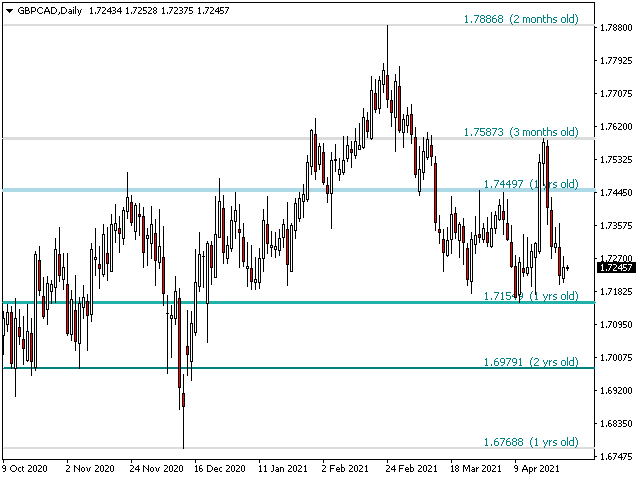
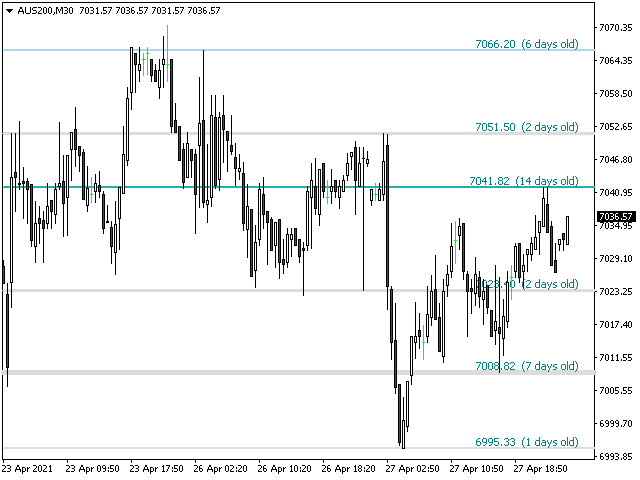
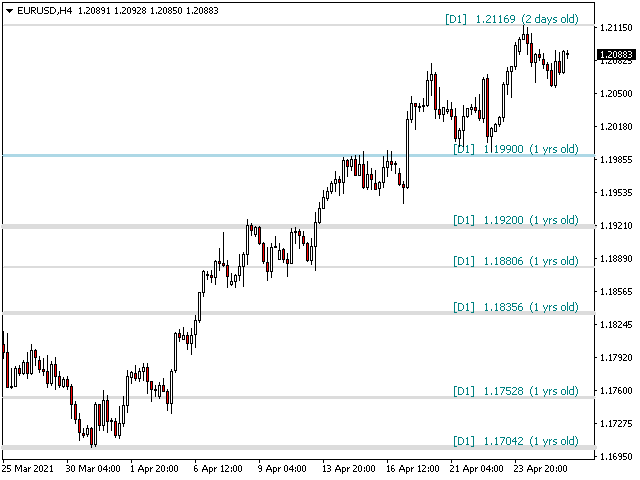
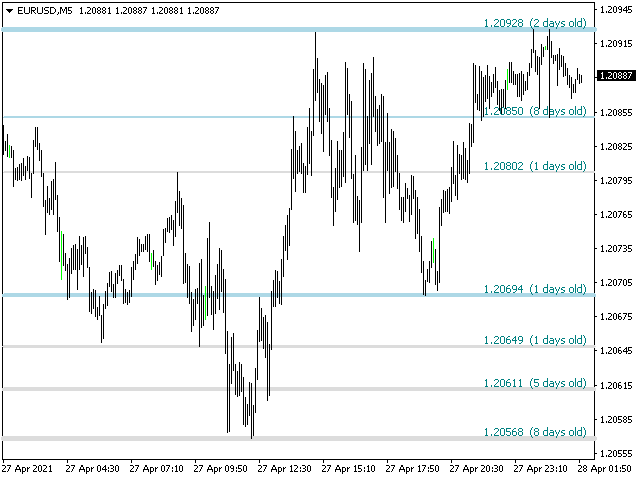
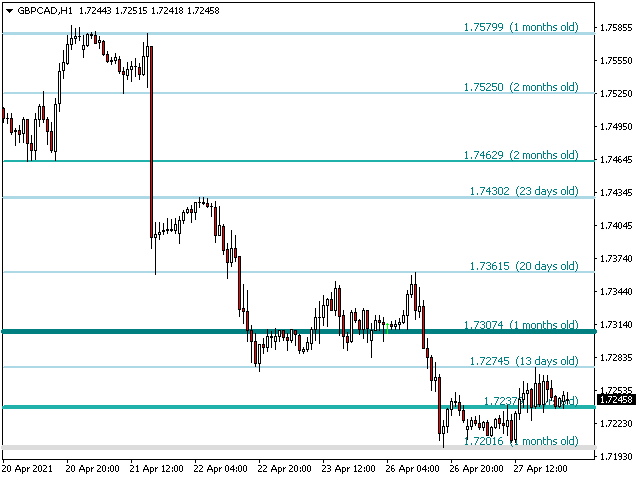


I have bought multiple products from PZ over the past 14 years, they are always well coded and you get excellent support. I had bought the MT4 version of this indicator a number of years ago, with now having transitioned to using MT5, I was missing having this in my charts. I did start having an Mt4 and MT5 platform open, so I could still see the indiactor running and the levels on the charts, then I tried some other S&R indicators, but they don't show the age of the support and/or resistance lines, which is what I really missed. Have a look at the screen shots and you will see on the far right the age, this is really helpful in knowing if you are looking at a new S&R line, or one that has been holding for a long time. I use it on a M5 chart these days, and leave the setting on current, but you can set it to daily if you want to see the larger timeframe lines. If you do this, you will see D1 in text on the S&R line, even if you are looking at and on an M5 chart which is really helpful.