Nemo StatGuard Volatility Regime Filter

Trade only when conditions are normal. Most losing trades are not bad ideas — they are good ideas executed in the wrong volatility regime. StatGuard exists to answer one question before every trade: is this market behaving normally right now, or has it left its statistical range?

▶ WHAT IT DOES

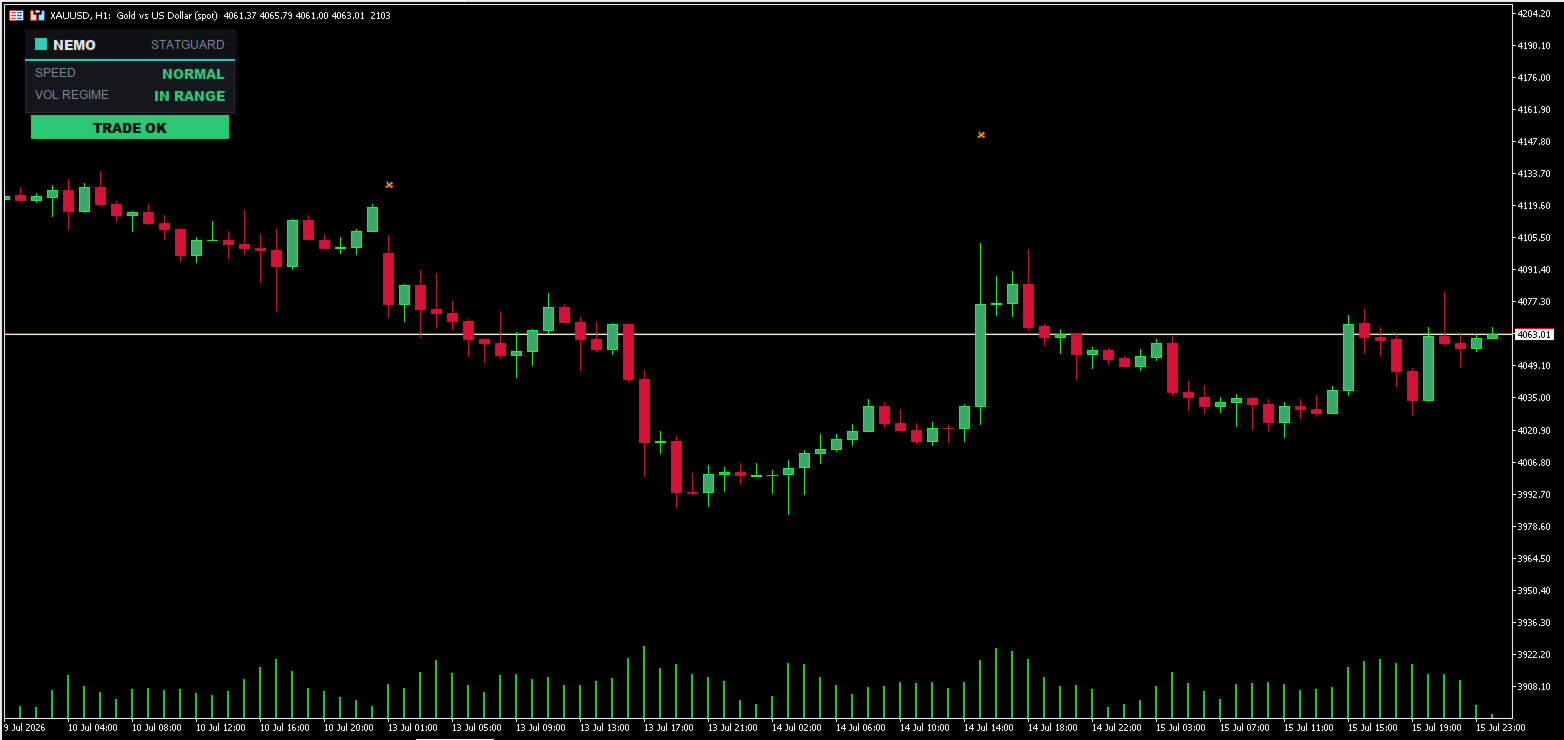
StatGuard continuously reads two objective conditions and gives you a clear verdict on a compact chart panel:

  • SPEED SHOCK — the current bar's range is far above its own historical baseline: an abnormal burst of speed where spreads widen, slippage grows and whipsaw risk spikes.
  • ABNORMAL VOLATILITY REGIME — short-term ATR stretched versus its long-term norm: the market has left its usual behavior.

When either condition fires, the panel shows STAND ASIDE. Otherwise it shows TRADE OK. One glance tells you whether your usual playbook applies — before you commit money.

▶ KEY FEATURES

  • Adaptive to each instrument — the baseline is built from the symbol's own history, not fixed magic numbers. Gold, indices, FX pairs and crypto each get their own norm.
  • Works on any symbol and any timeframe.
  • Compact corner dashboard: Speed, Vol Regime and the verdict at a glance. Position and colors configurable, no chart clutter.
  • Non-repainting: it reads closed statistical data and never redraws history.
  • Pairs with ANY strategy — trend following, mean reversion, breakout, SMC. It does not replace your method; it protects it.
  • Fully auditable rule — every input is adjustable, nothing is a black box.

▶ INPUT PARAMETERS

  • Lookback window — how much history builds the statistical baseline.
  • Deviation threshold — how far the market must stretch to be flagged as abnormal.
  • Panel position and full color settings.

▶ HOW TO USE IT

  1. Drop StatGuard on the chart you trade.
  2. Before every entry, check the panel.
  3. TRADE OK — proceed with your setup as usual.
  4. STAND ASIDE — reduce size, widen stops, or simply skip the trade. Abnormal regimes are where most systems break.

▶ WHAT IT IS — AND WHAT IT IS NOT

We build honest tools. StatGuard is a permission and context filter. It is NOT a signal generator, it does not predict direction, and it makes no profit promise — the rule is fully auditable and the decision is always yours. DEMO included — test it before you buy.

▶ PART OF THE NEMOSYSTEMS FAMILY

NemoSystems indicators share one philosophy: measure what is actually happening, show it clearly, claim nothing that cannot be proven. Check our profile for the full toolkit (trend, structure, volume, liquidity).

▶ SUPPORT

Questions or suggestions? Leave a comment on this page — we answer. Free updates for all buyers.
推荐产品
Trendline Markup
Salavat Bulyakarov
Автомated Trend Line Construction Features: Draws multiple trend lines representing potential price growth/decline boundaries (gray lines) Identifies and draws price channels (green lines) Identifies potential technical analysis triangles (red and blue lines) Recommended: White chart background, Timeframe - M30 Settings: Interval=200   - Maximum number of bars used in the analysis for line construction The_greatest_distance=5000   - Controls the maximum distance from the current bar's price lev
LBR Oscillator
Pablo Filipe Soares De Almeida
LBR Oscillator – 3/10 Oscillator LBR Oscillator 是经典 3/10 Oscillator 的增强版本,该指标由专业交易员 Linda Raschke 广泛使用并推广。 该指标严格遵循 Linda Raschke 使用的原始标准参数:3 周期和 10 周期移动平均线,以及 16 周期信号线,专注于动量读取和市场节奏变化。 概念基础 – Linda Raschke 如何使用 3/10 Oscillator Linda Raschke 将 3/10 Oscillator 作为动量确认工具,而不是简单的自动信号生成器。 主要用途包括: 识别动量的加速与减速 确认趋势中的回调 预判市场短期方向变化 与价格行为、移动平均线和趋势背景结合使用 重点在于柱状图的行为、斜率和方向变化,而不仅仅是机械式的交叉。 柱状图表示快速均线(3 周期)与慢速均线(10 周期)之间的差值: 高于零表示看涨动量 低于零表示看跌动量 柱体的扩展或收缩显示动量的增强或减弱。 高级配色系统(Visual Clarity Mode) 为了提升视觉可读性,增加了智能配色模式: 零轴配
PulseColor
Ivan Simonika
PulseColor Overview PulseColor is an indicator for MetaTrader 5 that visualizes the current dominance of the positive or negative directional indicator ( +DI or -DI ) by coloring the High–Low range of each bar directly on the price chart. The indicator works in the main chart window and does not open an additional subwindow. PulseColor uses the classic Average Directional Movement Index (ADX) calculation. For each bar, the indicator compares the values of +DI and -DI . The stronger component det
# Engulfing Quality Score - Not all engulfings are equal *Category: Pattern Recognition | Difficulty: intermediate | Window: chart window (overlaid on price) | Markets: Universal (Forex, indices, commodities, crypto, stocks) | Suggested timeframes: M15, M30, H1, H4, D1* ## Short description > Checks the engulfing pattern and scores it on four additional criteria, flagging only those exceeding the quality threshold. ## Full description ### Overview The engulfing pattern is among the best k
GoldPro Max
Taher Ahmed Mohamed Taha Elshafei
GOLDPRO MAX Advanced Multi-Timeframe and Smart Money Market Analysis for MetaTrader 5 GoldPro Max is a professional market analysis indicator for MetaTrader 5 designed to help traders study market direction, price structure, liquidity, market imbalance and potential trading areas from multiple perspectives. The indicator combines Multi-Timeframe Analysis, Smart Money Concepts, Market Structure, Liquidity Analysis, Order Blocks, Fair Value Gaps, Premium and Discount analysis, Smart Analytical Eng
An indicator of patterns #39 and #40 ("Rounding Tops" and "Rounding Bottoms") from Encyclopedia of Chart Patterns by Thomas N. Bulkowski. Parameters: Alerts - show alert when an arrow appears  Push - send a push notification when an arrow appears (requires configuration in the terminal) PeriodBars - indicator period   K - an additional parameter that influences the accuracy of pattern shape recognition. Changes from 0 to 1 ArrowType - a symbol from 1 to 17 ArrowVShift - vertical shift of arrows
An indicator of patterns #32 and #33 ("Measured Move Up/Down") from Encyclopedia of Chart Patterns by Thomas N. Bulkowski. Parameters: Alerts - show alert when an arrow appears   Push - send a push notification when an arrow appears (requires configuration in the terminal) PeriodBars - indicator period MinMovment - minimum movement value (in points) BackMovment - maximum value of return movement (as decimals) ArrowType - a symbol from 1 to 17 ArrowVShift - vertical shift of arrows in points   Sh
Spike Detector
Tete Adate Adjete
this indicator is a Spike detector indicator, it is specially designed to trade Boom 1000, Boom 500, Crash 1000 and Crash 500 We recommend using it on Deriv Boom and Crash indices only Its setting is intuitive, familiar, easy to use it has notification functions; audible notifications and push notifications. this tool is simple to use, easy to handle This update is based on different strategies for spikes
Scalping Scale in
Konstantinos Kalaitzidis
“Scalping Scale in”是一款实用工具,专为想要在固定距离的初始位置进行缩放而无需担心 S/L 和 T/P 位置的黄牛而设计,因为剥头皮时每一秒都很重要。 工作原理: 您在 EA 的输入选项卡中设置所需的值,更具体地说,您希望 T/P 放置的风险回报比、您希望 S/L 的宽度(以点为单位)-也是下一个止损订单的距离(位置比例)。您在 MT5 上手动点击“买入/卖出”,EA 会自动设置止损和止盈,同时在相同方向设置新的止损单,距离等于止损(以点数为单位)(即,如果您买入,止损/止损为 5 点,下一个买入止损订单将放置在高于初始入场价格 5 点的位置)。一旦止损挂单被执行,之前的仓位将被追至盈亏平衡点,并且将下达新的止损单,其止损位于之前交易的入场水平。  本质上,这个工具利用了均匀分布的规模来捕捉激进的动作。 输入参数说明: 自动跟踪 - 两个选项:开/关。如果设置为开,则启用自动追踪,并且在触发(输入)的每个新止损订单上,之前的交易将按照刚刚触发的订单的止损水平进行追踪。如果关闭,则不会发生任何事情,但请注意,新的头寸规模不会有 S/L,因此需要用户主动管理! 警报
Resiko
Monita Melyana Sinurat
This tool functions to: 1. Manage Risk - Set SL and TP for all open orders - Close all open orders according to the set risk 2. Manage Orders - This tool also functions as an assistant for Martingale or Grid trading, according to the set order spacing. This tool is ideal for traders who prefer to use Grid or Martingale systems with strict risk management..........
The Smart Fibonacci Entry is an automated structural analysis tool,  detects Break of Structure (BOS) events and automatically anchors a Fibonacci grid to the most relevant swing points. It specifically highlights the ENTRY zone, where institutional buying or selling typically occurs after a trend confirmation. Detection Swing Detection: The script monitors price for structural Swing Highs and Swing Lows based on your chosen pivot length. Fibonacci Direction Shift Recognition : A direction shift
MT5インジケータ TC-Alerts 開発経緯: 実はFXで簡単に勝てる手法があるんです。 それは。。。 主要な(4時間足以上、4時間足、日足、週足)のレジスタンスとサポートラインの反発を狙う FXは一方向には進まず90%以上で 必ず、必ずと言っていいほど、 どこかで反発します 。そこは大抵主要なレジスタンスとサポートラインまたは主要なフィボナッチラインなのです。 なのでそこに水平線を引いて ただ待つ のです。そこに到達したら、1分足や5分足に落として 長いヒゲ、ダブルボトム、ダブルヘッド、トリプルボトム、トリプルヘッド、三尊、逆三尊などの反転の形成を確認してエントリーする。 または、こちらを使用して https://www.mql5.com/ja/market/product/53987 強弱が弱くなってきたのを確認してエントリーすればいいのです。 これだけです。シンプルです!! うまく行くと、長期足レベルでレジスタンスとサポートライン間、つまり頭から尻尾まで取れる可能性もありますし、リスクリワードが異常にいいです。 そのためには、チャートに主要なレジスタンスとサポートラインに
DeepTrade Risk Guard
Yasir Mohammed Sachit Sachit
DeepTrade Risk Guard is an automatic account protector that enforces your trading discipline for you. Most traders don't blow accounts because of bad entries — they blow them by over-trading after a loss and ignoring their daily limits. This tool removes that risk by locking trading the moment your rules are broken.   KEY FEATURES - Daily loss limit (as % of start-of-day balance, or fixed money) - Daily profit target — stop while you are ahead - Maximum trades per day cap - One-click protection
Risk Calculator Drag SL TP
Milos Vukomanovic
3 (1)
150+ downloads and counting - thanks to everyone who's already running it. Risk Calculator is a free MetaTrader 5 tool that removes the manual math from position sizing. Drag the Stop Loss line to where your setup actually invalidates, and the dashboard instantly tells you the correct lot size for your risk — no calculator, no spreadsheet, no guesswork. What it does: - Draggable SL line — drop it exactly where your stop belongs; the tool reads the distance in real time. - Draggable TP line —
FREE
Introducing the Precision Data Extractor: SMA , an MQL5 utility crafted for traders, analysts and quants who need accurate historical data to build robust datasets. This tool lets you selectively pull historical price and indicator data— Simple Moving Average ( SMA )—from multiple applied prices, timeframes, and periods , then stores it in a CSV format, making it easy to feed into machine learning models, trading algorithms, or in-depth market analyses . Compatible with Forex , Stocks , and Comm
Falling wedge MT5
Dmitry Fedoseev
An indicator of patterns #52 and #53 ("Falling/rising wedges") from Encyclopedia of Chart Patterns by Thomas N. Bulkowski. Parameters: Alerts - show alert when an arrow appears   Push - send a push notification when an arrow appears (requires configuration in the terminal) PeriodBars - indicator period K - an additional parameter that influences the accuracy of pattern shape recognition ArrowType - a symbol from 1 to 17 ArrowVShift - vertical shift of arrows in pixels  ShowLevels - show lines C
Long Short Pro
Thalles Nascimento De Carvalho
Long & Short 指标 - Pro 版:解锁无限市场分析潜力! 适用于任何资产的无限制 Long & Short 指标的 Pro 版允许您在任何金融资产上使用,无需再受限 - 将同一指标应用于您所有的首选资产! 无任何限制 享受指标的所有功能,不受任何限制。Pro 版提供完整且无限制的体验,确保您能够最大化每一个市场机会。 Pro 版特点 无限访问 :在所有金融资产上使用指标,探索其全部潜力。 高级精确度 :受益于详细的分析和清晰的信号,以做出明智且安全的决策。 完全灵活 :根据您的具体交易需求调整指标,无论是资产还是策略。 接收关键机会的提醒 启用提醒,密切监控重要水平,确保您始终领先于市场机会。 EA 构建的缓冲区参数 构建 Expert Advisors (EAs) 时,请使用以下缓冲区: 缓冲区符号 1 = 0 缓冲区符号 2 = 2 为什么选择 Pro 版? 完全自由 :将指标应用于任何资产,无限制使用。 完整体验 :享受所有功能和详细分析。 全面分析 :适合那些希望在各种市场中最大化其潜力的交易者。 立
Side Zone
Dayanand Pandey
SideZone: Trend Intensity Oscillator – Filter the Noise, Ride the Trend Overview SideZone is a specialized oscillator engineered to solve a common trader's dilemma: distinguishing between a true trend and a ranging market. By clearly visualizing trend direction and sideways consolidation, SideZone helps you stay on the right side of the move while avoiding the whipsaw of low-volatility environments. Its core function is to provide a clear, color-coded visual representation of market sentiment
JJP Drag Limit Tool
Joachim Johannes Prinsloo
Advanced Trade Panel for MetaTrader 5 This MT5 trading tool adds a sleek, on-chart trade management panel designed to give you full control, clarity, and precision before you enter a trade. With an intuitive interface, you can place limit orders directly from the chart while instantly seeing your risk, reward, and potential profit or loss — all calculated in South African Rands (ZAR) . Key Features: On-Chart Trade Panel A clean, customizable panel that sits directly on your chart for fast decis
Supertrend 趨勢指標 Supertrend 是一款用於判斷市場趨勢方向與趨勢轉換的技術指標,透過市場價格與波動幅度的變化,自動繪製趨勢線,協助交易者快速辨識目前市場偏多或偏空。 當市場趨勢發生改變時,指標會在圖表上顯示對應的 Buy / Sell 訊號 ,讓使用者更直觀地掌握可能的趨勢轉折位置。 此指標適合用於外匯、黃金、指數、加密貨幣等不同市場,也可搭配其他技術分析工具作為交易方向過濾、進場確認或趨勢追蹤使用。 主要功能包含: 自動判斷目前市場趨勢方向 顯示多頭與空頭 Supertrend 趨勢線 趨勢轉換時顯示 Buy / Sell 訊號 ATR 週期可自由調整 ATR 倍數可自由設定 支援不同價格計算來源 可自由開啟或關閉交易訊號 支援趨勢切換提醒 可自訂線條顏色與顯示方式 適用於不同商品與時間週期 Supertrend 可以單獨作為趨勢判斷工具,也可以搭配均線、支撐壓力、價格型態或其他交易策略使用,協助交易者更快速地辨識市場方向與趨勢變化。 注意:本指標僅提供市場分析與交易訊號參考,不代表任何獲利保證。實際交易前建議先進行充分測試,並搭配適當的資金與風險管理。
FREE
Support Resistance Inversion is based on supports and resistance to find the points in which the currency will probably go in a defined direction. Inputs: Alarm ON/OFF: turn on or off alarm on screen. The indicator draws an arrow pointing the direction to follow based on when the price cross or bounce on a support or a resistance. Support Resistance Inversion can help you to choose the moment to do your trades in a specific direction, strengthening your trading strategy.
MetaTrader 5 多品种 SMC 扫描器与面板 这款 Smart Money Concepts 扫描器 读取您的整个品种列表,在同一个 面板 上为每个品种显示一行。每个品种都运行同一套 SMC 引擎:包含 break of structure 与 change of character 的市场结构、订单块、fair value gap 与流动性。每一行显示三个周期的结构趋势、买入或卖出信号、0 到 100 的汇合评分、最近未被回补的 订单块 以及最新的 流动性扫荡 。无需逐个打开图表,您可以在一个矩阵中读取整个自选列表的市场结构,并支持排序、筛选、一键切换图表与提醒。 面板显示什么 每个品种一行,来自您自己的列表:外汇、金属、指数或加密货币 多周期 趋势条:您选定的三个周期的结构趋势并排显示,便于判断短周期与长周期是否一致 信号:仅当已确认的趋势与订单块方向一致、且价格回到该区域时,才显示买入或卖出。这是可执行的形态,不是长期方向,因此多数行不会有信号 质量:0 到 100 的 汇合评分 ,由订单块强度、价格与区域的距离、结构新鲜度、周期一致性与流动性构成 OB Zone:趋势
ChangePeriod MT5
Kazuya Yamaoka
You can change the time period of the chart at the touch of a button. You can also change multiple charts at the touch of a button. You can also change multiple charts at the touch of a button,   saving you the trouble of changing time periods. We are live-streaming the actual operation of the system. Please check for yourself if it is usable. Please check it out for yourself. https://www.youtube.com/@ganesha_forex We do not guarantee your investment results. Investments should be made at you
Optimised Trend Pro
Jean Christophe Paput
Trend indicators on the FOREX market are extremely useful for increasing your ability to open winning positions and for better anticipating market movements. OPTIMISED TREND PRO   is one of these indicators. • SuperTrend PRO is available on MetaTrader 5 (MT5) • Green/Red candles according to the trend, easy to read at a glance • A single arrow at the start of each phase: BUY (green), SELL (red) • The SuperTrend line helps set the stop and follow the position • Usable on all FOREX symbols •
Overview Harmonic Patterns MT5 is a technical analysis indicator designed for the MetaTrader 5 platform. It identifies and displays harmonic price patterns, such as Butterfly, Cypher, Crab, Bat, Shark, and Gartley, in both bullish and bearish directions. The indicator calculates key price levels, including entry, stop loss, and three take-profit levels, to assist traders in analyzing market movements. Visual elements and customizable alerts enhance usability on the chart. Features Detects six ha

Welcome to the Ultimate Harmonic Patterns recognition indicator that is focused to detect advanced patterns. The Gartley pattern, Bat pattern, and Cypher pattern  are popular technical analysis tools used by traders to identify potential reversal points in the market. Our Ultimate Harmonic Patterns recognition Indicator is a powerful tool that uses advanced algorithms to scan the markets and identify these patterns in real-time. With our Ultimate Harmonic Patterns recognition Indicator, you ca
神经学习指标 :将它设置到图表上,让它自动寻找自己的最佳设置。 Neuro Gann AI 是一款适用于 MetaTrader 5 的神经学习信号指标,它完成了大多数工具需要您自己完成的事情。它会研究您当前交易品种的近期历史数据以及实际市场状态,找出能够带来最佳结果的指标过滤器设置、止损和目标距离,并自动为您应用这些设置。切换到另一个时间周期后,它会重新从零开始学习,因此您始终使用的是适合当前图表的交易设置,而不是您猜测出来的数字。 其背后的方法是 W.D. Gann 的价格区间划分。当价格顺应更高时间周期趋势返回到信号区域时,指标会在K线上标记入场点,并绘制入场线、三个目标位以及止损位。它还会通过移动平均线及其通道过滤器确认信号,并为您选择更高时间周期的确认,因此您不必在所有市场中固定使用同一套设置,而是主要跟随趋势进行交易。 经过验证的统计表现(几乎适用于所有资产) M1 - M5 - M15 - M30 - H1,非常灵活,可以同时运行于所有时间周期,以获得更多信号! 在实时交易中自适应调整策略和所有设置,生成具有高胜率的交易,并将所有统计优势掌握在我们这一边 图表上仅显示经过确
Noize Absorption Index
Ekaterina Saltykova
Noize Absorption Index - is the manual trading system that measures the difference of pressure between bears forces and bulls forces. Green line - is a noize free index that showing curent situation. Zero value of index shows totally choppy/flat market.Values above zero level shows how powerfull bullish wave is and values below zero measures bearish forces.Up arrow appears on bearish market when it's ready to reverse, dn arrow appears on weak bullish market, as a result of reverse expectation.
Discipline Trader — Smart Trade Panel for MT5 Trade with a plan, not guesswork. Calculate lot sizes by risk %, place trades with predefined SL/TP, manage positions with one click, and enforce daily and basket loss limits. Includes break-even, partial close, trailing stop, a visual risk monitor and trade journal. You stay in control — the panel helps you stay disciplined. You decide the trade. Discipline Trader helps you size it, protect it and manage it. Whether you trade gold, forex, indices
该产品的买家也购买
Trend Sniper X
Sarvarbek Abduvoxobov
4.9 (41)
Trend Sniper X 是一款适用于 MetaTrader 5 的多周期趋势跟踪指标,可帮助交易者清晰精准地识别趋势方向和潜在的反转点。 适用于 MT4: https://www.mql5.com/en/market/product/193245 价格信息: 当前价格为促销价,随着后续更新和新功能的推出,价格可能会有所变动。 赠品优惠: 购买后联系作者,即可免费获取该指标的 Auto-Trade Assistant EA(自动交易助手 EA)。 Code2Profit 频道 通过多时间框架分析掌控市场! 如何使用 Trend Sniper X 最大化您的胜率:核心规则与交易时段技巧 技术规格 平台 MetaTrader 5 指标类型 多时间周期趋势指标 运行时间周期 任何图表时间周期,可独立选择更高的时间周期 (M1–MN1) 主要交易品种 外汇、黄金 (XAUUSD) 及其他差价合约 (CFD) 推荐账户 任何账户类型 可视化 彩色趋势蜡烛 (买入/卖出/微弱/变化) + 买入/卖出箭头 附加模块 交易时段方框 (悉尼、东京、伦敦、纽约) 主要功能 多时间周期趋势分析: 直接在
Smart Trend Trading System — MetaTrader 5 购买后,请在 MQL5 上给我发消息,即可免费获得 Smart Universal Expert Advisor,以及在线课程、PDF 手册和私人群组访问权限。 STTS 将趋势方向、入场和出场信号、反转区域及重要价格水平集中呈现在图表上。您可以根据系统手动交易,也可以连接单独的兼容 EA,按照您选择的设置自动执行交易。 一套系统,四种交易思路 STTS 将交易方法分为四大类: • 剥头皮交易 — 跟踪短期信号和市场波动。 • 趋势交易 — 评估方向,寻找趋势中的交易机会。 • 反转交易 — 识别潜在的转折区域和方向变化。 • 成交量交易 — 利用成交量相关信息评估市场活跃程度。 入场和出场箭头、趋势信息、支撑与阻力位及反转区域,帮助您直接在图表上分析交易形态。 先从一种方法开始。了解其信号和设置后,再探索其他方法。 从信号到自动化 Smart Universal Expert Advisor 可连接 STTS,让您自动执行受支持的交易信号。 启用自动交易前,请配置指标连接、仓位大小和交易管理设置
SuperScalp Pro
Van Minh Nguyen
4.56 (36)
SuperScalp Pro - Professional Multi-Layer Confluence Scalping System SuperScalp Pro 是一款高级剥头皮交易指标,在经典 Supertrend 的基础上加入了多个智能确认过滤器。它可以帮助您识别概率更高的 Buy/Sell 交易机会,同时显著减少虚假信号。 清晰的 Buy 和 Sell 箭头会直接显示在图表上,基于 ATR 的 Stop Loss 和 Take Profit 水平会实时自动计算。 购买后,请联系我获取设置指导和推荐配置。 使用 SuperScalp Pro Auto Trader 轻松实现信号自动化: [Auto Trader] 下载推荐设置文件: [Set File] 完整文档请参阅产品博客: [User Guide] 加入官方频道获取最新更新: [Official Channel] 您将获得什么 SuperScalp Pro Indicator – 多层级 Buy/Sell 信号,并自动计算基于 ATR 的 Stop Loss 和 Take Profit。 免费 VM Auto SLTP
全新王者降临 - 指标 + 订单管理提示(TP1 + TP2 + TP3)+ 可选 Telegram 信号发送器 INCLUDED(免费) (完整交易与信号系统) 我们最强的黄金 EA: Gold Slayer 该指标包含先进的交易策略、可自定义订单管理系统,以及结合 Envelope 扩展的均值回归系统,并通过 RSI 等多重智能确认过滤器进行验证,以捕捉高概率反转入场机会,提供 BUY 与 SELL 信号。 你不仅能够学习如何交易,还能学会如何高效管理多个仓位,并利用之前盈利的持仓来覆盖亏损交易。 专为 M5 周期打造并优化,在 BTCUSD 和 XAUUSD 上表现尤为出色,因为这些市场的流动性能够让信号更加干净、可靠。 该指标会自动生成清晰的多头(Long)与空头(Short)信号,同时基于 ATR 自动计算入场位、止损位和止盈位,让风险管理从一开始就融入系统之中。 多 TP 系统设有三个渐进式目标位,你可以在 TP1 锁定部分利润、在 TP2 继续持仓,并在更大的行情中将仓位持有至 TP3,而这正是平均风险回报比真正开始大放异彩的地方。 默认参数开箱即用,已经针对稳定表现进行
Entry Points Pro for MT5
Yury Orlov
4.52 (151)
传奇回归:Entry Points Pro 10。 这款传奇指标曾 3 年稳居 MQL5 Market 前三,如今全面重启。 数百条热情好评(两个版本合计 589 条),每天有数千名交易者用它交易,演示版下载 31,000+   MT4+MT5  次。 五年来我读过你们的每一条评价——在第 10 版里,我没有给出许诺,而是把答案直接做进了产品。指标作者自 1999 年入市, 珍视诚信、自己的声誉和自己的客户 。 Entry Points Pro 给出的入场信号严格不重绘。 而且这一次不再只是作者的一面之词,而是可验证的事实:确认信号只在 K 线收盘后标出,自动化测试记录到 零重绘 (在 EURUSD、XAUUSD 和 BTCUSD 上共 2,486,568 次不变量检查——0 次违规)。测试方法完全公开——您可以在策略测试器中自行复现。 购买后请务必第一时间给我发私信。 我会发给您 扩展版说明书《交易者圣经》 ——使用本指标交易的完整指南——并告诉您如何免费获得 赠品:市场扫描器 ,它能同时分析多个品种和多个时间周期,并在一个界面上显示 Entry Points Pro 此刻在哪里表现
Neuro Poseidon MT5
Daria Rezueva
4.75 (52)
Neuro Poseidon is a new indicator by Daria Rezueva. It combines precise trading signals with adaptive TP/SL levels - creating best possible trades as a result! Message me and get  Neuro Poseidon Assistant  as a gift to automize your trading process! What makes it stand out? 1. Proven profitability on all assets and timeframes 2. Only confirmed BUY and SELL signals present on the chart 3. Adaptive TP & SL levels generated by the software for each trade 4. Easy to understand - suitable for al
Adaptive Price Action Engine 买指标,免费送EA 自适应多时间框架趋势与K线形态智能分析系统 市场环境始终在变化,不同的市场阶段中,并非所有 Price Action 形态都具有相同的参考价值。 Adaptive Price Action Engine 旨在适应不断变化的市场条件,将 趋势结构、多时间框架分析、K线形态与统计优化 整合到一个统一的分析框架中。 两种自适应模式 Dual Alpha Trend Mode(双 Alpha Trend 模式) 自动搜索适合的 Alpha Trend 参数,并结合低周期与高周期市场结构,使指标能够根据近期市场行为动态调整趋势识别。 Candlestick + Alpha Mode(K线 + Alpha 模式) 将 Alpha Trend 市场状态与 22种多空K线形态 相结合。系统不会简单地对所有形态一视同仁,而是对不同的形态组合进行统计评估,并识别在特定市场环境下表现出更强历史统计特征的配置。 主要功能 趋势参数自动优化 多时间框架市场状态分析 22种多头与空头 Price Action K线形态 对数千种可能
Auto Optimized SpeedAngle 是一款机构级的动量向量化系统,通过持续的前瞻优化(Walk-Forward Optimization, WFO)彻底消除了曲线拟合(curve-fitting)。该指标没有采用在市场 状态转换时容易失效的静态输入参数,而是利用出样外验证(Out-of-Sample, OOS) dynamically 动态重新校准设置,从而确保显示的 信号代表真正的统计优势,而非历史巧合。 核心机构级架构 前瞻优化引擎(Walk-Forward Optimization Engine): 核心算法持续扫描数千种回溯周期(lookback)与阈值组合,严格将数据划分为样本内(in-sample)和样本外(out-of-sample)。只有当参数配置在未知数据环境中证明具备数学优越性时,系统才会对其进行 adoption。 量化目标函数(Quantitative Objective Functions): 优化引擎不一味追求绝对毛利,而是聚焦于机构级的稳定性指标。用户可针对系统质量数(SQN)、期望值(每笔交易的平均 R 倍数)或净 R 值进行优化,从而优
M1 Sniper MT5
Oleg Rodin
5 (7)
M1 SNIPER   是一款易于使用的交易指标系统。它是一个专为 M1 时间框架设计的箭头指标。该指标可以作为独立的系统在 M1 时间框架下进行剥头皮交易,也可以作为您现有交易系统的一部分使用。虽然该交易系统专为 M1 时间框架交易而设计,但它也可以用于其他时间框架。我最初设计此方法是为了交易 XAUUSD 和 BTCUSD。但我发现这种方法在其他市场交易中也同样有用。 指标信号既可以顺势交易,也可以逆势交易。我教授一种特殊的交易技巧,帮助您利用指标信号进行双向交易。该方法基于使用特殊的动态支撑位和阻力位区域。 购买后,您可以立即下载 M1 SNIPER 箭头指标。此外,我还为所有 M1 SNIPER 工具用户免费提供下方屏幕截图所示的 Apollo Dynamic SR 指标!这两个指标的组合可以帮助您更轻松、更准确地利用 M1 时间框架进行交易。 购买后请联系我,免费获取交易提示和奖励指标! 祝您交易成功!
Gann Made Easy MT5
Oleg Rodin
5 (11)
Gann Made Easy   是一个专业且易于使用的外汇交易系统,它基于使用先生理论的最佳交易原则。 W.D.江恩。该指标提供准确的买入和卖出信号,包括止损和获利水平。您甚至可以使用推送通知在旅途中进行交易。 购买后请联系我,即可免费获得交易指导和超棒的额外指标! 您可能已经多次听说过江恩交易方法。通常 Gann 的理论不仅对于新手交易者而且对于那些已经有一定交易经验的人来说都是非常复杂的东西。这是因为江恩的交易方法在理论上并不那么容易应用。我花了几年时间来完善这些知识,并将最好的原则应用到我的外汇指标中。 该指标非常易于应用。您所需要的只是将其附加到您的图表并遵循简单的交易建议。该指标不断进行市场分析工作并寻找交易机会。当它检测到一个好的入口点时,它会为您提供一个箭头信号。该指标还显示止损和获利水平。 换句话说,当您像先生一样进行交易时,该指标会为您提供最佳江恩建议。江恩亲自告诉你此时此刻该做什么。但最好的部分是您不需要了解任何有关江恩交易原则的知识,因为该指标会为您完成整个市场分析工作。
ARIPoint
Temirlan Kdyrkhan
1 (4)
ARIPoint is a powerful trading companion designed to generate high-probability entry signals with dynamic TP/SL/DP levels based on volatility. Built-in performance tracking shows win/loss stats, PP1/PP2 hits, and success rates all updated live. Key Features: Buy/Sell signals with adaptive volatility bands Real-time TP/SL/DP levels based on ATR Built-in MA Filter with optional ATR/StdDev volatility Performance stats panel (Success, Profit/Loss, PP1/PP2) Alerts via popup, sound, push, or email Cu
Scalper Vault MT5
Oleg Rodin
5 (1)
Scalper Vault   是一个专业的剥头皮系统,为您提供成功剥头皮所需的一切。该指标是一个完整的交易系统,可供外汇和二元期权交易者使用。推荐的时间范围是 M5。 该系统为您提供趋势方向的准确箭头信号。它还为您提供顶部和底部信号以及江恩市场水平。无论您拥有何种交易经验,该系统都易于使用。您只需要遵循简单的规则并每天重复该过程。 建议将此系统用于主要货币对。感谢您的关注! 请注意,该指标在策略测试器中可能无法正常工作。因此,我建议仅在模拟或真实账户的真实交易条件下使用该系统。 指示器提供所有类型的警报,包括推送通知。 购买指标后请与我联系。我将免费与您分享我的个人交易建议和出色的奖励指标! 祝您交易愉快,盈利!
Trend Catcher ind mt5
Ramil Minniakhmetov
5 (18)
趨勢捕捉指標 趨勢捕捉指標結合了作者獨有的客製化自適應趨勢分析指標,用於分析市場價格趨勢。它透過過濾掉短期噪音,並專注於潛在的動能強度、波動性擴張和價格結構行為,來識別真實的市場方向。此外,它還結合了平滑和趨勢過濾等客製化指標,例如移動平均線、相對強弱指標 (RSI) 和波動率過濾器。 您可以在這裡查看實際運行情況以及我的其他產品: https://www.mql5.com/en/users/mechanic/seller 請注意,我不會在 Telegram 上出售 EA 或任何設置,那是騙局。所有設定都可以在我的部落格上免費取得。 重要提示!購買後請立即聯繫我,以獲取使用說明和額外獎勵! 請注意,我不會在 Telegram 上出售 EA 或任何設置,那是騙局。所有設定都可以在我的部落格上免費取得。
Entry In The Zone and SMC Multi Timeframe is a real-time market analysis tool based on Smart Money Concepts (SMC), designed to analyze market structure, price direction, and key trading zones. It supports both Single-Timeframe and Multi-Timeframe Analysis, providing a clearer view of overall market structure across multiple timeframes, with real-time BUY / SELL signals designed with a strict focus on No-Repaint principles. The signals are designed to help filter unclear setups and evaluate tradi
您好,交易员! 大多数散户交易者依赖于滞后的网页脚本。真正具有交易优势需要机构化的架构。 Astro AI 指标并非标准的图表叠加层。它是一个编译后的神经网络,包含两个代理,直接运行在您的终端上。 以下是该系统背后的具体技术: 1. 代理 1:分析师(图神经网络 - GNN) 市场并非孤立的价格柱;它们是相互关联的数据网络。 功能:代理 1 使用图神经网络来映射这些复杂的非线性关系。 优势:标准指标仅考虑单一的历史移动平均线,而我们的 GNN 可以实时处理深层的市场结构关系,在散户交易量发挥作用之前揭示隐藏的相关性。 2. 代理 2:执行器(近端策略优化 - PPO) 模式识别只是成功的一半。基于当前市场波动做出正确的决策,才是预测模型与滞后模型之间的区别所在。 功能:代理 2 使用 PPO(一种先进的强化学习算法)来确定最佳入场点。 优势:它持续调整交易策略,而非使用静态的“超买”或“超卖”线。它会分析当前市场状况并计算最可能的成交点。 执行桥接:通过 ONNX 集成到交易终端 如果执行速度慢,模式识别就毫无用处。我们已通过 ONNX(开放神经网络交换平台)
Divergence Bomber
Ihor Otkydach
4.89 (94)
购买该指标的每位用户将额外免费获得以下内容: 原创工具“Bomber Utility”,该工具会自动跟踪每一笔交易,设置止损和止盈点,并根据策略规则自动平仓; 适用于不同交易品种的指标设置文件(Set 文件); 三种不同风险模式下的 Bomber Utility 设置文件:“最低风险”、“平衡风险” 和 “观望策略”; 一套详细的 视频操作手册,帮助您快速完成安装、配置并开始使用本交易系统。 注意: 要获取以上所有赠品,请通过 MQL5 的私人消息系统联系卖家。 我为您介绍原创的自定义指标 “Divergence Bomber”(背离轰炸机),它是一套基于 MACD 背离交易策略 的“全功能”交易系统。 该技术指标的主要任务是识别 价格与 MACD 指标之间的背离,并发出交易信号(包括推送通知),指示未来价格可能的运动方向。平均而言,这些信号的准确率超过 98%。有关该指标如何工作的详细说明,请观看本页面上的视频演示。 该系统使用 止损订单 和 动态回撤平仓机制 来管理交易。 Divergence Bomber 指标的主要特点: 支持交易的品种: AUDCAD、AUDCHF、AUDS
Unix Scalper
Issam Kassas
4 (4)
Unix Scalper — MetaTrader 5 购买后,请在 MQL5 上给我发消息,即可免费获得 Smart Universal Expert Advisor,以及在线课程、PDF 手册和私人群组访问权限。 发现交易形态,看清交易计划,选择执行方式。 UNIX Scalper 将市场分析、BUY/SELL/WAIT 决策以及 Entry、Stop Loss、TP1 和 TP2 水平集中在一个清晰的面板中。 看清信号与交易计划 • 明确的决策:BUY、SELL 或 WAIT。 • 明确的价格水平:Entry、Stop Loss、TP1 和 TP2。 • 多时间周期概览:比较面板中各时间周期的信号。 • 辅助分析:趋势、动量、成交量、波动率、支撑与阻力,以及市场质量。 • 灵活的布局:Minimized、Compact、Standard 或 Full。 查看信号,检查价格水平,再判断该交易形态是否符合您的交易规则。 从黄金和比特币开始 建议首先使用的交易品种:XAUUSD 和 BTCUSD。 探索短期剥头皮交易和较高时间周期分析。选择历史K线范围,通过表现曲线查看所选设置
Volatility Master for MetaTrader is a real-time dashboard tool that scans up to  50 symbols  to identify high-volatility , trending markets instantly. With bullish/bearish signals, customizable alerts, and a user-friendly interface, it helps you avoid range-bound conditions and focus on high-probability trades. Clarity leads to confidence. Trade confidently and protect your capital effectively with this powerful dashboard. We don't offer free or bonus indicators in exchange of reviews from you.
Quantum TrendPulse
Bogdan Ion Puscasu
5 (26)
介绍 Quantum TrendPulse   ,这是一款终极交易工具,它将 SuperTrend   、   RSI 和 Stochastic 的强大功能整合到一个综合指标中,以最大限度地发挥您的交易潜力。该指标专为追求精准和效率的交易者而设计,可帮助您自信地识别市场趋势、动量变化以及最佳进入和退出点。 主要特点: 超级趋势整合: 轻松跟随当前的市场趋势并乘上盈利浪潮。 RSI 精度: 检测超买和超卖水平,非常适合把握市场逆转时机,可用作 SuperTrend 的过滤器 随机精度: 利用随机振荡在波动的市场中寻找隐藏的机会, 用作超级趋势的过滤器 多时间范围分析: 从 M5 到 H1 或 H4,在不同时间范围内关注市场动态。 可定制的警报: 当您的自定义交易条件得到满足时收到通知,这样您就不会错过任何交易。 无论您是新手还是经验丰富的交易员,   Quantum TrendPulse 都能为您提供所需的优势,帮助您增强策略并自信地进行交易。借助这一强大的指标,将洞察力转化为利润 — 掌控您的交易! ***购买 Quantum TrendPulse,即可免费获得 Quantum Tr
介绍     Quantum Breakout PRO   ,突破性的 MQL5 指标,正在改变您交易突破区域的方式!由拥有超过13年交易经验的资深交易员团队开发,     量子突破 PRO     旨在通过其创新和动态的突破区域策略将您的交易之旅推向新的高度。 量子突破指标将为您提供带有 5 个利润目标区域的突破区域的信号箭头,以及基于突破框的止损建议。 它既适合新手交易者,也适合专业交易者。 量子 EA 通道:       点击这里 重要的!购买后请私信我领取安装手册。 建议: 时间范围:M15 货币对:GBPJPY、EURJPY、USDJPY、NZDUSD、XAUUSD 账户类型:ECN、Raw 或 Razor,点差极低 经纪商时间:GMT +3 经纪商:IC Markets、Pepperstone with Raw 和 Razor 的点差最低 规格: 不重漆! 最多 5 个建议利润目标区域 建议止损水平 可定制的盒子。您可以设置自己的 Box Time Start 和 Box Time End。 接触 如果您有任何疑问或需要帮助,请通过私人消息与我联系。
Atomic Analyst MT5
Issam Kassas
4.48 (62)
Atomic Analyst — MetaTrader 5 购买后,请在 MQL5 上给我发消息,即可免费获得 Smart Universal Expert Advisor,以及在线课程、PDF 手册和私人群组访问权限。 Atomic Analyst 将价格行为、趋势方向、入场和出场信号、止损位及多个止盈位集中呈现在图表上。 看清信号,理解交易形态 Atomic Analyst 将分析结果整理为清晰的可视化信息: • 买入和卖出箭头,用于识别潜在的入场机会。 • 止损位和多个止盈位,帮助规划交易。 • 趋势、强度和动量读数,用于评估市场方向。 • 多时间周期分析,用于比较更广泛的市场背景。 • 彩色K线和提醒,帮助您跟踪变化的市场条件。 结合辅助分析查看信号,再判断该交易形态是否符合您的交易规则。 从短期形态到更大级别的行情 您可以将 Atomic Analyst 用于剥头皮交易、日内交易,或跟踪持续时间更长的市场走势。 建议从 H1 时间周期开始。建议交易品种包括 EURUSD、AUDUSD 和 XAUUSD。 从信号到自动化 Smart Universal Expert A
PainX GainX Blue Spike Fusion AI Advanced Synthetic Index Spike Detection Indicator for MetaTrader 5 Discover potential spike setups with a clear, organized, and professional trading interface. PainX GainX Blue Spike Fusion AI is a specialized indicator designed for traders who monitor synthetic indices and want a structured way to observe potential price spike opportunities. The indicator combines signal monitoring, market-condition analysis, visual alerts, and event tracking in one convenient
PZ Divergence Trading MT5
PZ TRADING SLU
3.71 (7)
棘手的发现和频率稀缺是最可靠的交易方案之一。该指标使用您喜欢的振荡器自动查找并扫描常规和隐藏的发散。 [ 安装指南 | 更新指南 | 故障排除 | 常见问题 | 所有产品 ] 容易交易 发现常规和隐藏的分歧 支持许多知名的振荡器 根据突破实现交易信号 显示适当的止损和获利水平 可配置的振荡器参数 可自定义的颜色和尺寸 按条形过滤大小差异 实现绩效统计 它实现了电子邮件/声音/视觉警报 为了提供广阔的市场前景,可以使用不同的振荡器在同一张图表中多次加载该指标,而不会产生干扰。该指标支持以下振荡器: RSI CCI MACD OSMA 随机 动量 很棒的振荡器 加速器振荡器 威廉姆斯百分比范围 相对活力指数 由于差异可能会扩大很多,尤其是在外汇市场中,因此该指标产生了转折:它在等待交易突破之前等待donchian突破确认差异。最终结果是带有非常可靠的交易信号的重新粉刷指示器。 输入参数 幅度:用于寻找差异的之字形周期 振荡器-选择要加载到图表的振荡器。 突破期-交易信号的突破期,以柱为单位。 发散类型-启用或禁用发散类型:隐藏,常规或两者。 最小散度单位为条形-最小散度单位为条形
RelicusRoad Pro MT5
Relicus LLC
4.96 (25)
别再凭猜测做交易。 在同一张图表上看清何时入场、何时离场,以及市场的方向。 RelicusRoad Pro 将近二十种工具整合进一个指标,你可以只开启适合自己交易方式的那几项。 入场清晰。出场清晰。每张图表都有计划。 是不是很熟悉? 你刚买入,价格一分钟后就逆着你运行。 你出场太早,然后眼看着行情在你离场后继续走下去。 图表上有五个指标,给出五种不同的答案。 你的止损全凭猜测。 我们为何开发它 我们做外汇交易已有 18 年。RelicusRoad 背后的核心算法最初是在私下为我们自己的专业交易员圈子开发的。 初衷很个人。我们厌倦了一次次手工画同样的线,违反自己定下的规则,错过图表上真正重要的那一点。 对我们有效的是一致性:每天以同样的方式读图,直到它变成肌肉记忆。RelicusRoad Pro 把这种看盘方式带到你的图表上。 之后我们把它开放给更多交易员,因为一个小圈子能看到的东西有限。 每位交易员都会带来新的问题和想法,好的想法会进入下一次更新。今天其中很多工具之所以存在,是因为我们的交易员提出了需求。 这个社区保持私密且规模不大,同时活跃的交易员保持在 2,000 人以内。有些人使
Quantum Direction 是一款专业的趋势跟踪指标,旨在识别市场方向、发现趋势早期变化,并提供经过过滤的入场和出场信号。 该指标包含免费的 Quantum Trade Assistant ,这是一款专业的交易管理工具,可在 MQL5 Market 获取。它可以直接连接到 Quantum Direction ,并在出现有效信号时自动开仓,或在满足设定的出场条件时自动平仓。 在此下载免费的 Quantum Trade Assistant 该指标的主要功能: 多逻辑趋势检测 — 结合多种市场分析条件,用于识别潜在的趋势开始以及趋势方向变化。 交易时段过滤器 — 将信号集中在所选择的交易时段,帮助您在市场活跃度和波动性较高的时期分析交易机会。 高周期过滤器 — 使用更高时间周期确认市场方向,并帮助减少由短期突破或暂时性市场方向变化产生的信号。 入场与出场提醒 — 提供多种入场和出场信号提醒方式,帮助您无需持续盯盘即可监控市场。 点数盈亏仪表盘 — 在图表上显示信号累计点数盈亏,以便快速进行历史评估和回测。 我将这套策略应用于自己的交易,并在 YouTube 频道记录我的交易历程。购买
OrderFlux – MetaTrader 5 的订单流 (Order Flow) 与足迹图 (Footprint) 指标 OrderFlux 是一款专业的 MetaTrader 5 订单流和足迹图指标。它打开每一根 K 线,揭示其内部结构:每个价格水平的交易量,并将其划分为主动买盘和主动卖盘。根据这些 Tick 数据,系统会实时构建完整的足迹图,包括 Delta, Imbalance (失衡), Volume Profile (成交量分布) 和 Market Profile (市场轮廓) 。 常规图表只显示开盘、最高、最低和收盘价。这只是运动的结果,而非原因。OrderFlux 让每根 K 线的微观结构变得可见,并回答了最关键的问题: 究竟是谁在真正推动行情? 这使得交易者能够基于真实的交易量来读取支撑和阻力,而不是仅仅根据 K 线形状进行猜测。 足迹图显示内容 在每个价格水平上,都会显示两个数字。左侧是 Bid(买价)的交易量,右侧是 Ask(卖价)的交易量。这两侧之间的关系创造了 Delta — 来自买方或卖方的净压力。 Imbalances (失衡): 某一方具有压倒性优势的
Power Candles MT5
Daniel Stein
4.58 (12)
Power Candles V3 - 自我优化的强度指标 Power Candles V3 把货币与品种的强度直接转化为图表上可执行的交易方案。指标不再仅根据强度给K线着色,而是在后台持续运行实时自动优化,为您正面对的品种给出最佳 Stop Loss、Take Profit 与信号阈值。一键采用,Entry、Stop Loss、Take Profit 线就以精确价格绘制在图表上,提醒消息中直接包含方向。 本工具是 Stein Investments 生态系统的一部分 - 18+ 款工具,加上 Max,您的一对一 AI 交易导师。  随时在线,深入了解每一款指标,在您需要梳理思路的那一刻就在那里。  立即认识他: https://stein.investments 每根收盘K线运行 3,000+ 次交易模拟。9 种强度状态。2 种策略并行测试。一键采用最优配置。 为什么需要这个 大多数强度指标只给您一个数值,然后留下三个问题:相信哪个阈值、用哪个 Stop Loss、走哪个交易方向。Power Candles V3 在每根收盘K线上自动回答这些问题。结果就是一个完整的交易方案 -
FX Trend MT5 NG
Daniel Stein
5 (6)
FX Trend NG:新一代多市场趋势智能分析工具 概述 FX Trend NG 是一款专业的多时间周期趋势分析与市场监控工具,帮助您在几秒钟内全面了解市场结构。 无需在多个图表之间来回切换,您可以立即看到哪些品种处于趋势中、哪里动能正在减弱,以及哪些时间周期之间存在强烈共振。 限时发布优惠 – 仅需 $30(6个月) 或 $80 终身授权 即可拥有 FX Trend NG 。 已经是 Stein Investments 客户? -> 发送消息 以获取专属客户群访问权限。 需要帮助或安装指导? -> 请访问 Stein Investments 官方页面 。 1. FX Trend NG 的核心优势 三状态趋势逻辑 —— 不只是 Buy 或 Sell • 大多数指标仅显示两种状态:Buy 或 Sell。 • FX Trend NG 增加第三种状态: Fade 。 • Fade 表示趋势强度正在减弱,在完全反转之前提前发出信号。 这种结构化逻辑让您看到趋势变化过程,而不仅仅是简单方向信号。 多时间周期分析(M1 至 MN1) • 从短线交易到中长线交易全面覆盖。 • 快速识别趋势
IX Power MT5
Daniel Stein
4.92 (13)
IX Power:解锁指数、大宗商品、加密货币和外汇市场洞察 概述 IX Power 是一款多功能工具,可分析指数、大宗商品、加密货币和外汇市场的强弱表现。 FX Power 提供针对货币对的最高精度,利用所有可用货币对数据进行分析,而 IX Power 专注于基础资产的市场数据。这使得 IX Power 成为非外汇市场的理想选择,同时在需要简单外汇分析时也非常可靠。它可以无缝适用于任何图表,提供清晰的、有行动价值的洞察,帮助提升您的交易决策。 1. 为什么 IX Power 对交易者非常有价值 多市场强弱分析 • IX Power 分析指数、大宗商品、加密货币和外汇市场的强弱表现,为每个市场提供量身定制的洞察。 • 监控 US30、WTI、黄金、比特币等资产的表现,发现交易机会。 适用于更广泛的市场 • 对于外汇交易, FX Power 提供无与伦比的精度,通过分析所有相关货币对。 • IX Power 专注于基础资产的市场数据,非常适合非外汇市场及简化的外汇分析。 实时适应性 • 借助自适应算法, IX Power 实时响应市场数据变化,保持分析的最新性。 • 实时更新
M1 Quantum MT5
Hamed Dehgani
4.2 (10)
使用 M1 Quantum 的实盘交易信号 : 信号 (交易由 Quantum Trade Assistant 自动 执行,并作为本产品 免费 提供。) 最新消息: 版本 1.64 已发布。现在所有交易的止损都会设置在相应的支撑位/阻力位之后。Smart Close 功能也进行了改进,以提升此版本 EA 的性能。 自 8 月 9 日起,实盘信号一直运行在版本 1.64 上。 价格计划: 当前价格: $169 (早期用户优惠) 下一阶段计划价格: $189 计划零售价: $299 开发者提示: 购买后请联系我,以获取 最新推荐的参数设置文件(Set File) 、交易建议,以及加入 VIP 支持群组 ,与其他 M1 Quantum 用户交流经验。 常见问题 - 设置文件 - 安装指南 M1 Quantum 是一款专业的 M1 交易系统,提供快速且精准的交易信号,并内置止损(Stop Loss)、止盈(Take Profit)以及智能资金管理功能。 M1 Quantum 包含专业的资金管理系统,通过专注于 连续盈利交易 ,帮助交易者更快地增长账户资金。 M1 Quantum 指标 的主
作者的更多信息
The last candle before the move, highlighted — automatically. Order blocks are one of the most-watched concepts in Smart Money and price-action trading: the last opposing candle before an impulsive move, marking where large orders were likely filled. Drawing them by hand is slow, subjective and inconsistent. This tool maps them with the same rules, on every chart, every time. WHAT IT DOES Nemo Order Blocks scans price action and plots two kinds of zones, extended forward so you can watch price
Trend, volatility and timing in one clean read. Every trend trader juggles the same three questions: which way is the market leaning, is price overstretched, and where would a sensible stop go? Apex Trend Analyzer answers all three on a single chart — with a non-repainting arrow that marks the exact bar where conditions aligned. WHAT IT DOES TREND DIRECTION — read from a fast/slow moving-average relationship (EMA or SMA, fully selectable). Always visible, never ambiguous. VOLATILITY CONTEXT —
Four timeframes, one traffic light. The oldest edge in trading is also the most ignored: trade WITH the alignment of timeframes, not against it. The problem is that checking four charts before every trade is slow — and by the time you have flipped through them, the moment is gone. Quattro Semafori ("four traffic lights") reads the trend on FOUR timeframes simultaneously and shows the result as one simple panel. WHAT IT DOES Each of the four timeframes you choose gets its own LONG or SHORT read
Know when NOT to trade. Ask any experienced trader where their money leaks: it is rarely the big losing trade. It is the slow bleed of a dozen small stops taken inside a range, fighting a market that was going nowhere. The Choppy Market Filter has one job: tell you, objectively, when the market is trendless — so you stop paying the chop tax. WHAT IT DOES Using trend-strength logic (ADX-based), the filter continuously classifies conditions: CHOPPY / RANGE — trend strength below your threshold.
Does your market really lean bullish on Tuesdays? Stop guessing — measure it. Traders repeat weekday folklore for years without ever checking. Statistical Bias checks — on the actual history of the instrument on YOUR chart — and shows the result in a compact, always-visible panel. WHAT IT DOES Over your chosen lookback, the indicator computes for each weekday (Monday to Friday) the percentage of days that closed up , and displays the full weekly profile in a clean panel — with today's weekday
Who is actually in control? Price tells you what happened. Volume pressure tells you who made it happen — and whether they are still pushing. Delta Volume Filter estimates buying versus selling pressure bar by bar and paints it as an intuitive colored histogram, so you can see conviction (or the lack of it) at a glance. WHAT IT DOES The indicator combines Close Location Value (CLV) — where each bar closed within its range — with tick volume, producing a signed pressure estimate per bar: GREEN-
Smart Money structure, marked for you. Break of Structure and Change of Character are the backbone of price-action and SMC analysis: as long as the market prints higher highs, the uptrend is alive; the first break the other way changes the story. Every SMC trader draws these levels — usually by hand, slowly, and each one slightly differently. This tool does it automatically, consistently, on every chart. WHAT IT DOES The indicator auto-detects swing highs and swing lows in real time and labels
Fair Value Gaps, marked in real time. When price moves so fast that it leaves a gap between candle ranges, it leaves something behind: an imbalance — a zone where one side never got to transact. Fair Value Gaps are among the most-watched objects in modern price-action trading, because price so often returns to "rebalance" them. Finding them by eye across timeframes is tedious. This tool marks every one, live. WHAT IT DOES The detector scans each new three-candle sequence and plots: BULLISH FVG
Where the next battle happens. Strong moves are born in quiet places: a tight consolidation, then an explosion. That base — where positions were quietly built before the move — is a supply or demand zone, and markets have a long memory for them. This indicator finds those bases automatically and projects the zones forward, so you plan your reactions in advance instead of chasing candles. WHAT IT DOES The indicator detects consolidation bases that precede strong impulsive moves and plots them a
Where the stops are. Why does price so often spike just beyond an obvious high — and then reverse? Because that is where the orders sit. Clusters of stops above Equal Highs and below Equal Lows are pools of liquidity, and price is frequently drawn to them before the real move. This indicator maps those pools automatically, so you anticipate the sweep instead of being the sweep. WHAT IT DOES The indicator tracks swing highs and swing lows and marks the clustered reference levels where liquidity
Shadow Trap Reversal — reversal arrows from exhaustion wicks and false breaks Most reversals leave the same fingerprint: the crowd pushes one last time, gets trapped, and price snaps back. Shadow Trap Reversal finds that fingerprint automatically and drops a clean arrow on your chart — no repainting on closed bars, no clutter. TWO PROVEN SIGNALS IN ONE TOOL • Exhaustion Wick — after a directional run of several candles, a bar rejects the trend with a wick longer than half its body and closes t
Channel Rider RSI — adaptive pullback buys inside rising channels Fixed RSI 30/70 levels fail in trends: a strong instrument never reaches 30, so you never buy the dip. Channel Rider RSI fixes that with a rolling-percentile RSI — it defines "oversold" from the asset's own recent behaviour, so the signal keeps working whether you trade a quiet blue-chip or a volatile index. THE THREE-FILTER ENTRY 1. Rising channel — linear-regression lines on highs and lows must both slope upward. No signals in
筛选:
无评论
回复评论