Nemo StatGuard Volatility Regime Filter

Trade only when conditions are normal. Most losing trades are not bad ideas — they are good ideas executed in the wrong volatility regime. StatGuard exists to answer one question before every trade: is this market behaving normally right now, or has it left its statistical range?

▶ WHAT IT DOES

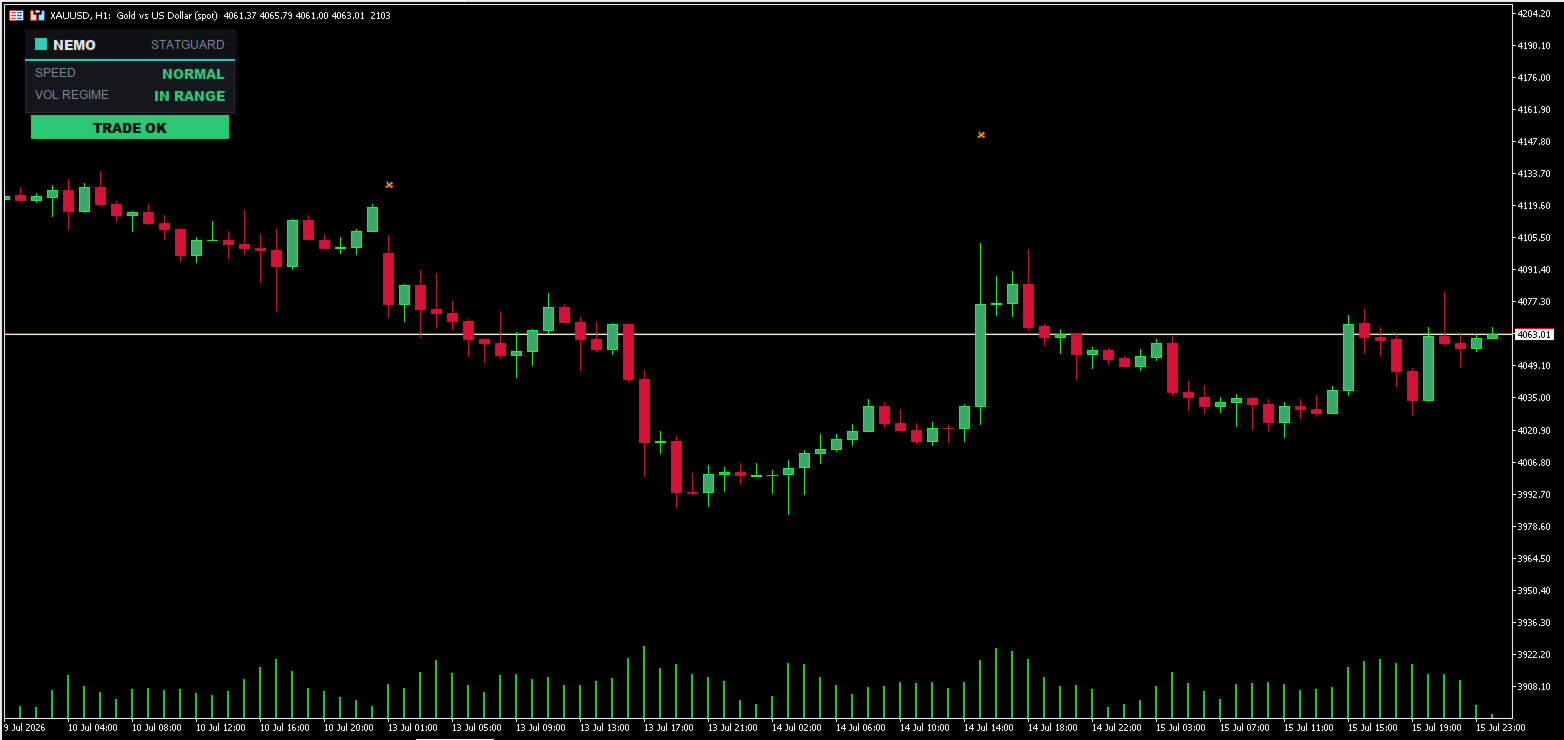
StatGuard continuously reads two objective conditions and gives you a clear verdict on a compact chart panel:

  • SPEED SHOCK — the current bar's range is far above its own historical baseline: an abnormal burst of speed where spreads widen, slippage grows and whipsaw risk spikes.
  • ABNORMAL VOLATILITY REGIME — short-term ATR stretched versus its long-term norm: the market has left its usual behavior.

When either condition fires, the panel shows STAND ASIDE. Otherwise it shows TRADE OK. One glance tells you whether your usual playbook applies — before you commit money.

▶ KEY FEATURES

  • Adaptive to each instrument — the baseline is built from the symbol's own history, not fixed magic numbers. Gold, indices, FX pairs and crypto each get their own norm.
  • Works on any symbol and any timeframe.
  • Compact corner dashboard: Speed, Vol Regime and the verdict at a glance. Position and colors configurable, no chart clutter.
  • Non-repainting: it reads closed statistical data and never redraws history.
  • Pairs with ANY strategy — trend following, mean reversion, breakout, SMC. It does not replace your method; it protects it.
  • Fully auditable rule — every input is adjustable, nothing is a black box.

▶ INPUT PARAMETERS

  • Lookback window — how much history builds the statistical baseline.
  • Deviation threshold — how far the market must stretch to be flagged as abnormal.
  • Panel position and full color settings.

▶ HOW TO USE IT

  1. Drop StatGuard on the chart you trade.
  2. Before every entry, check the panel.
  3. TRADE OK — proceed with your setup as usual.
  4. STAND ASIDE — reduce size, widen stops, or simply skip the trade. Abnormal regimes are where most systems break.

▶ WHAT IT IS — AND WHAT IT IS NOT

We build honest tools. StatGuard is a permission and context filter. It is NOT a signal generator, it does not predict direction, and it makes no profit promise — the rule is fully auditable and the decision is always yours. DEMO included — test it before you buy.

▶ PART OF THE NEMOSYSTEMS FAMILY

NemoSystems indicators share one philosophy: measure what is actually happening, show it clearly, claim nothing that cannot be proven. Check our profile for the full toolkit (trend, structure, volume, liquidity).

▶ SUPPORT

Questions or suggestions? Leave a comment on this page — we answer. Free updates for all buyers.
おすすめのプロダクト
Автомated Trend Line Construction Features: Draws multiple trend lines representing potential price growth/decline boundaries (gray lines) Identifies and draws price channels (green lines) Identifies potential technical analysis triangles (red and blue lines) Recommended: White chart background, Timeframe - M30 Settings: Interval=200   - Maximum number of bars used in the analysis for line construction The_greatest_distance=5000   - Controls the maximum distance from the current bar's price lev
LBR Oscillator
Pablo Filipe Soares De Almeida
LBR Oscillator – 3/10 Oscillator LBR Oscillator は、プロトレーダーであるリンダ・ラシュキによって広く使用・普及された、クラシックな 3/10 Oscillator を改良したバージョンです。 本インジケーターは、リンダ・ラシュキが使用している元の標準設定に基づいて開発されており、3期間および10期間の移動平均と、16期間のシグナルラインを使用し、モメンタムと市場リズムの変化を読み取ることに重点を置いています。 概念的基盤 – リンダ・ラシュキによる 3/10 Oscillator の使い方 リンダ・ラシュキは、3/10 Oscillator を単なる自動売買シグナル生成器としてではなく、モメンタム確認ツールとして使用しています。 主な用途は以下の通りです: モメンタムの加速と減速を識別 トレンド中の押し目・戻りを確認 市場方向の短期的な変化を予測 プライスアクション、移動平均、トレンド環境と組み合わせて使用 注目点は、ヒストグラムの挙動、傾き、方向転換であり、単純なクロスではありません。 ヒストグラムは、短期移動平均(3期間)と長期移動平
PulseColor Overview PulseColor is an indicator for MetaTrader 5 that visualizes the current dominance of the positive or negative directional indicator ( +DI or -DI ) by coloring the High–Low range of each bar directly on the price chart. The indicator works in the main chart window and does not open an additional subwindow. PulseColor uses the classic Average Directional Movement Index (ADX) calculation. For each bar, the indicator compares the values of +DI and -DI . The stronger component det
# Engulfing Quality Score - Not all engulfings are equal *Category: Pattern Recognition | Difficulty: intermediate | Window: chart window (overlaid on price) | Markets: Universal (Forex, indices, commodities, crypto, stocks) | Suggested timeframes: M15, M30, H1, H4, D1* ## Short description > Checks the engulfing pattern and scores it on four additional criteria, flagging only those exceeding the quality threshold. ## Full description ### Overview The engulfing pattern is among the best k
GoldPro Max
Taher Ahmed Mohamed Taha Elshafei
GOLDPRO MAX Advanced Multi-Timeframe and Smart Money Market Analysis for MetaTrader 5 GoldPro Max is a professional market analysis indicator for MetaTrader 5 designed to help traders study market direction, price structure, liquidity, market imbalance and potential trading areas from multiple perspectives. The indicator combines Multi-Timeframe Analysis, Smart Money Concepts, Market Structure, Liquidity Analysis, Order Blocks, Fair Value Gaps, Premium and Discount analysis, Smart Analytical Eng
An indicator of patterns #39 and #40 ("Rounding Tops" and "Rounding Bottoms") from Encyclopedia of Chart Patterns by Thomas N. Bulkowski. Parameters: Alerts - show alert when an arrow appears  Push - send a push notification when an arrow appears (requires configuration in the terminal) PeriodBars - indicator period   K - an additional parameter that influences the accuracy of pattern shape recognition. Changes from 0 to 1 ArrowType - a symbol from 1 to 17 ArrowVShift - vertical shift of arrows
An indicator of patterns #32 and #33 ("Measured Move Up/Down") from Encyclopedia of Chart Patterns by Thomas N. Bulkowski. Parameters: Alerts - show alert when an arrow appears   Push - send a push notification when an arrow appears (requires configuration in the terminal) PeriodBars - indicator period MinMovment - minimum movement value (in points) BackMovment - maximum value of return movement (as decimals) ArrowType - a symbol from 1 to 17 ArrowVShift - vertical shift of arrows in points   Sh
this indicator is a Spike detector indicator, it is specially designed to trade Boom 1000, Boom 500, Crash 1000 and Crash 500 We recommend using it on Deriv Boom and Crash indices only Its setting is intuitive, familiar, easy to use it has notification functions; audible notifications and push notifications. this tool is simple to use, easy to handle This update is based on different strategies for spikes
「スキャルピング スケールイン」は、スキャルピングでは 1 秒を争うため、S/L および T/P の配置を気にせず、固定距離の初期位置でスケーリングしたいスキャルパー向けに設計されたユーティリティ ツールです。 仕組み: EA の入力タブで希望の値を設定します。具体的には、T/P に配置するリスク対報酬、S/L の幅 (ピップ単位) を設定します。また、次の次のストップ注文までの距離 (位置のスケール) です。 MT5 で [買い/売り] を手動でクリックすると、EA が自動的に SL と TP を設定し、同時に新しい逆指値注文を SL と等しい距離 (ピップ単位) で同じ方向に設定します (つまり、買う場合は S/L が 5 ピップス)。 、次の買いストップ注文は、最初のエントリー価格より 5 ピップス上に配置されます)。保留中のストップ注文が約定されると、前のポジションは損益分岐点まで追跡され、S/L が前の取引のエントリーレベルで新しいストップ注文が発注されます。  基本的に、このツールは、積極的な動きを捕捉する均等に分散されたスケールインを利用します。 入力パラメータの説
Resiko
Monita Melyana Sinurat
This tool functions to: 1. Manage Risk - Set SL and TP for all open orders - Close all open orders according to the set risk 2. Manage Orders - This tool also functions as an assistant for Martingale or Grid trading, according to the set order spacing. This tool is ideal for traders who prefer to use Grid or Martingale systems with strict risk management..........
The Smart Fibonacci Entry is an automated structural analysis tool,  detects Break of Structure (BOS) events and automatically anchors a Fibonacci grid to the most relevant swing points. It specifically highlights the ENTRY zone, where institutional buying or selling typically occurs after a trend confirmation. Detection Swing Detection: The script monitors price for structural Swing Highs and Swing Lows based on your chosen pivot length. Fibonacci Direction Shift Recognition : A direction shift
MT5インジケータ TC-Alerts 開発経緯: 実はFXで簡単に勝てる手法があるんです。 それは。。。 主要な(4時間足以上、4時間足、日足、週足)のレジスタンスとサポートラインの反発を狙う FXは一方向には進まず90%以上で 必ず、必ずと言っていいほど、 どこかで反発します 。そこは大抵主要なレジスタンスとサポートラインまたは主要なフィボナッチラインなのです。 なのでそこに水平線を引いて ただ待つ のです。そこに到達したら、1分足や5分足に落として 長いヒゲ、ダブルボトム、ダブルヘッド、トリプルボトム、トリプルヘッド、三尊、逆三尊などの反転の形成を確認してエントリーする。 または、こちらを使用して https://www.mql5.com/ja/market/product/53987 強弱が弱くなってきたのを確認してエントリーすればいいのです。 これだけです。シンプルです!! うまく行くと、長期足レベルでレジスタンスとサポートライン間、つまり頭から尻尾まで取れる可能性もありますし、リスクリワードが異常にいいです。 そのためには、チャートに主要なレジスタンスとサポートラインに
DeepTrade Risk Guard
Yasir Mohammed Sachit Sachit
DeepTrade Risk Guard is an automatic account protector that enforces your trading discipline for you. Most traders don't blow accounts because of bad entries — they blow them by over-trading after a loss and ignoring their daily limits. This tool removes that risk by locking trading the moment your rules are broken.   KEY FEATURES - Daily loss limit (as % of start-of-day balance, or fixed money) - Daily profit target — stop while you are ahead - Maximum trades per day cap - One-click protection
150+ downloads and counting - thanks to everyone who's already running it. Risk Calculator is a free MetaTrader 5 tool that removes the manual math from position sizing. Drag the Stop Loss line to where your setup actually invalidates, and the dashboard instantly tells you the correct lot size for your risk — no calculator, no spreadsheet, no guesswork. What it does: - Draggable SL line — drop it exactly where your stop belongs; the tool reads the distance in real time. - Draggable TP line —
FREE
Introducing the Precision Data Extractor: SMA , an MQL5 utility crafted for traders, analysts and quants who need accurate historical data to build robust datasets. This tool lets you selectively pull historical price and indicator data— Simple Moving Average ( SMA )—from multiple applied prices, timeframes, and periods , then stores it in a CSV format, making it easy to feed into machine learning models, trading algorithms, or in-depth market analyses . Compatible with Forex , Stocks , and Comm
An indicator of patterns #52 and #53 ("Falling/rising wedges") from Encyclopedia of Chart Patterns by Thomas N. Bulkowski. Parameters: Alerts - show alert when an arrow appears   Push - send a push notification when an arrow appears (requires configuration in the terminal) PeriodBars - indicator period K - an additional parameter that influences the accuracy of pattern shape recognition ArrowType - a symbol from 1 to 17 ArrowVShift - vertical shift of arrows in pixels  ShowLevels - show lines C
Long Short Pro
Thalles Nascimento De Carvalho
Long & Short インジケーター - Pro バージョン: 市場分析の無限の可能性を解き放とう! すべての資産に制限なし Long & Short インジケーターの Pro バージョンは、すべての金融資産に対して完全な自由を提供します。制限なしで、同じインジケーターをお気に入りのすべての資産に適用できます! 制限なし インジケーターのすべての機能を制限なしでお楽しみください。Pro バージョンは、完全かつ無制限の体験を提供し、市場のあらゆる機会を最大限に活用できるようにします。 Pro バージョンの特徴 無制限のアクセス : インジケーターをすべての金融資産で使用し、その完全な可能性を探ります。 高度な精度 : 詳細な分析と明確なシグナルを活用して、情報に基づいた安全な決定を下すことができます。 完全な柔軟性 : 資産や戦略に関係なく、取引のニーズに合わせてインジケーターを調整します。 重要な機会のアラートを受け取る アラートを有効にして、重要なレベルを注意深く監視し、市場機会の最前線に立ち続けましょう。 EA 作成のためのバッファパラメ
SideZone: Trend Intensity Oscillator – Filter the Noise, Ride the Trend Overview SideZone is a specialized oscillator engineered to solve a common trader's dilemma: distinguishing between a true trend and a ranging market. By clearly visualizing trend direction and sideways consolidation, SideZone helps you stay on the right side of the move while avoiding the whipsaw of low-volatility environments. Its core function is to provide a clear, color-coded visual representation of market sentiment
Advanced Trade Panel for MetaTrader 5 This MT5 trading tool adds a sleek, on-chart trade management panel designed to give you full control, clarity, and precision before you enter a trade. With an intuitive interface, you can place limit orders directly from the chart while instantly seeing your risk, reward, and potential profit or loss — all calculated in South African Rands (ZAR) . Key Features: On-Chart Trade Panel A clean, customizable panel that sits directly on your chart for fast decis
Supertrend 趨勢指標 Supertrend 是一款用於判斷市場趨勢方向與趨勢轉換的技術指標,透過市場價格與波動幅度的變化,自動繪製趨勢線,協助交易者快速辨識目前市場偏多或偏空。 當市場趨勢發生改變時,指標會在圖表上顯示對應的 Buy / Sell 訊號 ,讓使用者更直觀地掌握可能的趨勢轉折位置。 此指標適合用於外匯、黃金、指數、加密貨幣等不同市場,也可搭配其他技術分析工具作為交易方向過濾、進場確認或趨勢追蹤使用。 主要功能包含: 自動判斷目前市場趨勢方向 顯示多頭與空頭 Supertrend 趨勢線 趨勢轉換時顯示 Buy / Sell 訊號 ATR 週期可自由調整 ATR 倍數可自由設定 支援不同價格計算來源 可自由開啟或關閉交易訊號 支援趨勢切換提醒 可自訂線條顏色與顯示方式 適用於不同商品與時間週期 Supertrend 可以單獨作為趨勢判斷工具,也可以搭配均線、支撐壓力、價格型態或其他交易策略使用,協助交易者更快速地辨識市場方向與趨勢變化。 注意:本指標僅提供市場分析與交易訊號參考,不代表任何獲利保證。實際交易前建議先進行充分測試,並搭配適當的資金與風險管理。
FREE
Support Resistance Inversion is based on supports and resistance to find the points in which the currency will probably go in a defined direction. Inputs: Alarm ON/OFF: turn on or off alarm on screen. The indicator draws an arrow pointing the direction to follow based on when the price cross or bounce on a support or a resistance. Support Resistance Inversion can help you to choose the moment to do your trades in a specific direction, strengthening your trading strategy.
MetaTrader 5 用マルチ銘柄 SMC スキャナーとダッシュボード この Smart Money Concepts スキャナー は、指定した銘柄リスト全体を読み取り、1 つの ダッシュボード に銘柄ごとの行を表示します。どの銘柄にも同じ SMC エンジンを適用します。break of structure と change of character を含む相場構造、オーダーブロック、fair value gap、流動性です。各行には 3 つの時間足の構造トレンド、売買シグナル、0 から 100 の合流スコア、未回収で最も近い オーダーブロック 、直近の 流動性スイープ が並びます。チャートを 1 つずつ開く代わりに、ウォッチリスト全体の相場構造を 1 つのマトリクスで読み、並べ替え、絞り込み、ワンクリックでのチャート切り替え、アラートが使えます。 パネルに表示される内容 ご自身のリストの銘柄ごとに 1 行:FX、貴金属、株価指数、暗号資産 マルチタイムフレーム の帯:選んだ 3 つの時間足の構造トレンドを横に並べ、短期と上位足が一致しているかを確認できます シグナル:確定したトレ
You can change the time period of the chart at the touch of a button. You can also change multiple charts at the touch of a button. You can also change multiple charts at the touch of a button,   saving you the trouble of changing time periods. We are live-streaming the actual operation of the system. Please check for yourself if it is usable. Please check it out for yourself. https://www.youtube.com/@ganesha_forex We do not guarantee your investment results. Investments should be made at you
プレミアムレベルは、正しい予測の精度が80%を超える独自の指標です。 この指標は、最高のトレーディングスペシャリストによって2か月以上テストされています。 あなたが他のどこにも見つけられない作者の指標! スクリーンショットから、このツールの正確さを自分で確認できます。 1は、1キャンドルの有効期限を持つバイナリーオプションの取引に最適です。 2はすべての通貨ペア、株式、商品、暗号通貨で機能します 手順: 赤い矢印が表示されたらすぐにダウントレードを開き、青い矢印が表示されたら閉じます。青い矢印の後に開くこともできます。 試してテストしてください!推奨設定はデフォルトです! 日足チャートで最高の精度を示します! インディケータは、2600 Pipsの収益性に対して、約10Pipsという非常に小さなマージンを使用します。
Trend indicators on the FOREX market are extremely useful for increasing your ability to open winning positions and for better anticipating market movements. OPTIMISED TREND PRO   is one of these indicators. • SuperTrend PRO is available on MetaTrader 5 (MT5) • Green/Red candles according to the trend, easy to read at a glance • A single arrow at the start of each phase: BUY (green), SELL (red) • The SuperTrend line helps set the stop and follow the position • Usable on all FOREX symbols •
Overview Harmonic Patterns MT5 is a technical analysis indicator designed for the MetaTrader 5 platform. It identifies and displays harmonic price patterns, such as Butterfly, Cypher, Crab, Bat, Shark, and Gartley, in both bullish and bearish directions. The indicator calculates key price levels, including entry, stop loss, and three take-profit levels, to assist traders in analyzing market movements. Visual elements and customizable alerts enhance usability on the chart. Features Detects six ha

Welcome to the Ultimate Harmonic Patterns recognition indicator that is focused to detect advanced patterns. The Gartley pattern, Bat pattern, and Cypher pattern  are popular technical analysis tools used by traders to identify potential reversal points in the market. Our Ultimate Harmonic Patterns recognition Indicator is a powerful tool that uses advanced algorithms to scan the markets and identify these patterns in real-time. With our Ultimate Harmonic Patterns recognition Indicator, you ca
神経学的学習指標:チャートに設定して、自分で最適な設定を見つけさせます。 ニューロガン AIはMetaTrader5用のニューラル学習シグナルインジケーターで、ほとんどのツールがあなたに任せていることを行います。最近の履歴と現在いるシンボルの実際の市場状態を研究し、インジケーターのフィルターに対するすべての最適設定、最高の結果をもたらすストップとターゲットの距離を発見し、あなたのために適用します。別のタイムフレームに切り替えると最初から再学習するので、常に目の前のチャートに適合した設定で取引することになり、推測した数字ではなくなります。 その背後にある方法はW.D.ガンの価格レンジの分割です。価格が上位タイムフレームのトレンドに沿ったシグナルゾーンに戻ると、インジケーターはローソク足にエントリーをマークし、エントリーライン、3つのターゲット、ストップをプロットします。また移動平均とそのバンドフィルターでシグナルを確認し、上位タイムフレームの確認をあなたのために選びます。そのためすべての市場で1つの固定設定に縛られることなく、主にトレンドに沿って取引します。 証明された統計的パフォーマン
Noize Absorption Index - is the manual trading system that measures the difference of pressure between bears forces and bulls forces. Green line - is a noize free index that showing curent situation. Zero value of index shows totally choppy/flat market.Values above zero level shows how powerfull bullish wave is and values below zero measures bearish forces.Up arrow appears on bearish market when it's ready to reverse, dn arrow appears on weak bullish market, as a result of reverse expectation.
Discipline Trader — Smart Trade Panel for MT5 Trade with a plan, not guesswork. Calculate lot sizes by risk %, place trades with predefined SL/TP, manage positions with one click, and enforce daily and basket loss limits. Includes break-even, partial close, trailing stop, a visual risk monitor and trade journal. You stay in control — the panel helps you stay disciplined. You decide the trade. Discipline Trader helps you size it, protect it and manage it. Whether you trade gold, forex, indices
このプロダクトを購入した人は以下も購入しています
Trend Sniper X
Sarvarbek Abduvoxobov
4.9 (42)
Trend Sniper X は、トレードの方向性と潜在的な反転ポイントを明確かつ正確に特定するのに役立つ、MetaTrader 5 用のマルチタイムフレーム・トレンドフォロー指標です。 MT4用: https://www.mql5.com/en/market/product/193245 価格情報: 現在の価格はプロモーション価格であり、今後のアップデートや新機能のリリースに伴い変更される場合があります。 ボーナス特典: このインジケーター用の無料自動売買アシスタントEAを入手するには、購入後に an 著者(開発者)へメッセージをお送りください。 Code2Profit チャンネル マルチタイムフレーム分析で相場をマスターしよう! Trend Sniper X で勝率を最大化する方法:重要なルールとセッションのコツ 技術仕様 プラットフォーム MetaTrader 5 インジケータータイプ マルチタイムフレーム・トレンドインジケーター 操作タイムフレーム あらゆるチャートタイムフレームに対応。個別に選択可能な上位タイムフレーム (M1–MN1) を搭載 主要銘柄 FX、ゴールド (X
Smart Trend Trading System — MetaTrader 5 ご購入後、MQL5で私にメッセージをお送りいただくと、Smart Universal Expert Advisorを無料で受け取れるほか、オンライン講座、PDFマニュアル、非公開グループへのアクセスもご利用いただけます。 STTSは、トレンドの方向、エントリー・決済シグナル、反転ゾーン、重要な価格水準をチャート上にまとめて表示します。システムを参考に手動で取引することも、別の対応EAを接続し、ご自身で選んだ設定に基づいて自動売買することもできます。 ひとつのシステム、4つのトレードアプローチ STTSのトレードアプローチは、大きく4つのカテゴリーに分かれています。 • スキャルピング — 短期的なシグナルや相場の動きを捉えます。 • トレンドトレード — 方向性を評価し、トレンド内の機会を探します。 • 反転トレード — 反転の可能性があるゾーンや方向の変化を見つけます。 • 出来高トレード — 出来高に基づく情報を使い、市場の活発さを評価します。 エントリー・決済の矢印、トレンド情報、サポート・
SuperScalp Pro
Van Minh Nguyen
4.56 (36)
SuperScalp Pro - Professional Multi-Layer Confluence Scalping System SuperScalp Proは、クラシックなSupertrendに複数のインテリジェントな確認フィルターを追加した、高度なスキャルピングインジケーターです。より高い確率が期待できるBuy/Sellの取引機会を特定し、ダマシのシグナルを大幅に減らすことをサポートします。 明確なBuyとSellの矢印がチャート上に直接表示され、ATRに基づくStop LossとTake Profitのレベルがリアルタイムで自動計算されます。 購入後、設定方法や推奨設定についてのサポートが必要な場合は、私にご連絡ください。 SuperScalp Pro Auto Traderを使用して、シグナルを簡単に自動化できます: [Auto Trader] 推奨設定ファイルをダウンロード: [Set File] 完全なドキュメントは製品ブログでご覧いただけます: [User Guide] 最新情報を受け取るには公式チャンネルに参加してください: [Official Channel]
新たな王者が登場 - インジケーター + 注文管理表示(TP1 + TP2 + TP3)+ オプションのTelegramシグナル送信機能付き(無料) (完全なトレード&シグナルシステム) ゴールド向け最高のEA: Gold Slayer このインジケーターには、高度な戦略、カスタマイズ可能な注文管理システム、そしてエンベロープ拡張を組み合わせた平均回帰システムが搭載されています。さらに、RSIなど複数のインテリジェントな確認フィルターによって、高確率の反転エントリーをBUY・SELLシグナルとして検出します。 単にトレードを学ぶだけでなく、複数ポジションを効果的に管理し、過去に利益を出しているオープンポジションで損失トレードをカバーする方法も学べます。 M5向けに構築・最適化されており、流動性が高くシグナルの精度が安定しているBTCUSDとXAUUSDで優れたパフォーマンスを発揮します。 このインジケーターは、ATRを基に自動計算されたエントリー、ストップロス、テイクプロフィットレベルを備えた明確なLong・Shortシグナルを提供するため、リスク管理が最初から組み込まれています。 マ
伝説が帰ってきました:Entry Points Pro 10。 MQL5 Marketのトップ3に3年間入り続けた伝説的インジケーターの再始動です。 2つのバージョンで合計589件の高評価レビュー、毎日数千人のトレーダーが実際のトレードに使用し、デモのダウンロードは31,000件以上   MT4+MT5 。 私はこの5年間に寄せられたレビューをすべて読み、約束を並べる代わりに、その答えをバージョン10に組み込みました。1999年から相場に携わり、 誠実さ、自らの評判、そして顧客を大切にする 作者による製品です。 Entry Points Proのエントリーシグナルは、リペイント(再描画)を一切行いません。 そして今回初めて、これは作者の言葉ではなく検証可能な事実になりました。確定シグナルはローソク足の終値確定後にのみ表示され、自動テストで リペイントはゼロ と確認されています(EURUSD、XAUUSD、BTCUSDで2,486,568回の不変条件チェック、違反0件)。検証方法は公開されており、ストラテジーテスターでご自身で再現できます。 ご購入後は、必ずすぐにダイレクトメッセージでご
Neuro Poseidon is a new indicator by Daria Rezueva. It combines precise trading signals with adaptive TP/SL levels - creating best possible trades as a result! Message me and get  Neuro Poseidon Assistant  as a gift to automize your trading process! What makes it stand out? 1. Proven profitability on all assets and timeframes 2. Only confirmed BUY and SELL signals present on the chart 3. Adaptive TP & SL levels generated by the software for each trade 4. Easy to understand - suitable for al
M1 SNIPER は使いやすいトレーディングインジケーターシステムです。M1時間足向けに設計された矢印インジケーターです。M1時間足でのスキャルピングのためのスタンドアロンシステムとして、また既存のトレーディングシステムの一部としても使用できます。このトレーディングシステムはM1時間足での取引に特化して設計されていますが、他の時間足でも使用できます。元々、この手法はXAUUSDとBTCUSDの取引用に設計しましたが、他の市場においても役立つと考えています。 インジケーターのシグナルは、トレンドの方向と逆方向に取引できます。インジケーターのシグナルを利用して両方向に取引するのに役立つ特別な取引テクニックをご紹介します。この手法は、特別な動的なサポートとレジスタンスの価格帯を利用することに基づいています。 ご購入後、M1 SNIPER矢印インジケーターをすぐにダウンロードできます。さらに、M1 SNIPERツールのすべてのユーザーに、以下のスクリーンショットに表示されているApollo Dynamic SRインジケーターを無料で提供しています。この2つのインジケーターを組み合わせることで
Adaptive Price Action Engine インジケーターを購入すると、EAが無料に マルチタイムフレーム対応・自己最適化トレンド&ローソク足パターン分析 市場環境は常に変化しており、すべてのPrice Actionパターンが、あらゆる市場環境で同じ価値を持つわけではありません。 Adaptive Price Action Engine は、変化する市場環境への適応を目的として、 トレンド構造、マルチタイムフレーム分析、ローソク足パターン、統計的最適化 を1つの分析フレームワークに統合しています。 2つのアダプティブモード Dual Alpha Trend Mode 低い時間足と高い時間足のAlpha Trendパラメータを自動的に探索し、直近の市場動向に合わせてトレンド判定を適応させます。 Candlestick + Alpha Mode Alpha Trendによる市場レジーム判定と、 22種類の強気・弱気ローソク足パターン を組み合わせます。すべてのパターンを同じように扱うのではなく、さまざまなパターンの組み合わせを統計的に評価し、選択された市場環境において過去
ARIPoint
Temirlan Kdyrkhan
1 (4)
ARIPoint is a powerful trading companion designed to generate high-probability entry signals with dynamic TP/SL/DP levels based on volatility. Built-in performance tracking shows win/loss stats, PP1/PP2 hits, and success rates all updated live. Key Features: Buy/Sell signals with adaptive volatility bands Real-time TP/SL/DP levels based on ATR Built-in MA Filter with optional ATR/StdDev volatility Performance stats panel (Success, Profit/Loss, PP1/PP2) Alerts via popup, sound, push, or email Cu
Gann Made Easy   は、ミスター・ギャンの理論を使用した取引の最良の原則に基づいた、プロフェッショナルで使いやすい外国為替取引システムです。 W・D・ガン。このインジケーターは、ストップロスとテイクプロフィットレベルを含む正確な買いと売りのシグナルを提供します。 PUSH通知を利用して外出先でも取引可能です。 ご購入後、取引方法の説明と優れた追加インジケーターを無料で入手するには、私にご連絡ください! おそらく、ギャンの取引手法についてはすでに何度も聞いたことがあるでしょう。通常、ギャンの理論は初心者のトレーダーだけでなく、すでにある程度の取引経験がある人にとっても非常に複雑なものです。なぜなら、ギャンの取引手法は理論的にはそれほど簡単に適用できるものではないからです。私はその知識を磨き、最良の原則を私の外国為替インジケーターに組み込むために数年を費やしました。 このインジケーターは非常に簡単に適用できます。必要なのは、それをチャートに添付し、簡単な取引推奨事項に従うだけです。このインジケーターは常に市場分析の仕事を行い、取引の機会を探します。適切なエントリーポイントを検
「Scalper Vault」は、デイトレードで安定した成果を目指すトレーダーのために設計された、強力かつ充実した機能を備えたトレーディングシステムです。 この高精度なインジケーターは、それ単体で完結するトレーディングシステムとして機能し、FXやバイナリーオプションのトレーダーに、機関投資家レベルの分析を提供します。 ご購入後、ぜひご連絡ください。 トレードのヒントに加え、豪華なボーナスをプレゼントいたします! 「Scalper Vault」を活用すれば、勘に頼った判断や複雑な手動分析は不要です。使いやすいトレード手法に集中し、純粋に「エントリー・決済」という実行フェーズに専念できます。 高精度なトレンドフォロー・シグナル:中核となるアルゴリズムが市場構造を分析し、主要なトレンド方向に沿った高確率なシグナルを提示します。これにより、誤ったエントリーを大幅に削減できます。 精度の高い天井・底の検知:市場の勢いが尽きたポイントをスキャンし、反転の可能性が高いゾーンを特定します。 ギャン(Gann)理論に基づく売買ゾーン:数学的な「ギャン・レベル」を自動的にチャート上に描画します。機関投資
Auto Optimized SpeedAngle は、継続的なウォークフォワード最適化(WFO:Walk-Forward Optimization)によりカーブフィッティング(過剰最適化)を排除した、機関投資家レベルのモメンタムベクトルシステムです。市場レジームの変化時に効果が低下する静的な入力に依存せず、アウトオブサンプル(OOS)検証を用いてパラメーターを動的に再キャリブレーションすることで、表示されるシグナルが単なる過去の偶然ではなく、確実な統計的優位性に基づいていることを保証します。 主な機関投資家向けフレームワーク ウォークフォワード最適化エンジン: ルックバック期間やしきい値の数千に及ぶ組み合わせを継続的にスキャンし、データをインサンプルとアウトオブサンプルに厳格に分離します。未検証のデータ環境において数学的優位性が証明された場合にのみ、新しいパラメーター設定を採用します。 定量的目的関数: 単なる純利益の追求ではなく、機関投資家レベルの安定性指標をターゲットとします。システム品質ナンバー(SQN)、期待値(1トレードあたりの平均Rマルチプル)、またはネットRの最適化を選
Entry In The Zone and SMC Multi Timeframe is a real-time market analysis tool based on Smart Money Concepts (SMC), designed to analyze market structure, price direction, and key trading zones. It supports both Single-Timeframe and Multi-Timeframe Analysis, providing a clearer view of overall market structure across multiple timeframes, with real-time BUY / SELL signals designed with a strict focus on No-Repaint principles. The signals are designed to help filter unclear setups and evaluate tradi
トレンドキャッチャーインジケーター トレンドキャッチャーインジケーターは、開発者独自の適応型トレンド分析指標を組み合わせることで、市場価格の動きを分析します。短期的なノイズを除去し、根底にあるモメンタムの強さ、ボラティリティの拡大、価格構造の挙動に焦点を当てることで、真の市場方向性を特定します。また、移動平均線、RSI、ボラティリティフィルターなどの平滑化およびトレンドフィルタリング機能を備えたカスタマイズ指標も使用します。 実際の運用状況のモニタリングやその他の製品については、こちらをご覧ください: https://www.mql5.com/en/users/mechanic/seller ご注意ください。私はTelegramでEAや設定を販売していません。詐欺です。すべての設定はブログで無料で公開しています。 重要!ご購入後すぐにご連絡ください。手順とボーナスをお送りします!
トレーダーの皆さん、こんにちは! 多くの個人トレーダーは、動作の遅いウェブスクリプトに頼っています。真の収益性を実現するには、体系化されたフレームワークが必要です。 Astro AIインジケーターは、一般的なチャートオーバーレイではありません。これは、ターミナル上で直接動作する2つのエージェントを含む、コンパイル済みのニューラルネットワークです。 システムの具体的な技術は以下のとおりです。 1. エージェント1:アナリスト(グラフィカルニューラルネットワーク - GNN) 市場は孤立した価格バーではなく、相互に連結されたデータネットワークです。 機能:エージェント1は、グラフィカルニューラルネットワークを使用して、これらの複雑で非線形な関係をマッピングします。 利点:一般的なインジケーターは過去の移動平均しか考慮しませんが、当社のGNNは市場の深い構造的関係をリアルタイムで処理し、個人トレーダーの取引量が大きな影響を与える前に、隠れた相関関係を明らかにします。 2. エージェント2:エグゼキューター(近接戦略最適化 - PPO) パターン認識は、戦いの半分に過ぎません
このインジケーターを購入された方には、以下の特典を 無料 で提供しています: 各トレードを自動で管理し、ストップロスとテイクプロフィットを設定し、戦略ルールに基づいてポジションを決済する補助ツール 「Bomber Utility」 様々な銘柄に合わせたインジケーターの設定ファイル(セットファイル) 「最小リスク」、「バランスリスク」、「待機戦略」 の3つのモードで使用できる Bomber Utility 用の設定ファイル このトレーディング戦略をすぐに導入・設定・開始できる ステップバイステップのビデオマニュアル ご注意: 上記の特典を受け取るには、MQL5のプライベートメッセージシステムを通じて販売者にご連絡ください。 オリジナルのカスタムインジケーター 「Divergence Bomber(ダイバージェンス・ボンバー)」 をご紹介します。これは、MACDのダイバージェンス(乖離)戦略に基づいた 「オールインワン」型のトレーディングシステム です。 このテクニカルインジケーターの主な目的は、価格とMACDインジケーターの間に発生するダイバージェンスを検出 し、将来の価格の動きを示
PainX GainX Blue Spike Fusion AI Advanced Synthetic Index Spike Detection Indicator for MetaTrader 5 Discover potential spike setups with a clear, organized, and professional trading interface. PainX GainX Blue Spike Fusion AI is a specialized indicator designed for traders who monitor synthetic indices and want a structured way to observe potential price spike opportunities. The indicator combines signal monitoring, market-condition analysis, visual alerts, and event tracking in one convenient
Unix Scalper — MetaTrader 5 ご購入後、MQL5で私にメッセージをお送りいただくと、Smart Universal Expert Advisorを無料で受け取れるほか、オンライン講座、PDFマニュアル、非公開グループへのアクセスもご利用いただけます。 セットアップを見つけ、取引プランを確認し、取引方法を選ぶ。 UNIX Scalperは、市場分析、BUY/SELL/WAITの判断、Entry、Stop Loss、TP1、TP2の水準を、見やすいパネルにまとめています。 シグナルと取引プランを確認 • 明確な判断:BUY、SELL、WAIT。 • 明示された水準:Entry、Stop Loss、TP1、TP2。 • 複数時間足の一覧:パネル上で各時間足のシグナルを比較。 • 判断を支える分析:トレンド、モメンタム、出来高、ボラティリティ、サポートとレジスタンス、市場の質。 • 選べるレイアウト:Minimized、Compact、Standard、Full。 シグナルと各水準を確認し、そのセットアップがご自身の取引ルールに合うか判断してください。 ゴール
Volatility Master for MetaTrader is a real-time dashboard tool that scans up to  50 symbols  to identify high-volatility , trending markets instantly. With bullish/bearish signals, customizable alerts, and a user-friendly interface, it helps you avoid range-bound conditions and focus on high-probability trades. Clarity leads to confidence. Trade confidently and protect your capital effectively with this powerful dashboard. We don't offer free or bonus indicators in exchange of reviews from you.
Atomic Analyst — MetaTrader 5 ご購入後、MQL5で私にメッセージをお送りいただくと、Smart Universal Expert Advisorを無料で受け取れるほか、オンライン講座、PDFマニュアル、非公開グループへのアクセスもご利用いただけます。 Atomic Analystは、プライスアクション、トレンドの方向、エントリー・決済シグナル、損切り水準、複数の利確水準をチャート上にまとめて表示します。 シグナルを確認し、取引の状況を理解する Atomic Analystは、分析結果をわかりやすい視覚情報として表示します。 • エントリーの候補を見つけるための買い・売りの矢印。 • 取引計画に役立つ損切り水準と複数の利確水準。 • 市場の方向性を評価するトレンド、強さ、モメンタムの指標。 • より広い市場背景を比較する複数時間足の分析。 • 変化する状況を追うための色分けされたローソク足とアラート。 シグナルと補助分析を併せて確認し、その取引機会がご自身のルールに合うかを判断してください。 短期の取引機会から、より大きな値動きまで Atomic A
Break and Retest Hunter is a powerful MetaTrader 5 indicator designed to automatically identify support and resistance levels, breakout structures, and potential retest opportunities in real time. Bonus Indicator: After purchasing Break and Retest Hunter , contact me to receive Trade Indicator Assistant EA completely free as a bonus utility. $65 for the next 10 copies . Next price is $120.  Combining adaptive market analysis, clear BUY/SELL signals, Fibonacci-based profit targets, and a premiu
FiboSniper Pro – Multi-Filter Fibonacci System with Auto SL/TP and Control Panel FiboSniper Proは、動的なFibonacci Envelopesと複数の確認フィルターを組み合わせ、選別されたBuyおよびSellシグナルを生成するテクニカルインジケーターです。FibonacciレベルはMoving AverageとATRを基に計算され、その後ADX、EMA、RSI、ATR、Volume、Time、Candle構造によってフィルタリングされます。インジケーターは、ATRに基づく自動Stop LossおよびTake Profitレベルをチャート上に直接表示し、さらに迅速な調整が可能なインタラクティブControl Panelを提供します。 購入後、推奨設定ファイルと詳細な使用方法については、私にご連絡ください。 Auto Trader Xを使用してFiboSniper Proのシグナルを自動化できます: [Auto Trader X] User GuideとSet Files: [Click her
Quantum TrendPulse を ご紹介します。これは、   SuperTrend   、   RSI   、および Stochastic のパワーを 1 つの包括的なインジケーターに組み合わせて、取引の可能性を最大限に引き出す究極の取引ツールです。精度と効率を求めるトレーダー向けに設計されたこのインジケーターは、市場のトレンド、勢いの変化、最適なエントリー ポイントとエグジット ポイントを自信を持って特定するのに役立ちます。 主な特徴: SuperTrend 統合: 現在の市場動向に簡単に追従し、収益性の波に乗ることができます。 RSI精度: 買われすぎと売られすぎのレベルを検出し、市場の反転のタイミングに最適で、SuperTrendのフィルターとして使用されます。 確率的精度: 確率的振動を活用して、変動の激しい市場で隠れたチャンスを見つけます。SuperTrend のフィルターとして使用されます。 マルチタイムフレーム分析:   M5 から H1 または H4 まで、さまざまなタイムフレームで市場を常に把握します。 カスタマイズ可能なアラート: カスタム取引条件が満たされ
FX Power: 通貨の強弱を分析して、より賢い取引を実現 概要 FX Power は主要通貨と金の実際の強弱をあらゆる市場状況で理解するための必須ツールです。強い通貨を買い、弱い通貨を売ることで、 FX Power は取引の意思決定を簡素化し、高い確率の取引機会を見出します。トレンドを追従する場合でも、極端なデルタ値を使用して反転を予測する場合でも、このツールはあなたの取引スタイルに完全に適応します。ただ取引するだけではなく、 FX Power で賢く取引をしましょう。 1. なぜ FX Power がトレーダーにとって非常に有益なのか 通貨と金のリアルタイム強弱分析 • FX Power は主要通貨と金の相対的な強弱を計算し、マーケットダイナミクスに関する明確な洞察を提供します。 • どの資産がリードしているか、または後れを取っているかを監視して、取引するペアを賢く選びましょう。 マルチタイムフレームの包括的なビュー • 短期、中期、長期のタイムフレームで通貨と金の強弱を追跡し、マーケットトレンドに基づいて取引戦略を調整できます。 • スキャルピングからスイングトレード
発見が困難で頻度が少ないため、分岐は最も信頼できる取引シナリオの1つです。このインジケーターは、お気に入りのオシレーターを使用して、通常の隠れた分岐点を自動的に見つけてスキャンします。 [ インストールガイド | 更新ガイド | トラブルシューティング | よくある質問 | すべての製品 ] 取引が簡単 通常の隠れた発散を見つけます 多くのよく知られている発振器をサポート ブレイクアウトに基づいて取引シグナルを実装します 適切なストップロスおよび利益レベルを表示します 設定可能なオシレーターパラメーター カスタマイズ可能な色とサイズ バー単位でサイズ別に分岐をフィルタリング パフォーマンス統計を実装します 電子メール/音声/視覚アラートを実装します 幅広い市場の見通しを提供するために、異なるオシレーターを使用して、干渉なしで同じチャートにインジケーターを何度もロードできます。このインジケーターは、次のオシレーターをサポートしています。 RSI CCI MACD オスマ 確率的 勢い 素晴らしい発振器 加速器発振器 ウィリアムズパーセントレンジ 相対活力指数 特に外国為替市場では、
DayTrader PRO DayTrader PROは、ジョン・エリュース(John Ehlers)のラグuerreフィルターと強力な自動最適化エンジンを組み合わせた、高度なトレーディング・インジケーターです。固定されたパラメーターを使用するのではなく、直近の市場状況に基づいて最適な設定を自動的に検索するため、手動による絶え間ない調整をすることなく、変化する市場のボラティリティに適応できます。 本インジケーターは、明確な「買い(BUY)」および「売り(SELL)」シグナルを生成し、現在の市場ボラティリティから算出された適応型のストップロス(Stop Loss)およびテイクプロフィット(Take Profit)レベルを表示します。トレンド、効率レシオ(Efficiency Ratio)、ボラティリティ、およびローソク足フィルターが内蔵されており、精度の低いセットアップを排除し、シグナルの精度を向上させます。 リアルタイム・パフォーマンスパネルには、現在最適化されている設定、プロフィットファクター(Profit Factor)、勝率(Win Rate)、ドローダウン(Drawdown)、
Gartley Hunter Multi - An indicator for searching for harmonic patterns simultaneously on dozens of trading instruments and on all possible timeframes. Manual (Be sure to read before purchasing) | Version for MT4 Advantages 1. Patterns: Gartley, Butterfly, Shark, Crab. Bat, Alternate Bat, Deep Crab, Cypher 2. Simultaneous search for patterns on dozens of trading instruments and on all possible timeframes 3. Search for patterns of all possible sizes. From the smallest to the largest 4. All fou
FX Trend NG:次世代マルチマーケット・トレンドインテリジェンス 概要 FX Trend NG は、複数の時間足に対応したプロフェッショナル向けトレンド分析およびマーケット監視ツールです。 市場全体の構造を数秒で把握することができます。 複数のチャートを切り替える必要はありません。どの銘柄がトレンド中なのか、どこでモメンタムが弱まっているのか、そしてどの時間足で強い整合性があるのかを瞬時に確認できます。 ローンチ特別オファー – FX Trend NG を $30(6ヶ月) または $80 永久ライセンス でご利用いただけます。 すでに Stein Investments のユーザーですか? -> メッセージを送信 して、プライベートグループへアクセスしてください。 セットアップや詳細情報が必要ですか? -> Stein Investments 公式ページ をご覧ください。 1. FX Trend NG が他と異なる理由 3ステート・トレンドロジック ― Buy と Sell だけではない • 多くのインジケーターは Buy または Sell の2状態のみを表示します。
IX Power MT5
Daniel Stein
4.92 (13)
IX Power: 指数、商品、暗号資産、外国為替市場の洞察を発見 概要 IX Power は、指数、商品、暗号資産、外国為替市場の強弱を分析するための多用途ツールです。 FX Power が全ての利用可能な通貨ペアデータを活用して外為ペアで最高の精度を提供する一方、 IX Power は基礎資産の市場データにのみ焦点を当てています。この特性により、 IX Power は非外為市場に最適であり、単純な外為分析にも信頼性の高いツールです。どのチャートでもスムーズに機能し、取引判断を向上させるための明確で実行可能な洞察を提供します。 1. IX Power がトレーダーにとって価値がある理由 複数市場での強弱分析 • IX Power は指数、商品、暗号資産、外為シンボルの強弱を計算し、それぞれの市場に合わせた洞察を提供します。 • US30、WTI、ゴールド、ビットコイン、または通貨ペアなどの資産を監視して取引機会を発見できます。 幅広い市場に適応 • 外為取引では、 FX Power が関連する全ての通貨ペアを分析することで比類のない精度を提供します。 • IX Power
初心者やエキスパートトレーダーに最適なソリューション! このインジケーターは、独自の機能と新しい計算式を取り入れた、ユニークで高品質、かつ手頃な価格のトレーディングツールです。たった1枚のチャートで28の為替ペアの通貨強度を読み取ることができます。新しいトレンドやスキャルピングチャンスの引き金となるポイントを正確に特定することができるので、あなたのトレードがどのように改善されるか想像してみてください。 ユーザーマニュアルはこちら  https://www.mql5.com/en/blogs/post/697384 これが最初の1本、オリジナルだ! 価値のないクローンを買わないでください。 特別な サブウィンドウの矢印で強い通貨の勢いを表示 GAPがあなたのトレードを導く! 基準通貨や気配値が売られすぎ・買われすぎのゾーン(外相フィボナッチレベル)にあるとき、個別チャートのメインウィンドウに警告表示。 通貨がレンジの外側から反落した場合、プルバック/リバーサルのアラート。 クロスパターンの特別なアラート 複数の時間枠を選択可能で、トレンドを素早く確認できます。通貨強度のライン
作者のその他のプロダクト
The last candle before the move, highlighted — automatically. Order blocks are one of the most-watched concepts in Smart Money and price-action trading: the last opposing candle before an impulsive move, marking where large orders were likely filled. Drawing them by hand is slow, subjective and inconsistent. This tool maps them with the same rules, on every chart, every time. WHAT IT DOES Nemo Order Blocks scans price action and plots two kinds of zones, extended forward so you can watch price
Trend, volatility and timing in one clean read. Every trend trader juggles the same three questions: which way is the market leaning, is price overstretched, and where would a sensible stop go? Apex Trend Analyzer answers all three on a single chart — with a non-repainting arrow that marks the exact bar where conditions aligned. WHAT IT DOES TREND DIRECTION — read from a fast/slow moving-average relationship (EMA or SMA, fully selectable). Always visible, never ambiguous. VOLATILITY CONTEXT —
Four timeframes, one traffic light. The oldest edge in trading is also the most ignored: trade WITH the alignment of timeframes, not against it. The problem is that checking four charts before every trade is slow — and by the time you have flipped through them, the moment is gone. Quattro Semafori ("four traffic lights") reads the trend on FOUR timeframes simultaneously and shows the result as one simple panel. WHAT IT DOES Each of the four timeframes you choose gets its own LONG or SHORT read
Know when NOT to trade. Ask any experienced trader where their money leaks: it is rarely the big losing trade. It is the slow bleed of a dozen small stops taken inside a range, fighting a market that was going nowhere. The Choppy Market Filter has one job: tell you, objectively, when the market is trendless — so you stop paying the chop tax. WHAT IT DOES Using trend-strength logic (ADX-based), the filter continuously classifies conditions: CHOPPY / RANGE — trend strength below your threshold.
Does your market really lean bullish on Tuesdays? Stop guessing — measure it. Traders repeat weekday folklore for years without ever checking. Statistical Bias checks — on the actual history of the instrument on YOUR chart — and shows the result in a compact, always-visible panel. WHAT IT DOES Over your chosen lookback, the indicator computes for each weekday (Monday to Friday) the percentage of days that closed up , and displays the full weekly profile in a clean panel — with today's weekday
Who is actually in control? Price tells you what happened. Volume pressure tells you who made it happen — and whether they are still pushing. Delta Volume Filter estimates buying versus selling pressure bar by bar and paints it as an intuitive colored histogram, so you can see conviction (or the lack of it) at a glance. WHAT IT DOES The indicator combines Close Location Value (CLV) — where each bar closed within its range — with tick volume, producing a signed pressure estimate per bar: GREEN-
Smart Money structure, marked for you. Break of Structure and Change of Character are the backbone of price-action and SMC analysis: as long as the market prints higher highs, the uptrend is alive; the first break the other way changes the story. Every SMC trader draws these levels — usually by hand, slowly, and each one slightly differently. This tool does it automatically, consistently, on every chart. WHAT IT DOES The indicator auto-detects swing highs and swing lows in real time and labels
Fair Value Gaps, marked in real time. When price moves so fast that it leaves a gap between candle ranges, it leaves something behind: an imbalance — a zone where one side never got to transact. Fair Value Gaps are among the most-watched objects in modern price-action trading, because price so often returns to "rebalance" them. Finding them by eye across timeframes is tedious. This tool marks every one, live. WHAT IT DOES The detector scans each new three-candle sequence and plots: BULLISH FVG
Where the next battle happens. Strong moves are born in quiet places: a tight consolidation, then an explosion. That base — where positions were quietly built before the move — is a supply or demand zone, and markets have a long memory for them. This indicator finds those bases automatically and projects the zones forward, so you plan your reactions in advance instead of chasing candles. WHAT IT DOES The indicator detects consolidation bases that precede strong impulsive moves and plots them a
Where the stops are. Why does price so often spike just beyond an obvious high — and then reverse? Because that is where the orders sit. Clusters of stops above Equal Highs and below Equal Lows are pools of liquidity, and price is frequently drawn to them before the real move. This indicator maps those pools automatically, so you anticipate the sweep instead of being the sweep. WHAT IT DOES The indicator tracks swing highs and swing lows and marks the clustered reference levels where liquidity
Shadow Trap Reversal — reversal arrows from exhaustion wicks and false breaks Most reversals leave the same fingerprint: the crowd pushes one last time, gets trapped, and price snaps back. Shadow Trap Reversal finds that fingerprint automatically and drops a clean arrow on your chart — no repainting on closed bars, no clutter. TWO PROVEN SIGNALS IN ONE TOOL • Exhaustion Wick — after a directional run of several candles, a bar rejects the trend with a wick longer than half its body and closes t
Channel Rider RSI — adaptive pullback buys inside rising channels Fixed RSI 30/70 levels fail in trends: a strong instrument never reaches 30, so you never buy the dip. Channel Rider RSI fixes that with a rolling-percentile RSI — it defines "oversold" from the asset's own recent behaviour, so the signal keeps working whether you trade a quiet blue-chip or a volatile index. THE THREE-FILTER ENTRY 1. Rising channel — linear-regression lines on highs and lows must both slope upward. No signals in
フィルタ:
レビューなし
レビューに返信