Volume Zones Internal Visualizer MT5 Multi TF
- 指标
-
Duc Hoan Nguyen
 ->| 我是一名专业的开发者和程序员,专注于MQL4、MQL5和TradingView的Pine Script编程,拥有在MT4、MT5和TradingView平台上成功构建高性能定制解决方案的丰富经验。多年来,我在金融和交易领域积累了丰富的工作经验,为全球客户交付了多种项目。我的专长是开发自动交易系统、自定义指标和满足客户特定需求的金融工具。
->| 我注重专业、创新和始终如一的承诺,为MT4和MT5提供强大的指标和定制解决方案,以提升交易效率。我热衷于帮助交易者获得竞争优势,提供最大化性能和交易洞察的工具。 - 版本: 2.0
- 更新: 27 二月 2025
- 激活: 10
特别优惠: ALL TOOLS ,每个只需 $35!
New tools will be $30 for the first week or the first 3 purchases!
Trading Tools Channel on MQL5: Join my MQL5 channel to update the latest news from me
Volume Zones Internal Visualizer Multi-Timeframe ——如果您想在更高周期图表上查看更低周期的详细交易量情况,这是最理想的解决方案。它是一款功能强大且直观的交易量分析工具,支持多周期功能,能满足您的需求!
查看更多 MT4 版本: Volume Zones Internal Visualizer MT4 Multi TF
查看更多产品: All Products
-
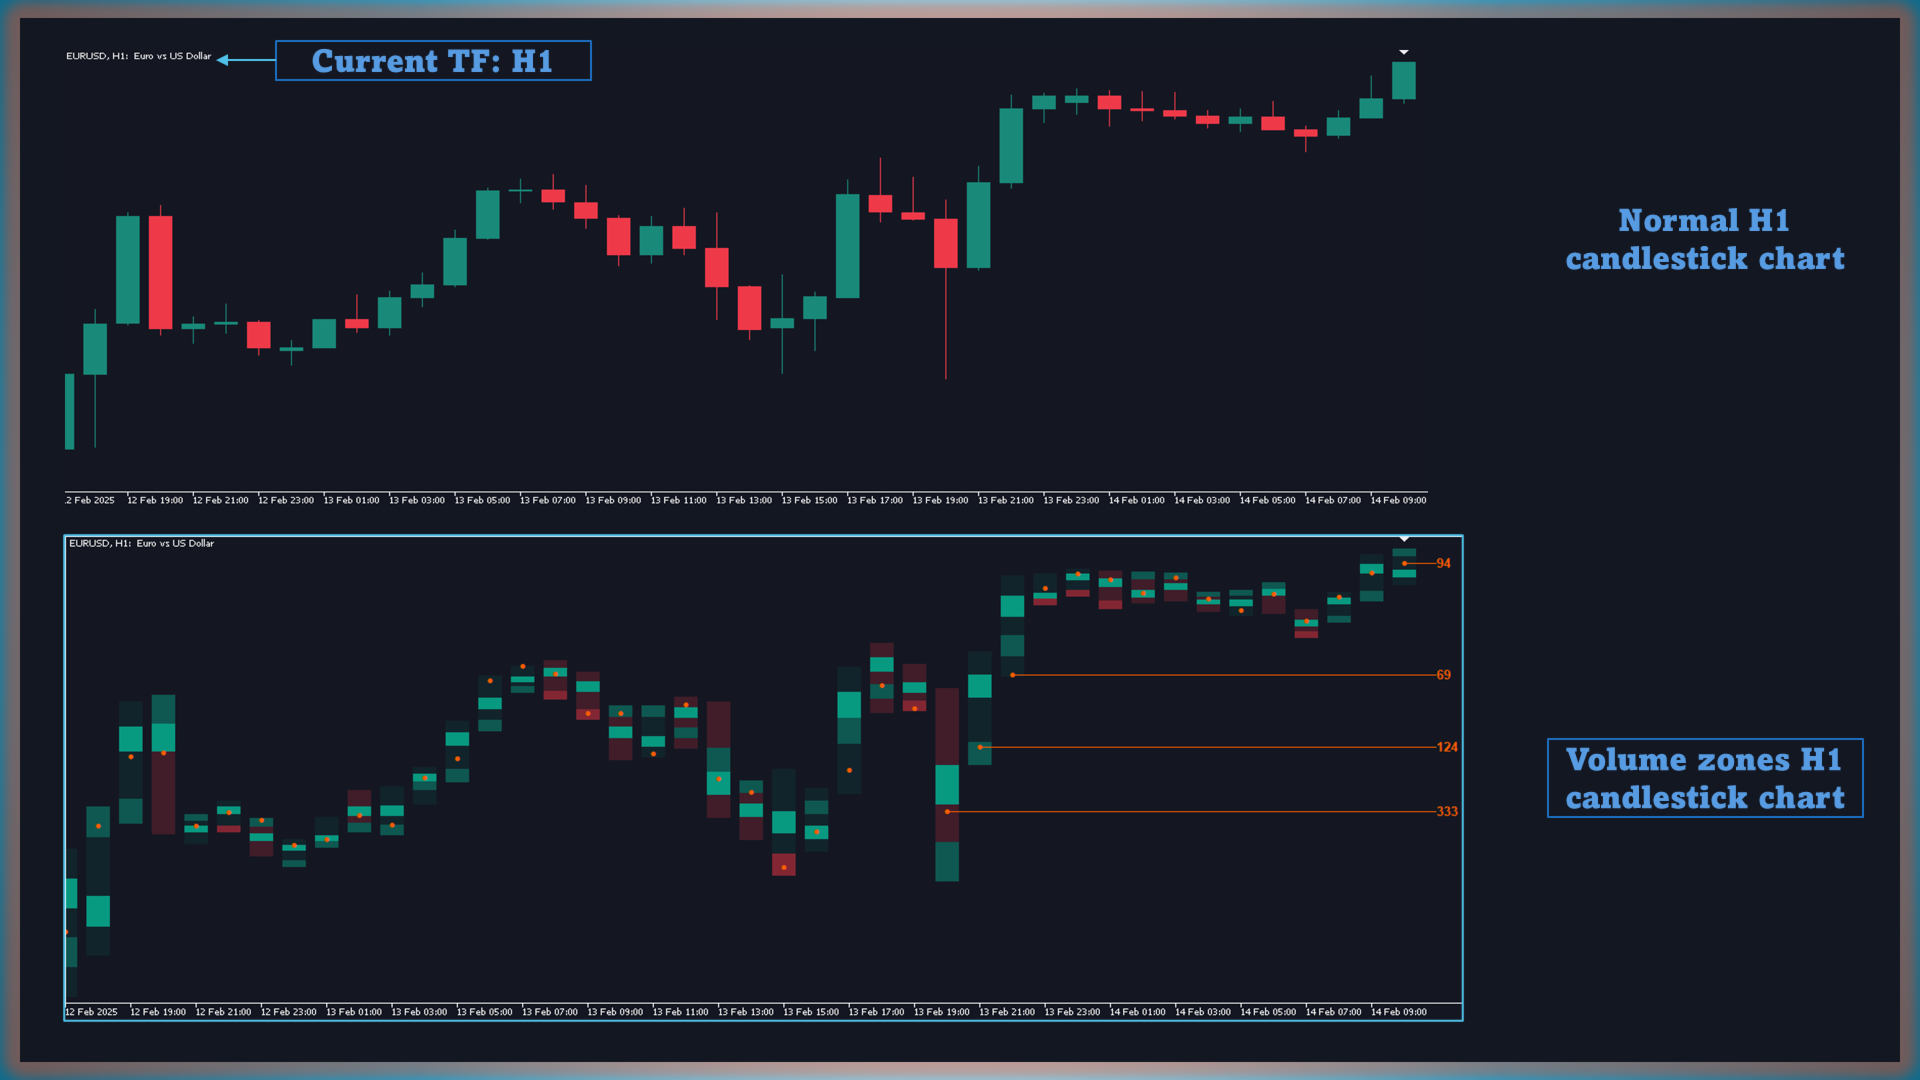
在高周期图表上显示低周期交易量
- 此指标提供 “alternate candle” 样式,可让您无需离开高周期图表就能快速定位低周期的交易量积聚位置。
-
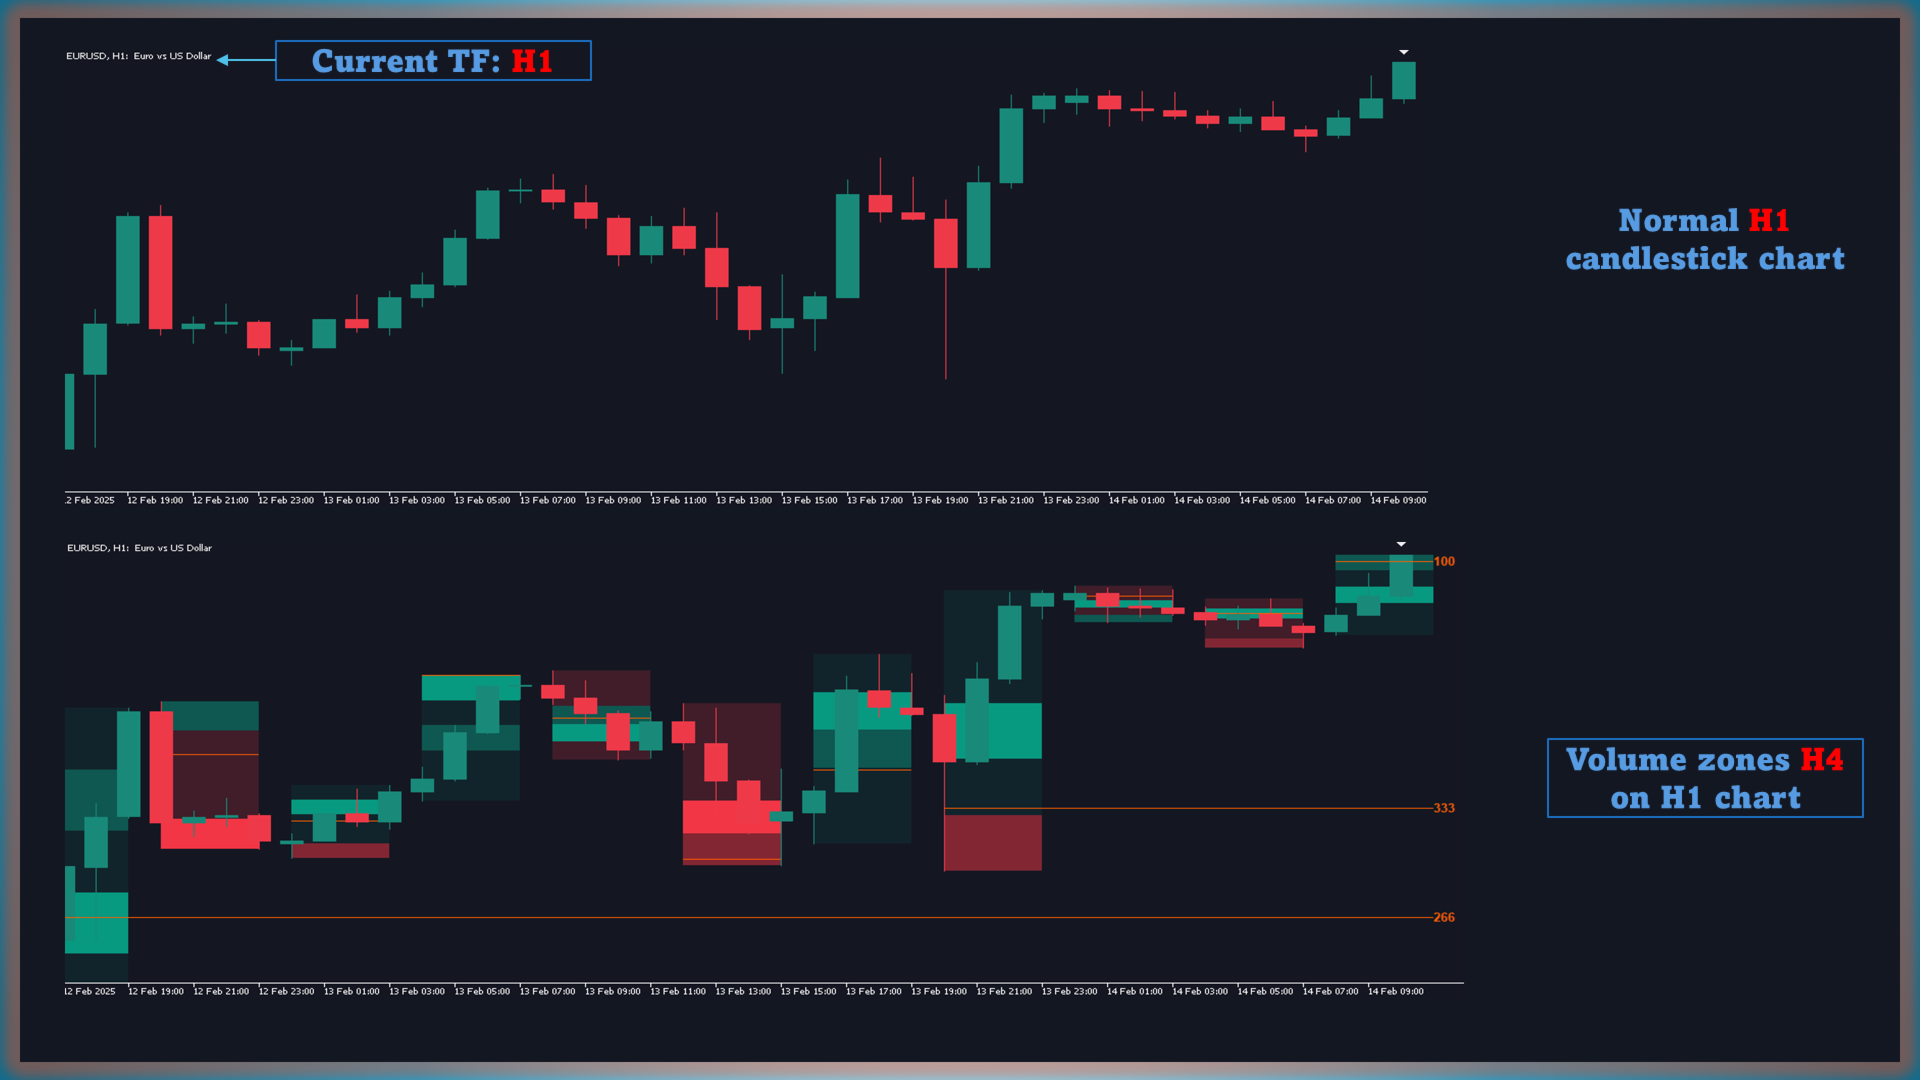
多周期分析
- 通过 Intrabar Timeframe 功能,您可以选择要监控的低周期(如 M1、M5、M15 等)。所有低周期的交易量数据将被整合,并显示在每根高周期蜡烛的时段内,用于综合分析。
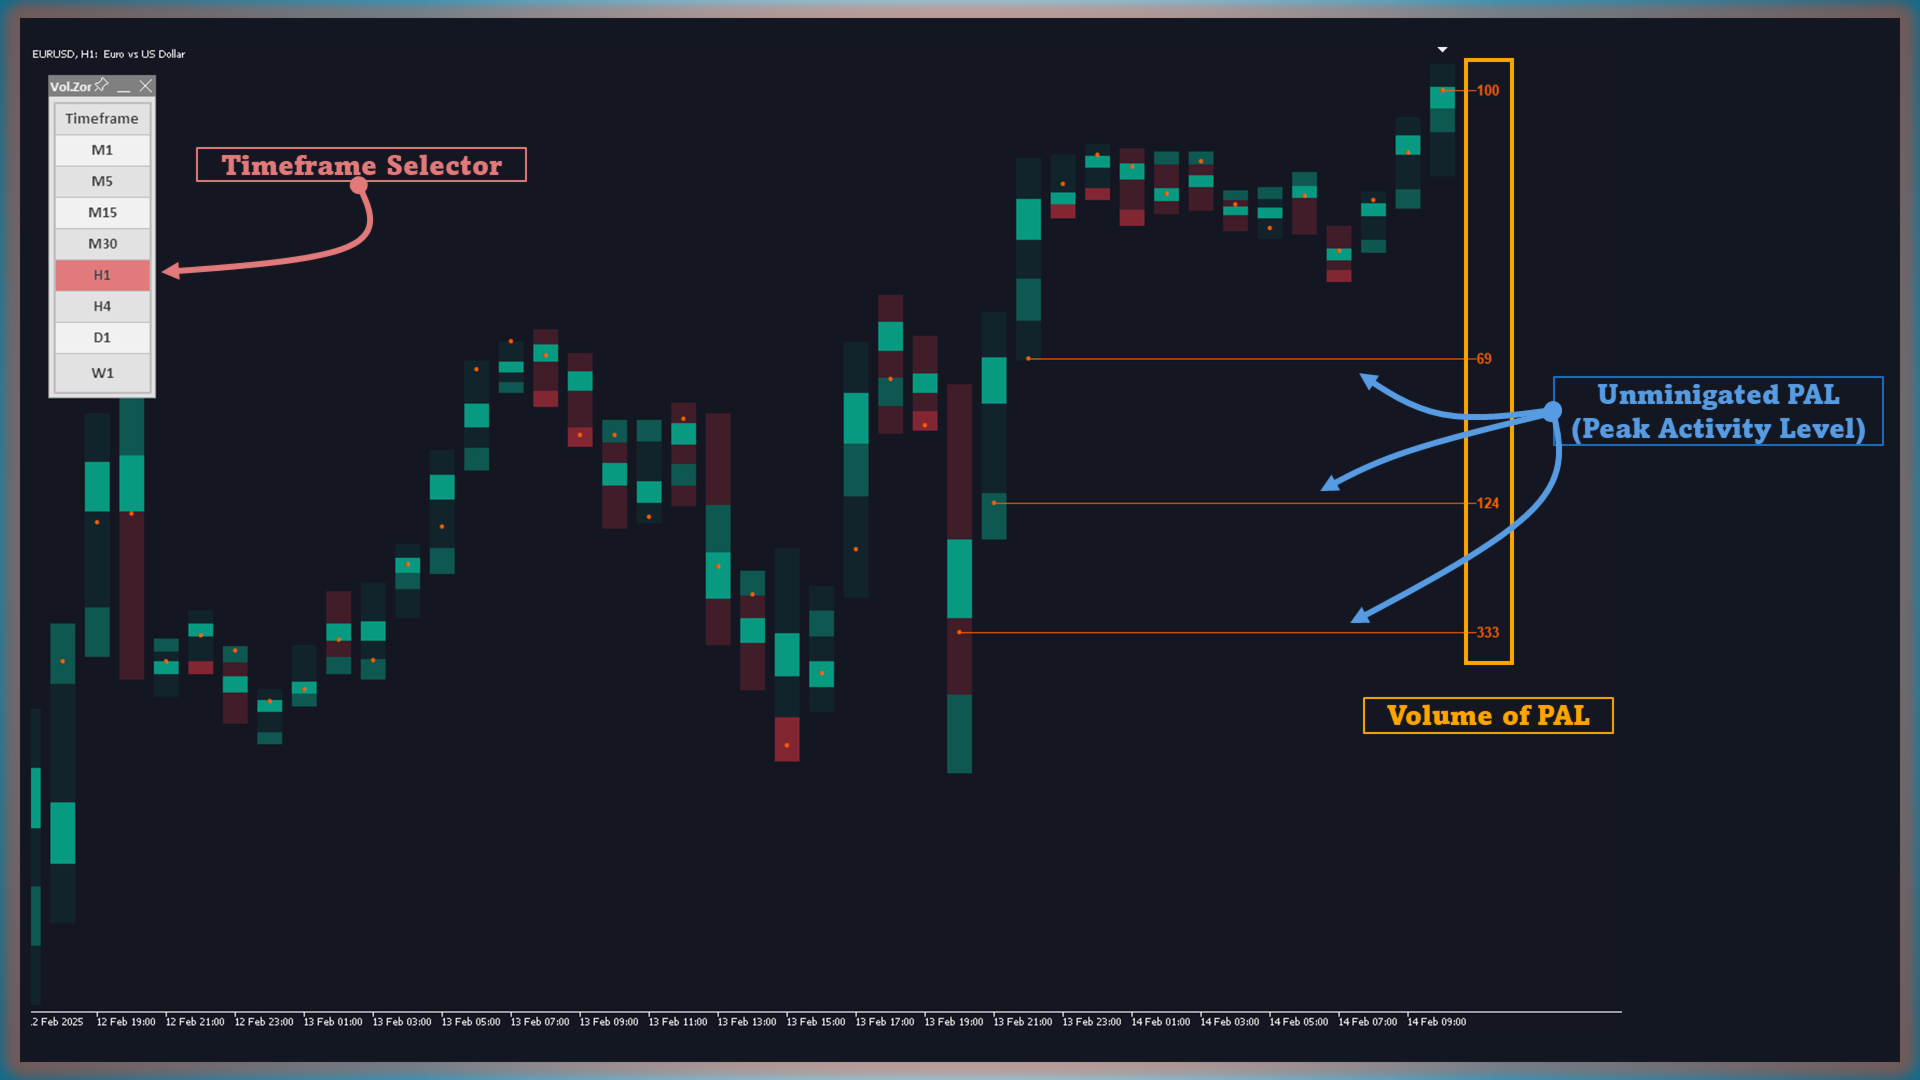
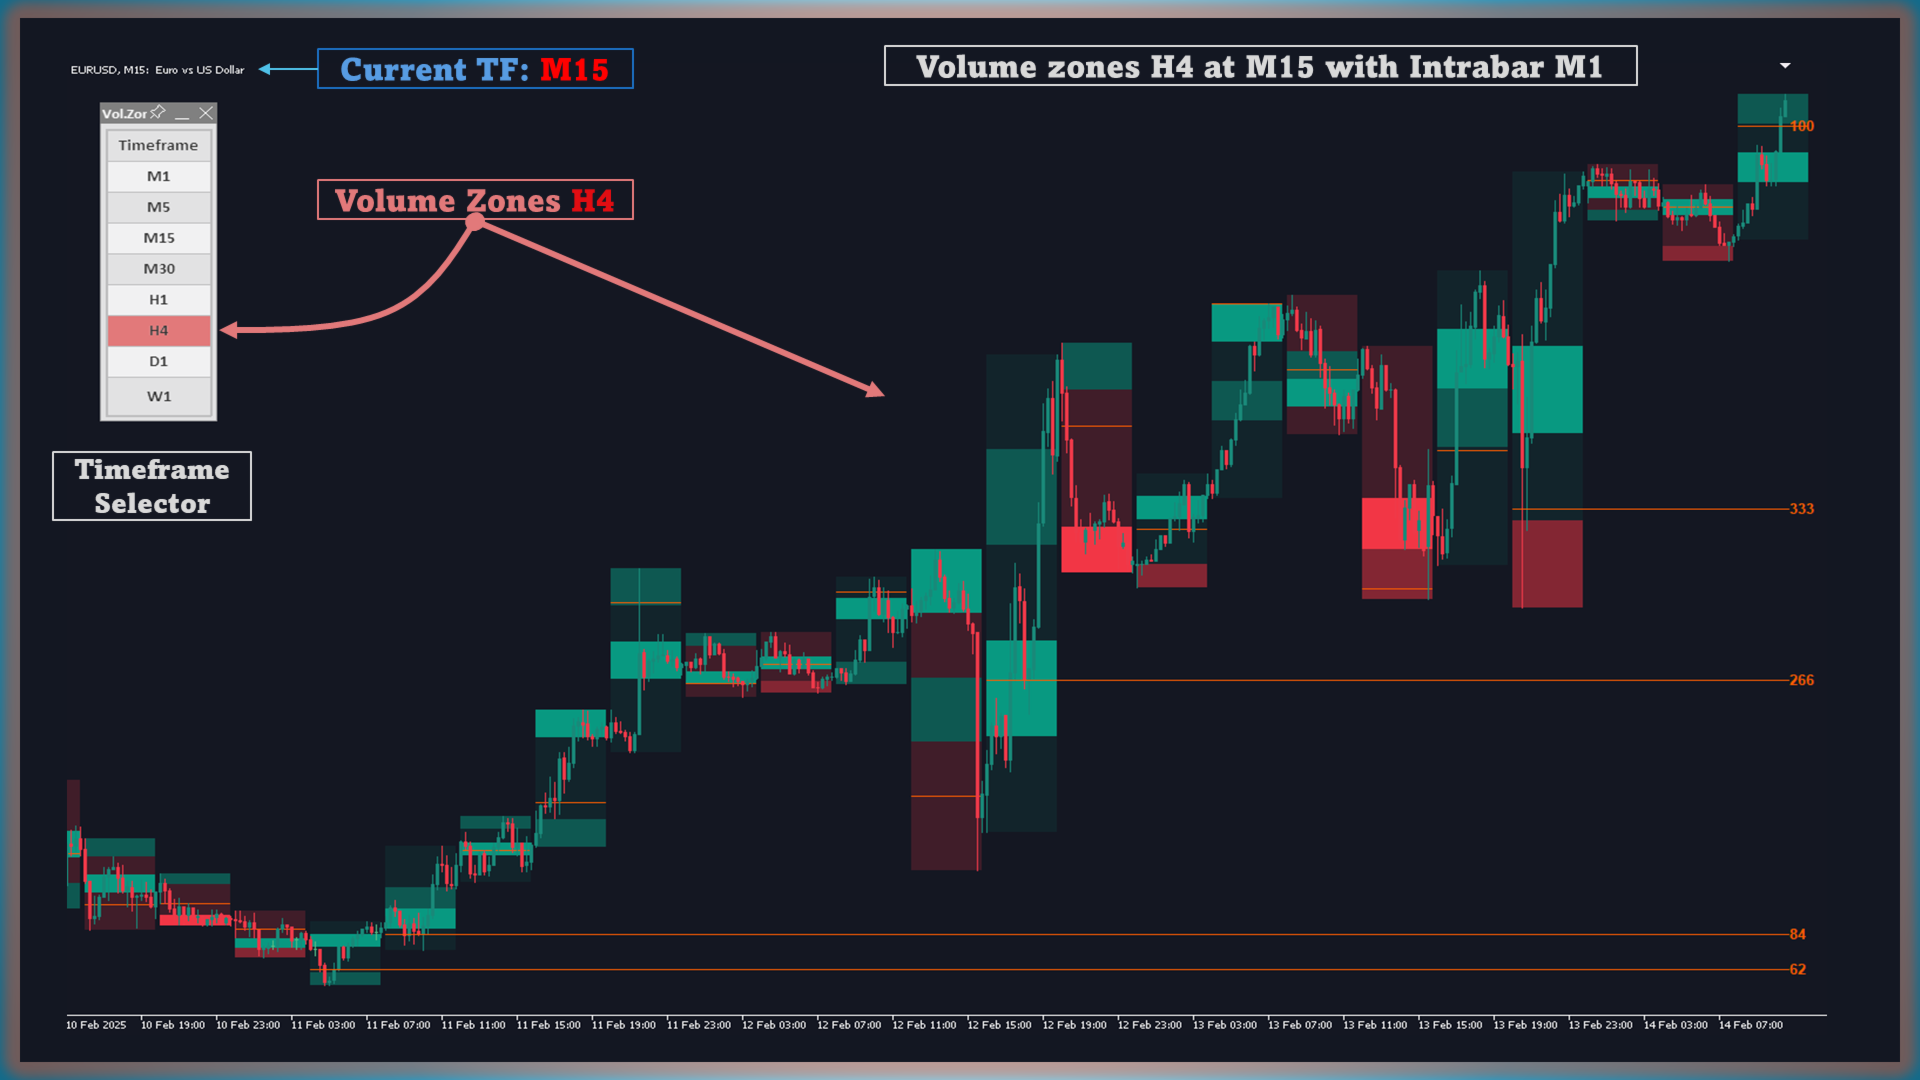
- 借助 Timeframe Selector 功能,您可以轻松选择想在任意周期中显示的高周期交易量区域,例如,您可以在 M15 上显示 H4 的交易量区域,同时使用 Intrabar M1(详情见截图)
-
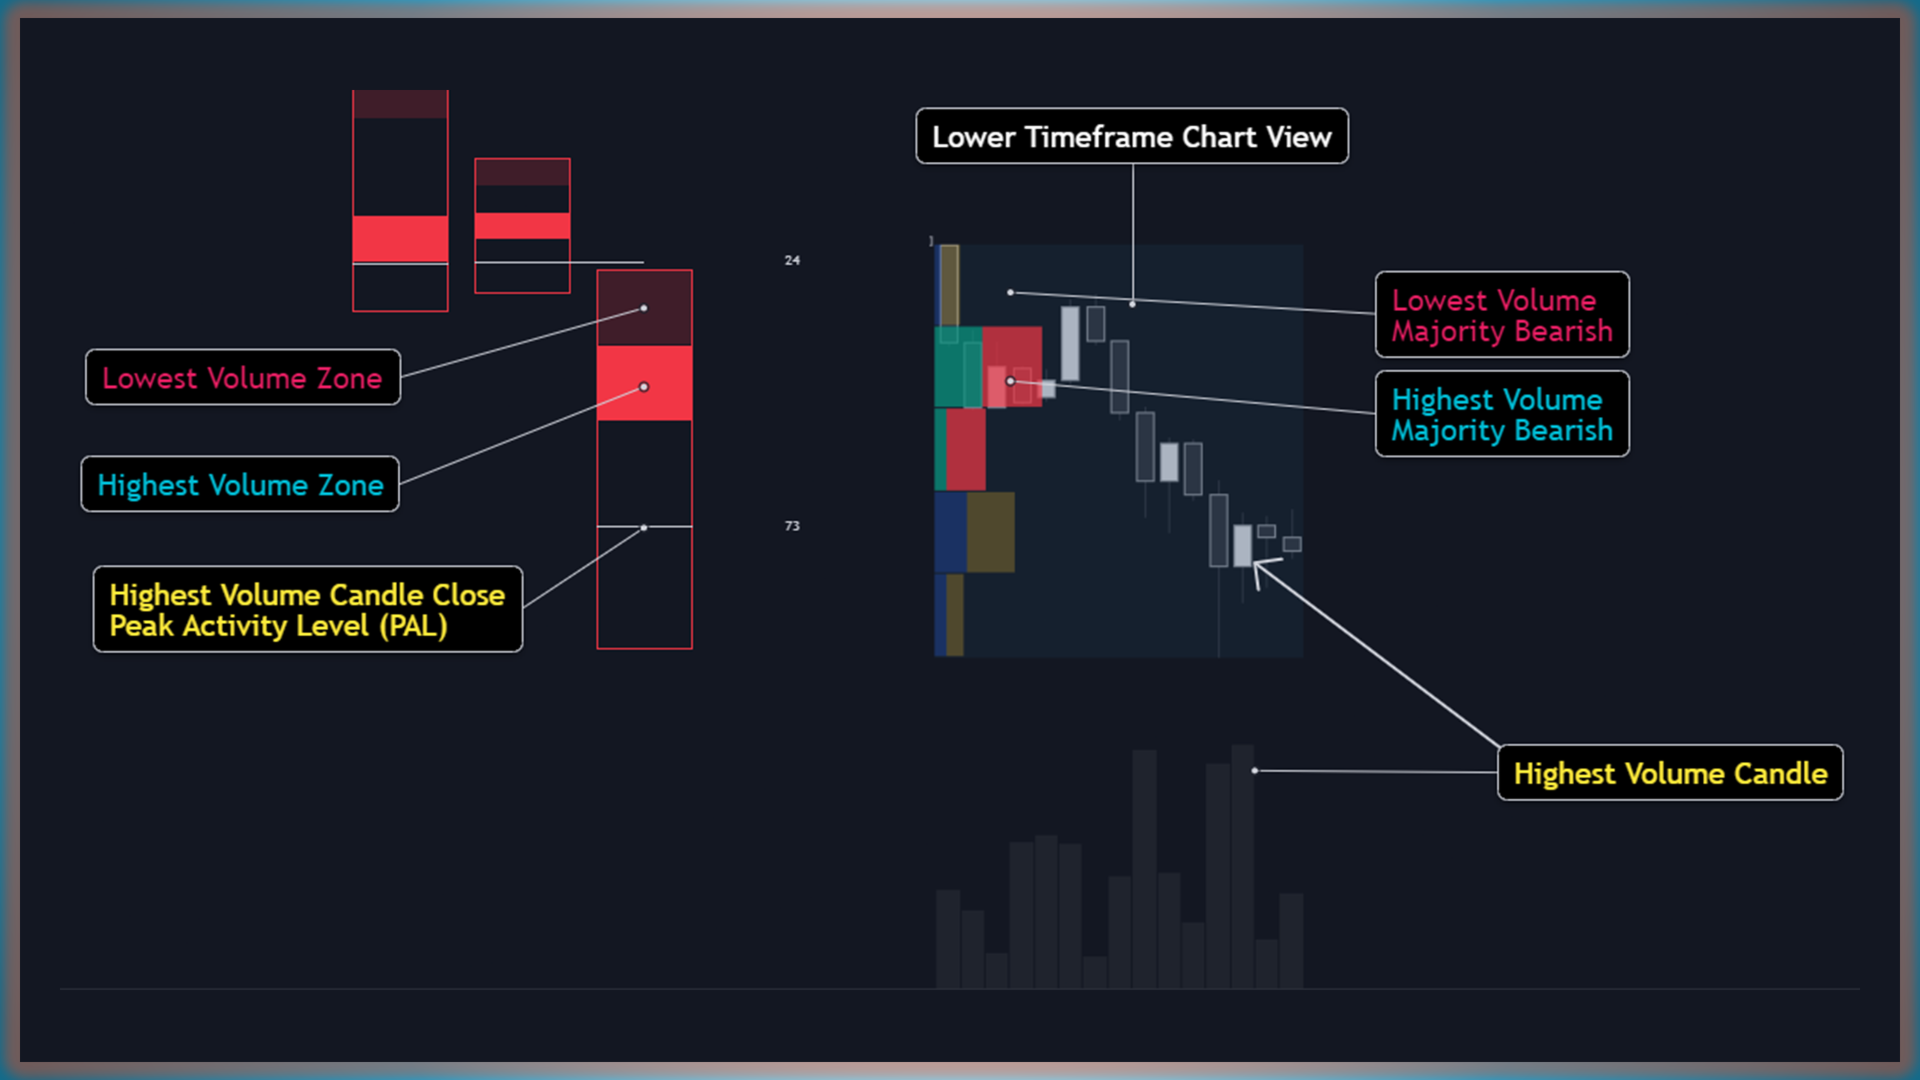
发现 “峰值活动水平”(PAL)
- 该指标会自动识别具有最高交易量的低周期蜡烛,并将该蜡烛的收盘价标记为 PAL,这是在高周期蜡烛时段内累积最多交易量的关键位置。
- 每个 PAL 会向后续价格走势延伸,直到它被 “穿越” 或 “消化”,从而标示出潜在的进场或平仓机会。
-
识别最高和最低交易量区域
- 基于低周期数据构建 Volume Profile,该指标能准确找出两个核心区域:
- Highest Volume Zone: 表示交易量最高的集中区。
- Lowest Volume Zone: 显示相对较低(但仍具有参考价值)的交易量集中区域。
- 基于低周期数据构建 Volume Profile,该指标能准确找出两个核心区域:
-
配置 Intrabar Timeframe
- 根据您的交易风格选择要跟踪的低周期(M1、M5、M15 等)。
-
多周期设置
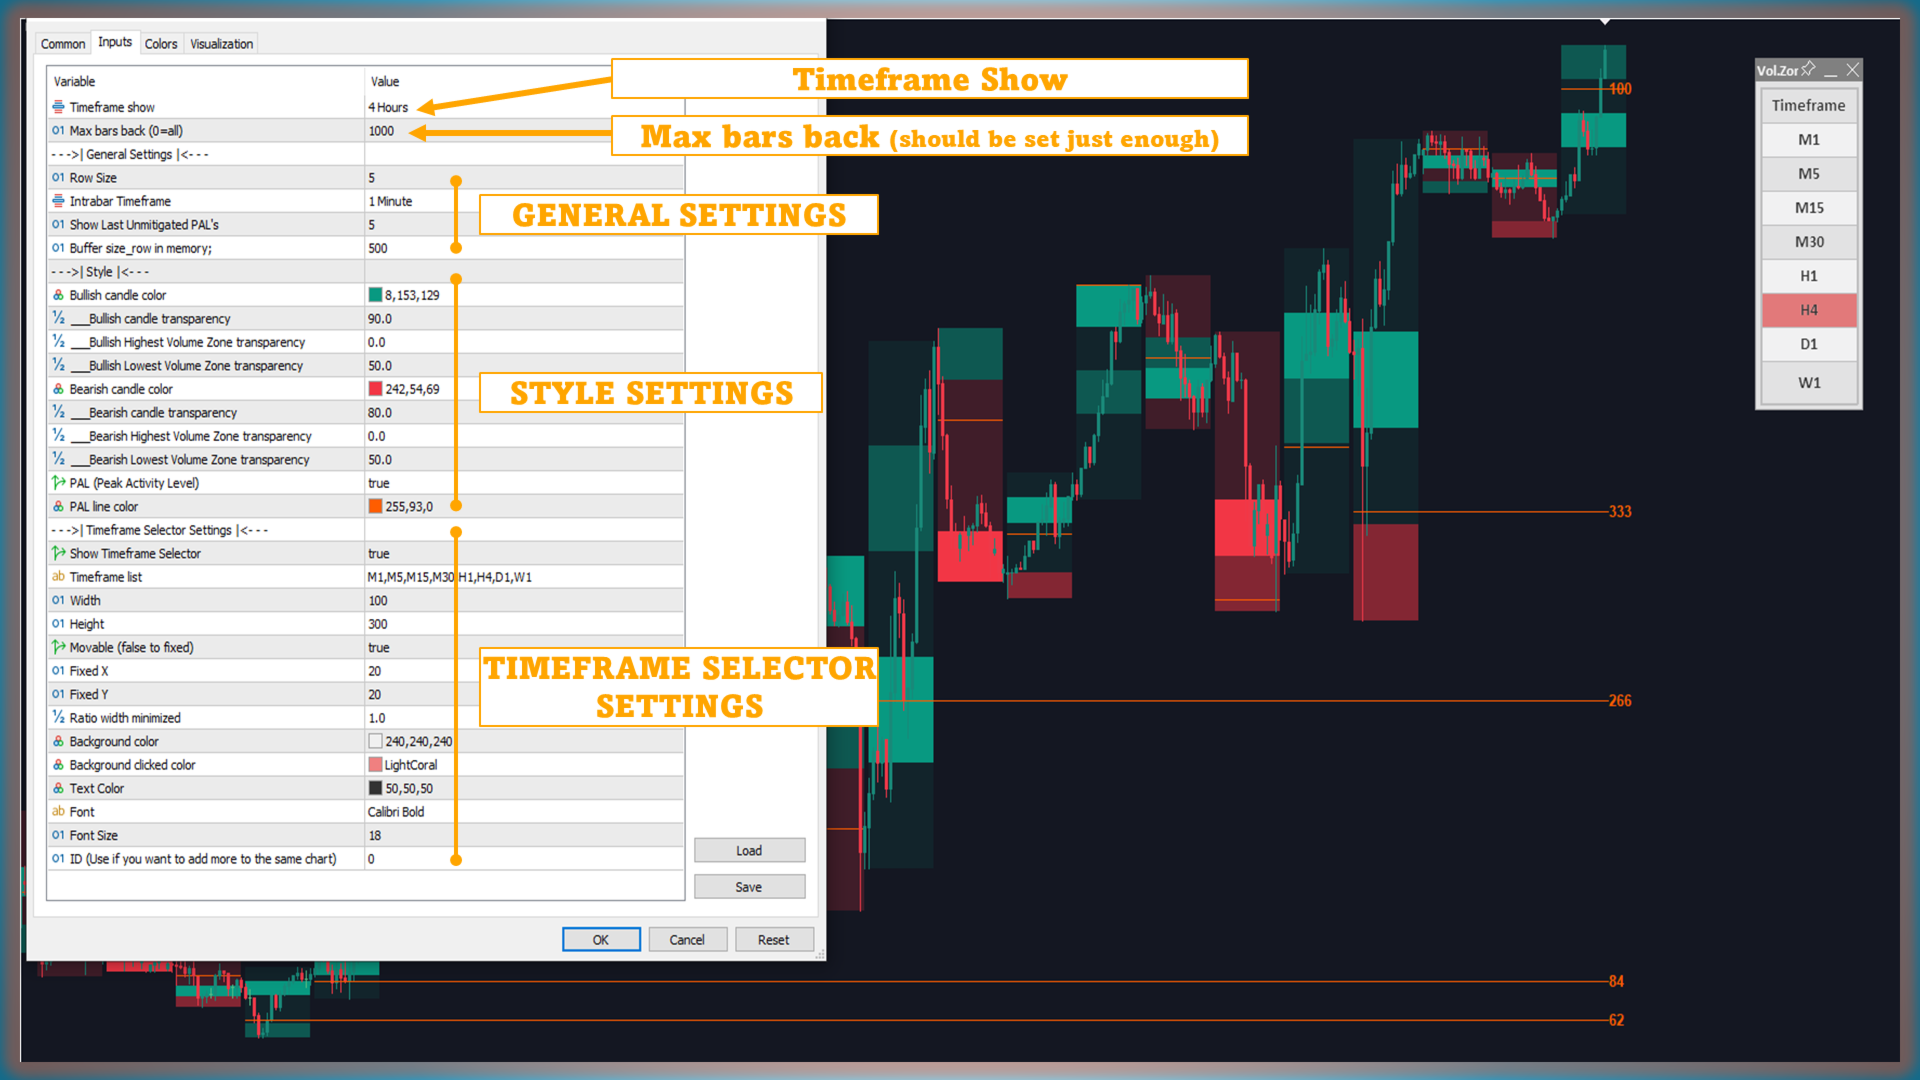
- 您可以通过 "Timeframe Show" 参数指定显示交易量区域的周期,或使用 Timeframe Selector,然后根据不同时期的需要灵活隐藏/显示不同周期的交易量区域。
-
解读图表显示
- Box:显示高周期蜡烛的整体范围(从高点到低点)。
- Lowest Volume Zone: 突出显示蜡烛时段内较低的交易量区域。
- Highest Volume Zone: 标示交易量最高的区域,这是观察主要活动的重要参考。
- Line/dot: 代表包含最高交易量的低周期蜡烛收盘价(即 PAL)。
-
关注并响应 PAL
- PAL 线会延伸到未来的价格走势中,通常会作为动态支撑或阻力水平。
- 一旦某个 PAL 被“穿越”或“解决”,该线会自动消失,从而保持图表整洁。
-
带有 “Row Size” 的 Volume Profile
- 聚合的低周期交易量用于构建交易量分布图。“Row Size” 越大,交易量分布越细致。
-
自动识别高低交易量区域
- 在构建交易量分布图后,该指标会自动突出显示最高交易量区(实心)和较低交易量区(半透明)。
-
可扩展及可自定义
- Show Last Unmitigated PALs: 设置您希望看到多少尚未被穿越的 PAL。
- Style & Colors: 调整区域显示、线条外观以及颜色方案,以满足您的个人偏好。
-
Row Size
- 定义用于从低周期数据构建交易量分布图的行数。
-
Intrabar Timeframe
- 选择指标应参考哪个低周期(例如 M1、M5、M15)。
-
Show Last Unmitigated PALs
- 选择在图表上保留多少条尚未被穿越的 PAL 线。
-
Style
- 启用/禁用各种指标功能,并根据需要个性化颜色和透明度。
- Multi-Timeframe
- 指定要显示的高周期
- Timeframe Selector 设置
Conclusion
使用 Volume Zones Internal Visualizer Multi-Timeframe,您可以从全新角度洞察市场交易量,并以极高的精度识别关键区域。将低周期交易量整合到高周期时段的功能不仅节省时间,还能提升交易决策的准确度。