Volume Zones Internal Visualizer MT5 Multi TF

특별 할인: ALL TOOLS , 각각 $35에 제공합니다!

New tools will be $30 for the first week or the first 3 purchases

Trading Tools Channel on MQL5: Join my MQL5 channel to update the latest news from me

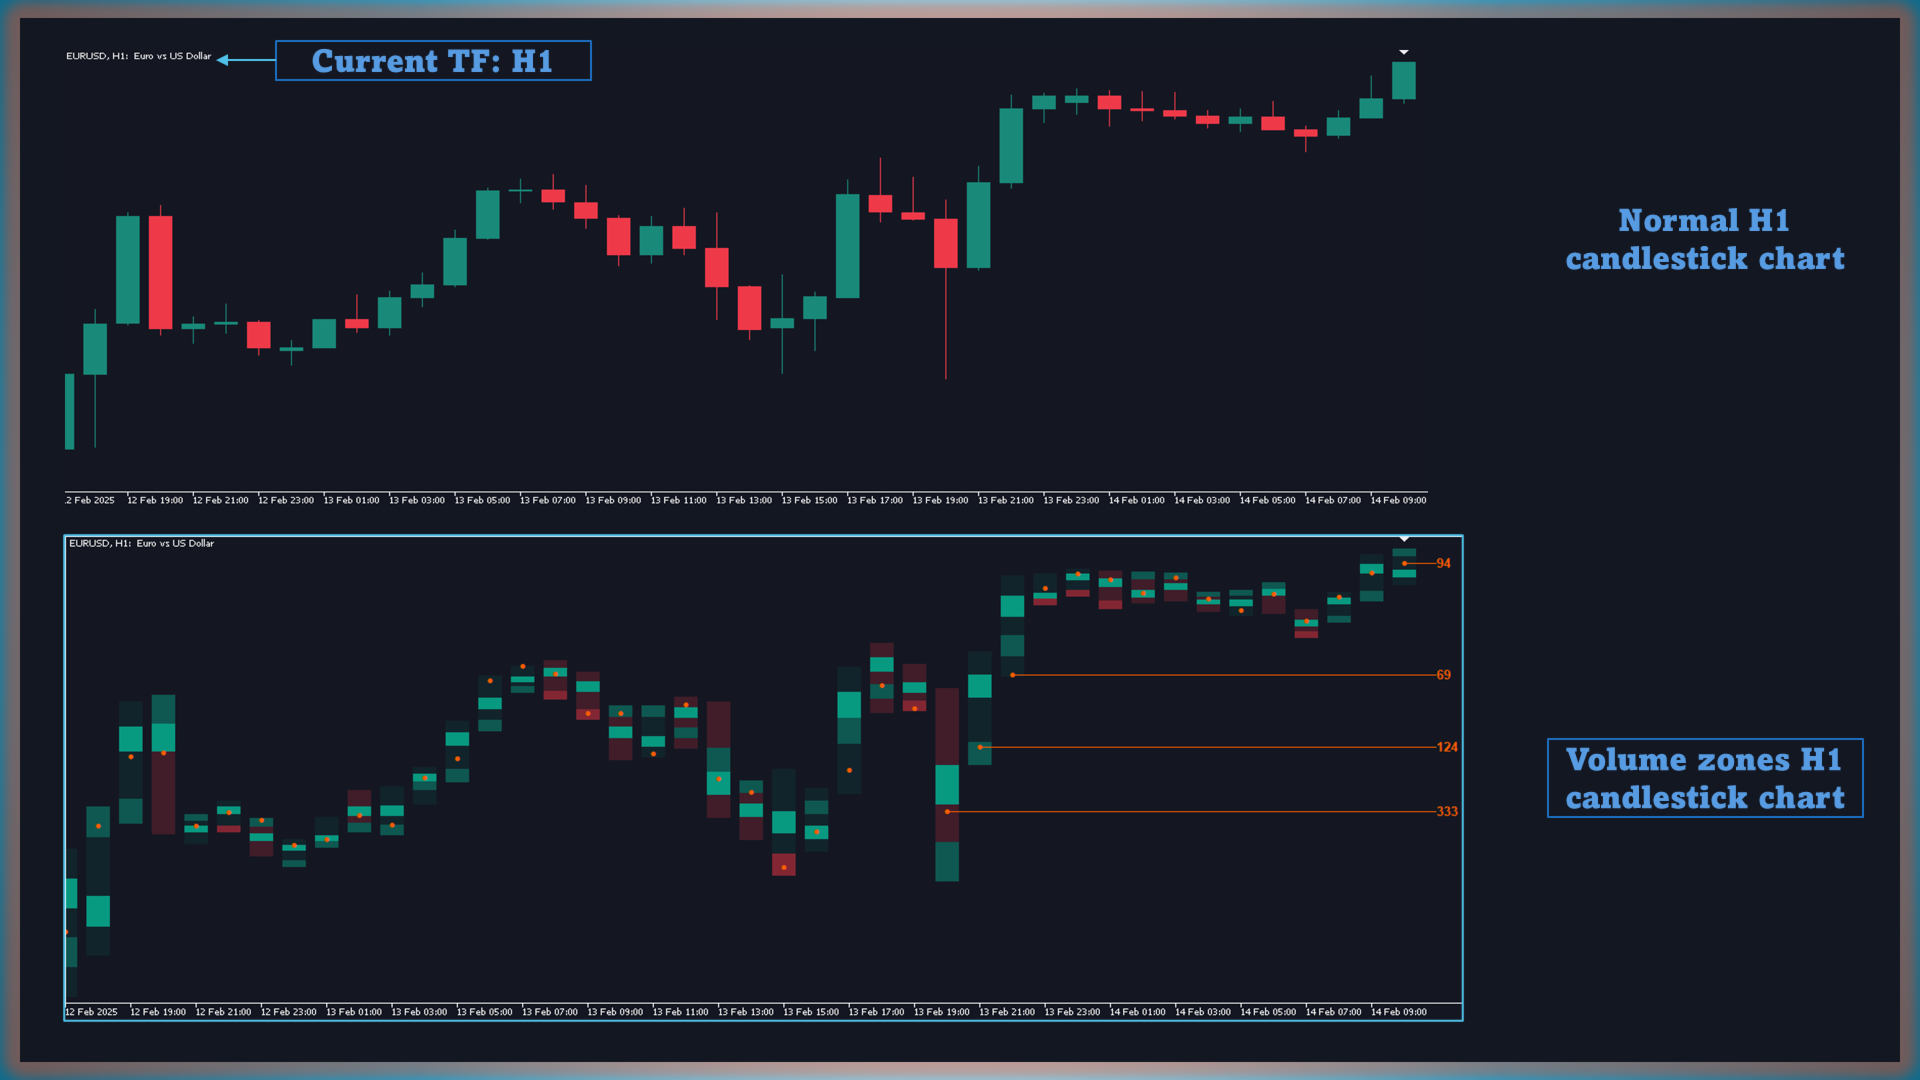
Volume Zones Internal Visualizer Multi-Timeframe 는 상위 차트에서 거래하면서도 하위 차트의 상세한 거래량 활동을 파악할 수 있도록 도와주는 최고의 솔루션입니다. 다중 시간대(Multi-Timeframe)를 지원하는 강력하고 직관적인 거래량 분석 도구를 찾고 계시다면, 바로 이 제품이 적합합니다!

MT4 버전 더 보기:  Volume Zones Internal Visualizer MT4 Multi TF

다른 제품 더 보기:  All Products

Why Choose Volume Zones Internal Visualizer Multi-Timeframe?
  1. 상위 차트에서 하위 차트 거래량 확인

    • 이 인디케이터는 “alternate candle” 스타일을 제공하여, 상위 차트를 벗어나지 않고도 하위 차트에서 거래량이 집중되는 지점을 빠르게 파악할 수 있습니다.
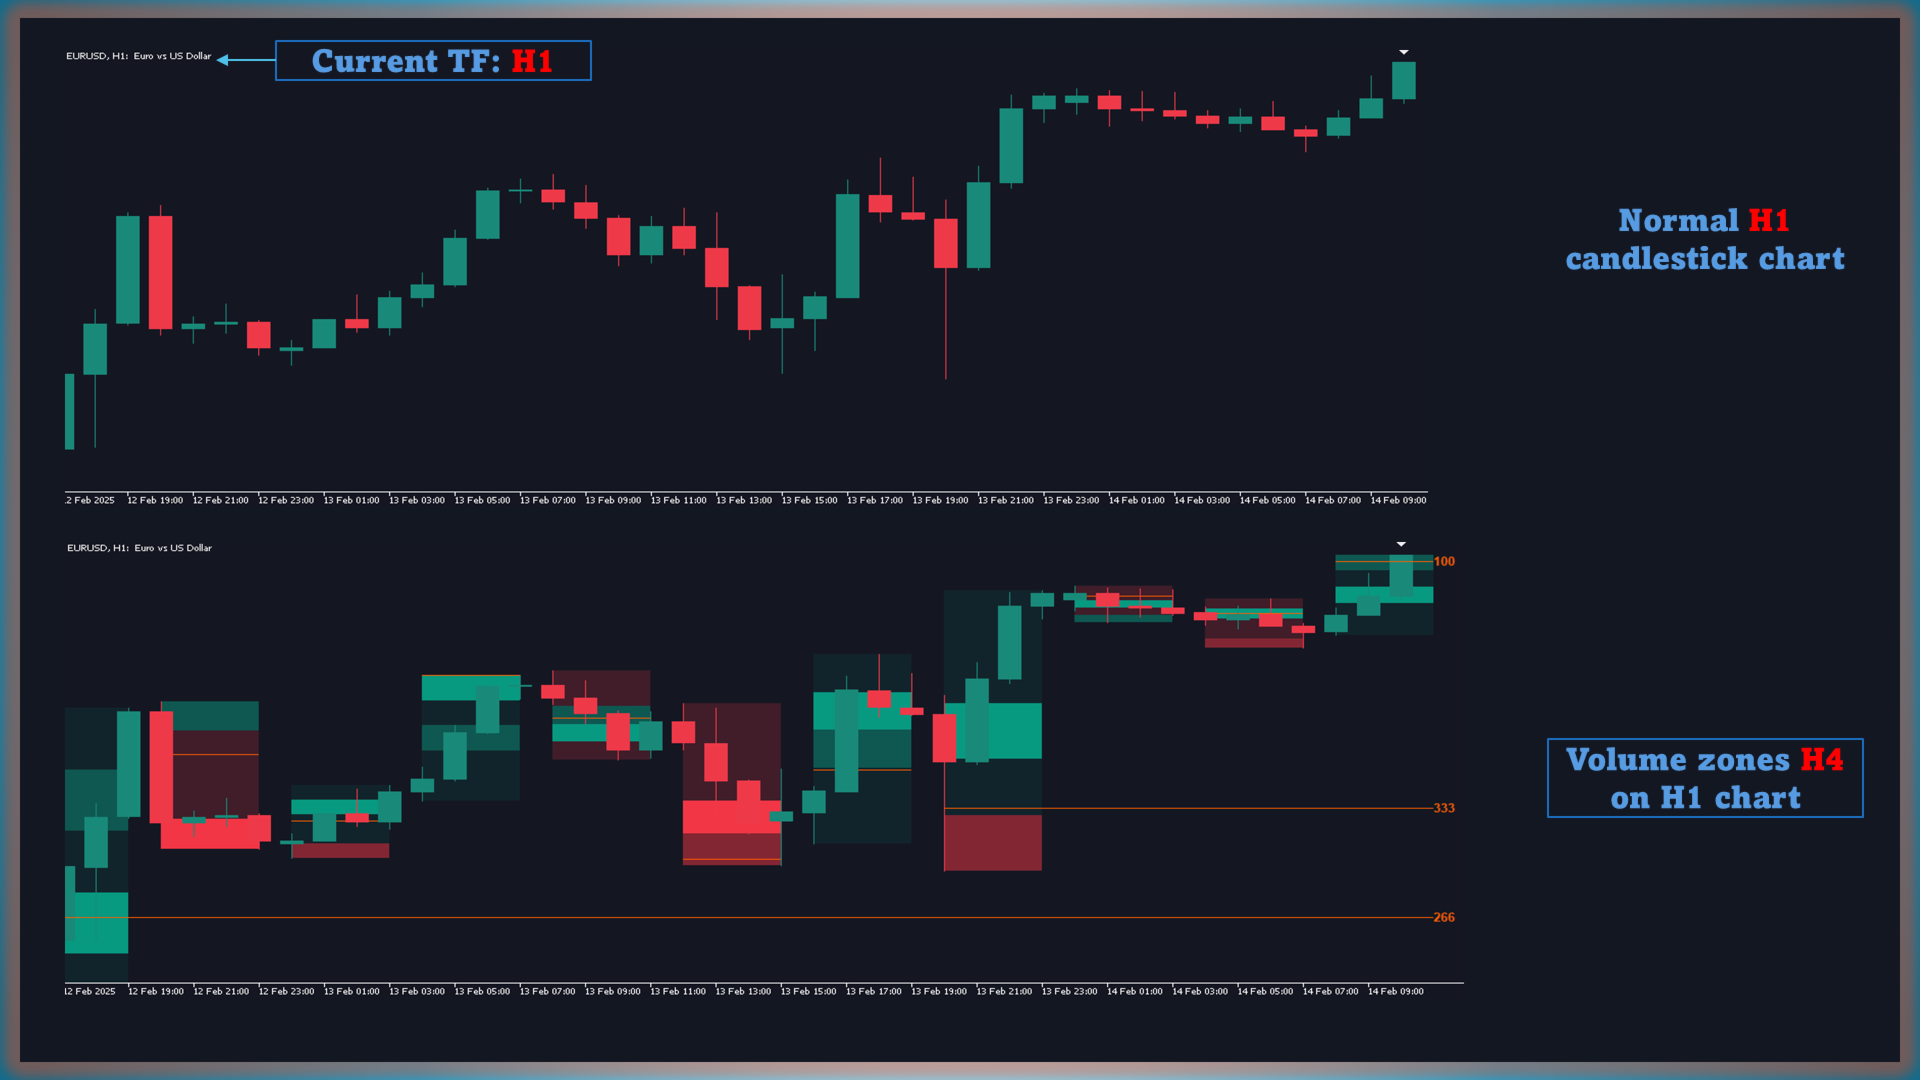
  2. 다중 시간대(Multi-Timeframe) 분석

    • Intrabar Timeframe 기능을 통해 어떤 하위 시간대(M1, M5, M15 등)를 모니터링할지 선택할 수 있습니다. 하위 차트의 모든 거래량 데이터는 종합되어 각 상위 차트 캔들 구간 내에 표시되므로 종합적인 분석이 가능합니다.
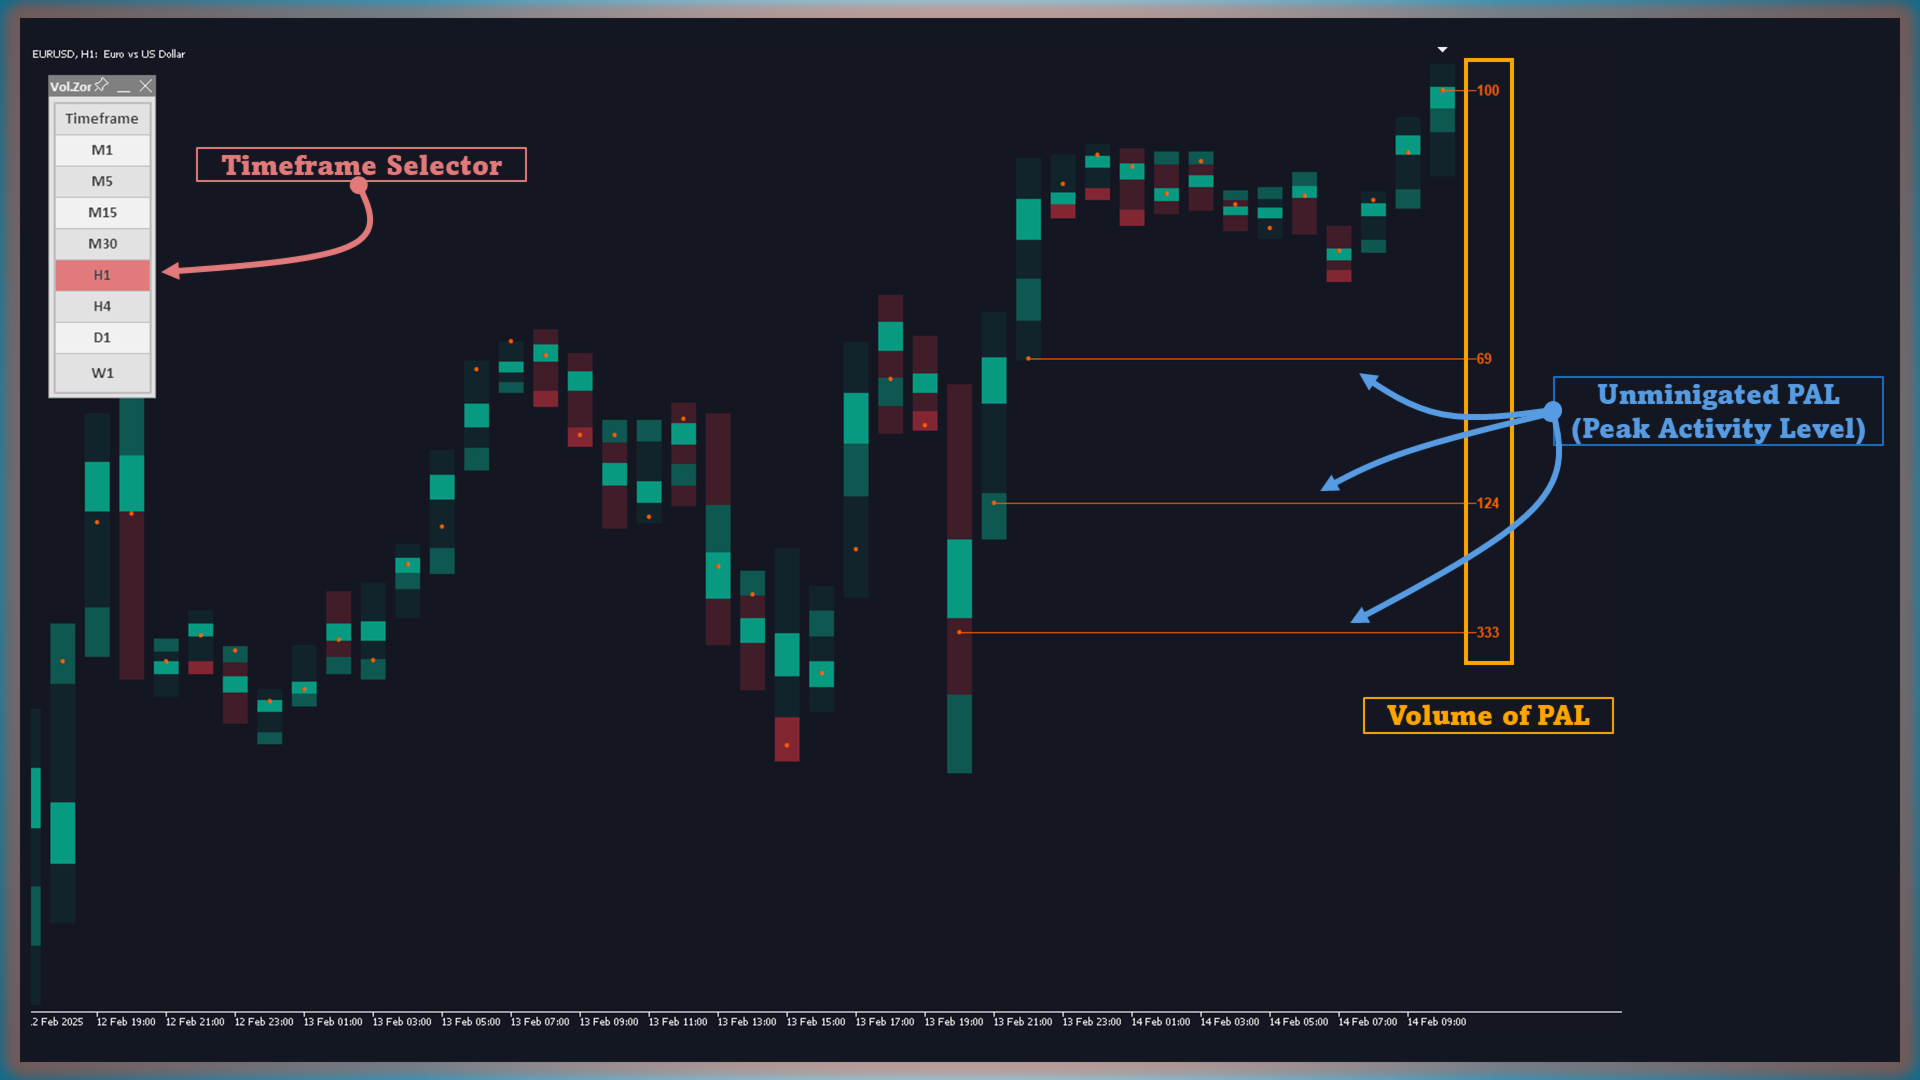
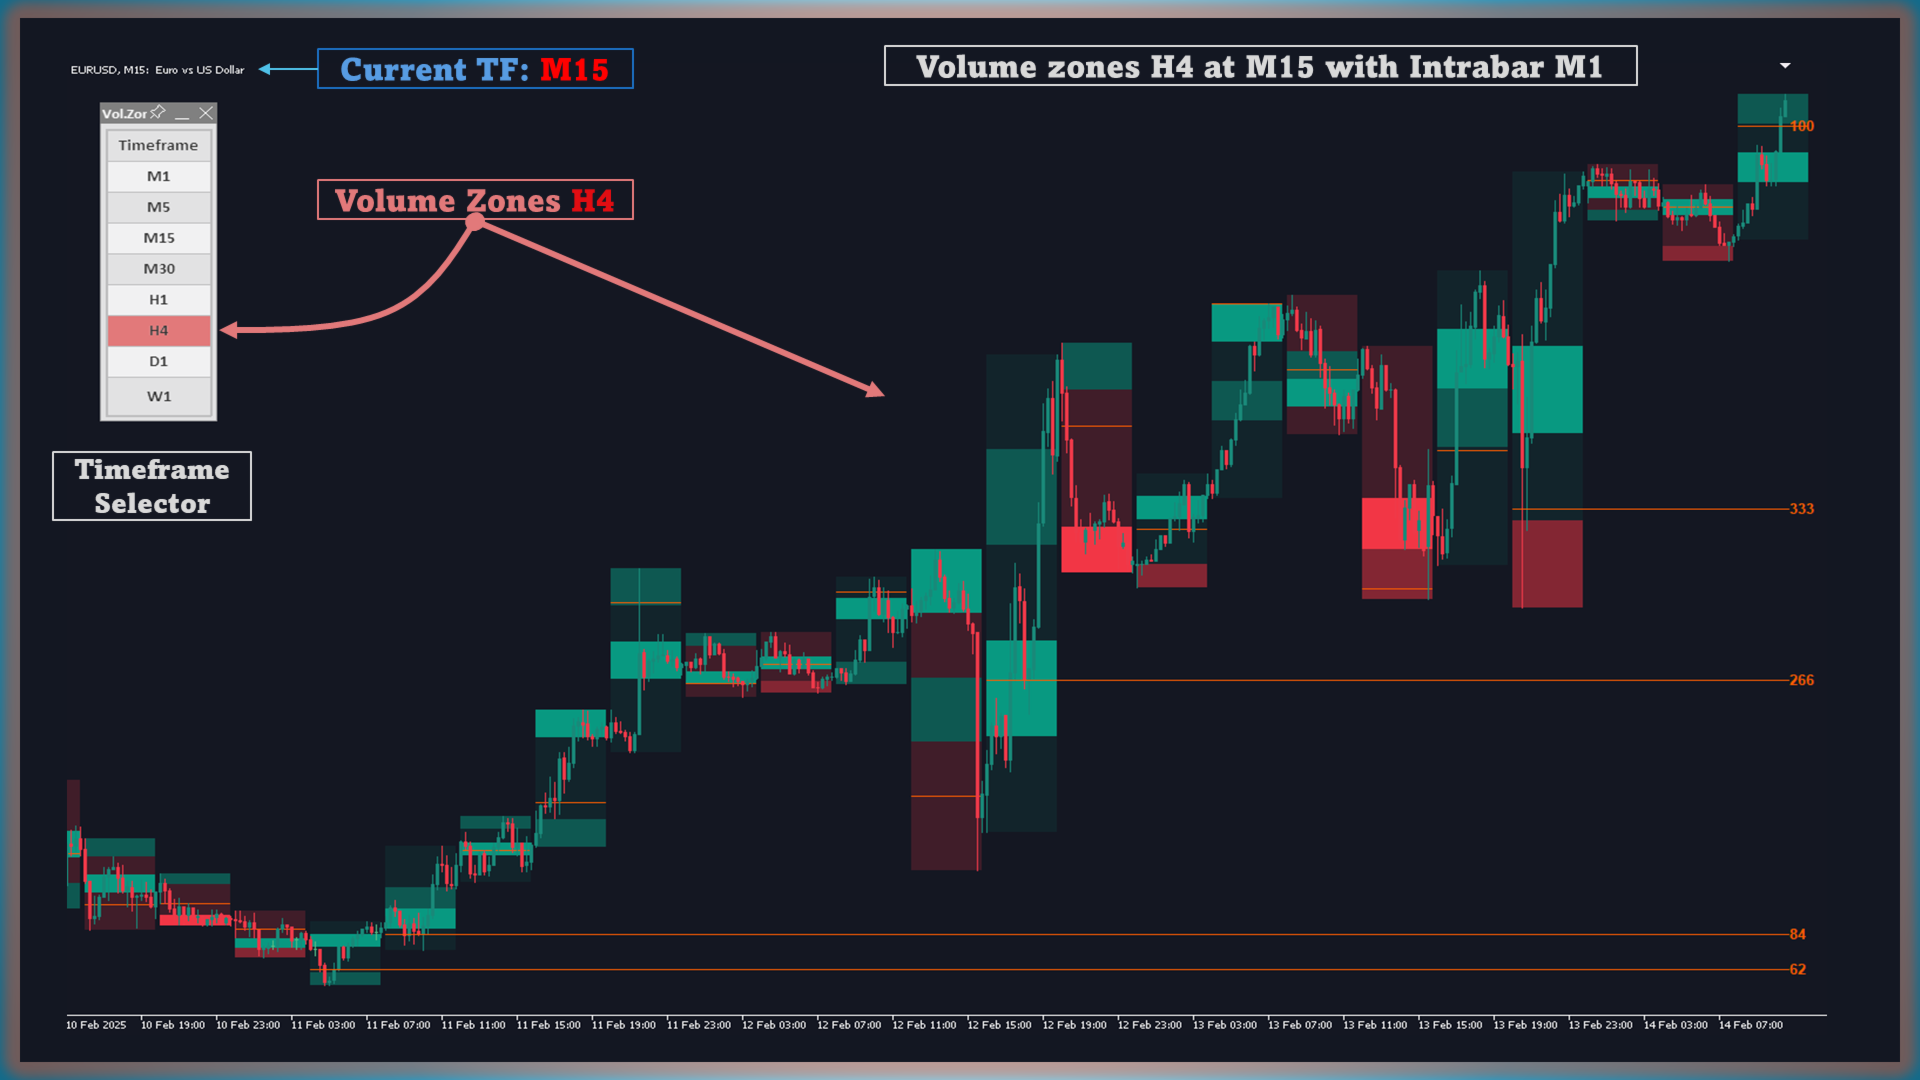
    • Timeframe Selector 기능으로, 원하는 상위 시간대의 거래량 존을 어떤 차트에서든 쉽게 표시할 수 있습니다. 예: M15 차트에서 Intrabar M1을 사용하여 H4 거래량 존을 표시 (자세한 내용은 스크린샷 참조)
  3. “Peak Activity Level” (PAL) 찾기

    • 이 인디케이터는 자동으로 가장 거래량이 큰 하위 차트 캔들을 식별합니다. 해당 캔들의 종가는 PAL로 표시되며, 상위 차트 캔들 세션 동안 가장 많은 거래량이 축적된 중요한 레벨이 됩니다.
    • 각 PAL은 “돌파”되거나 “해소”될 때까지 미래 시세에서도 연장 표시되어, 매매 진입 또는 청산 기회를 시사합니다.
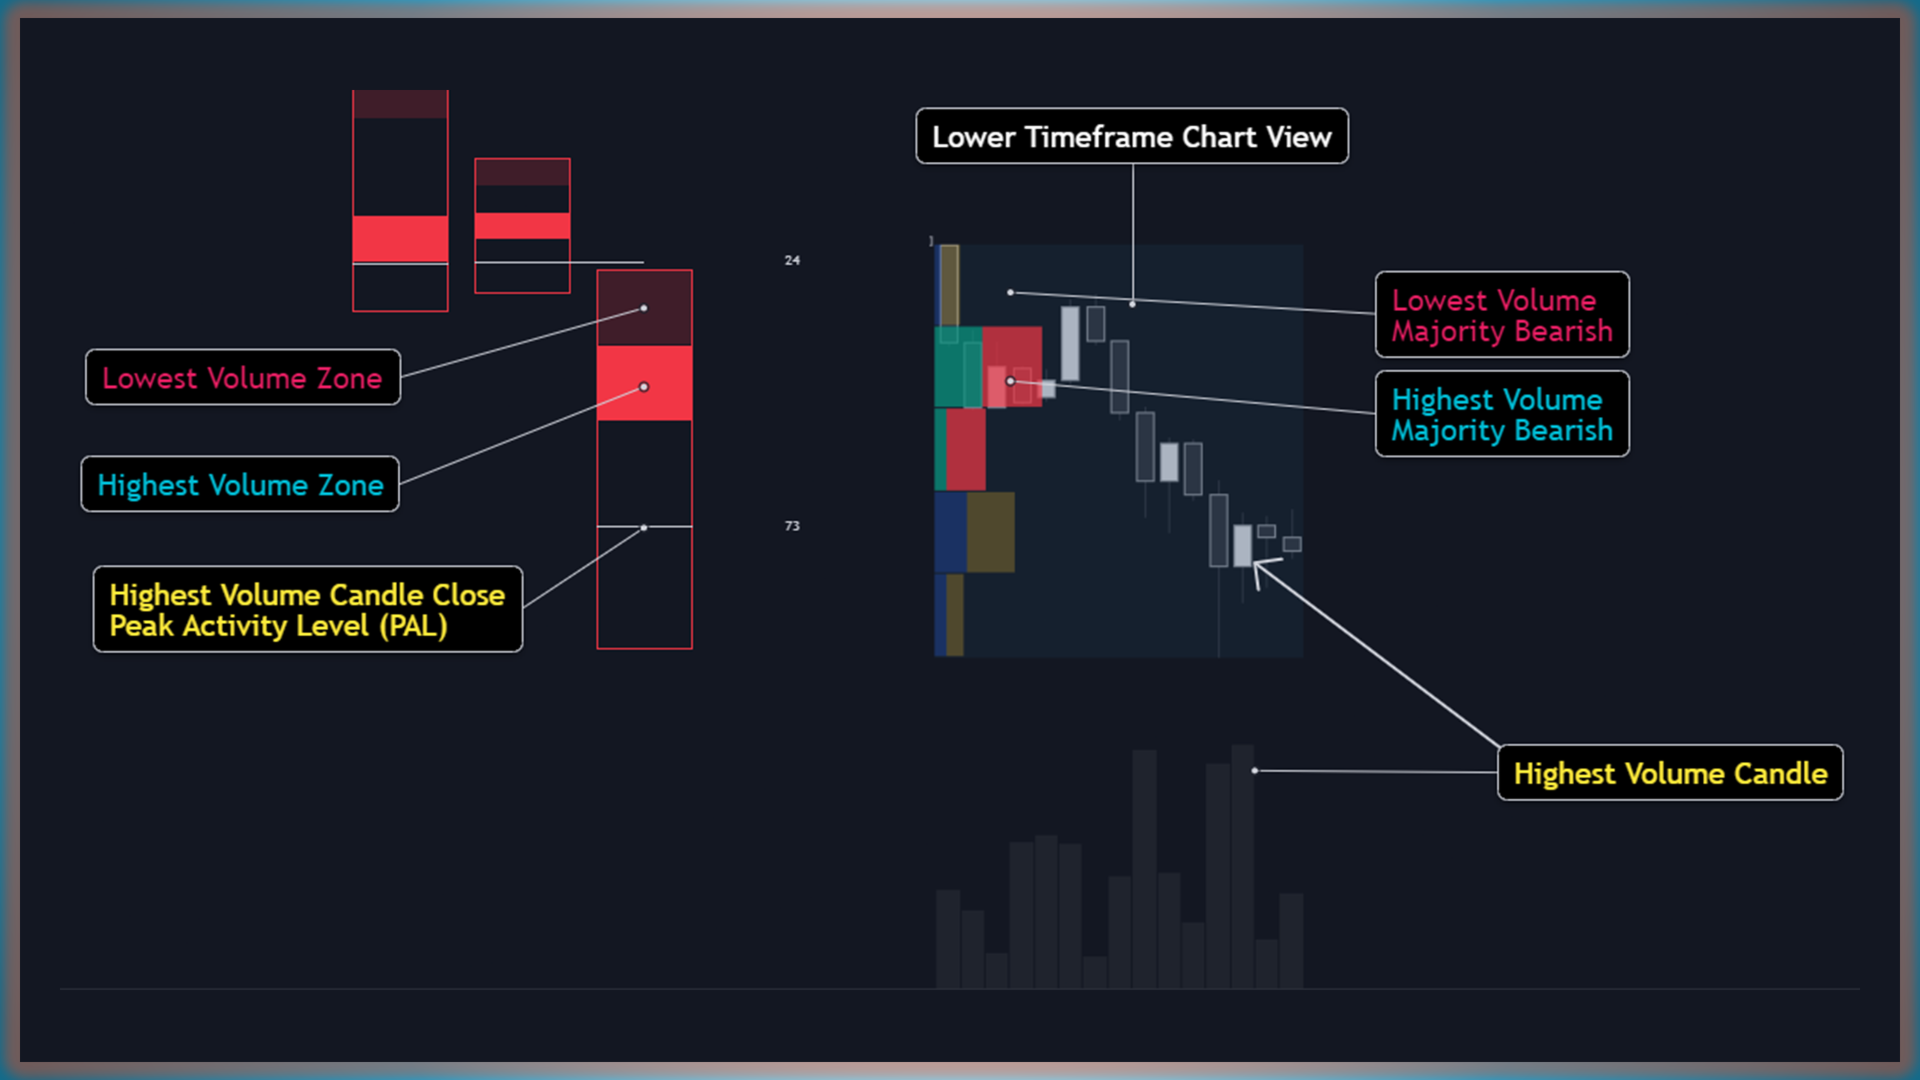
  4. 최고 & 최저 거래량 존 식별

    • 하위 차트 데이터를 바탕으로 Volume Profile을 구성하여, 인디케이터가 두 가지 중요한 영역을 찾아냅니다:
      • Highest Volume Zone: 거래량이 가장 많이 집중된 영역.
      • Lowest Volume Zone: 상대적으로 낮지만 여전히 의미 있는 거래량이 집중된 영역.
How to Use
  1. Intrabar Timeframe 설정

    • 매매 스타일에 따라 모니터링할 하위 차트(M1, M5, M15 등)를 선택하세요.
  2. 다중 시간대 설정

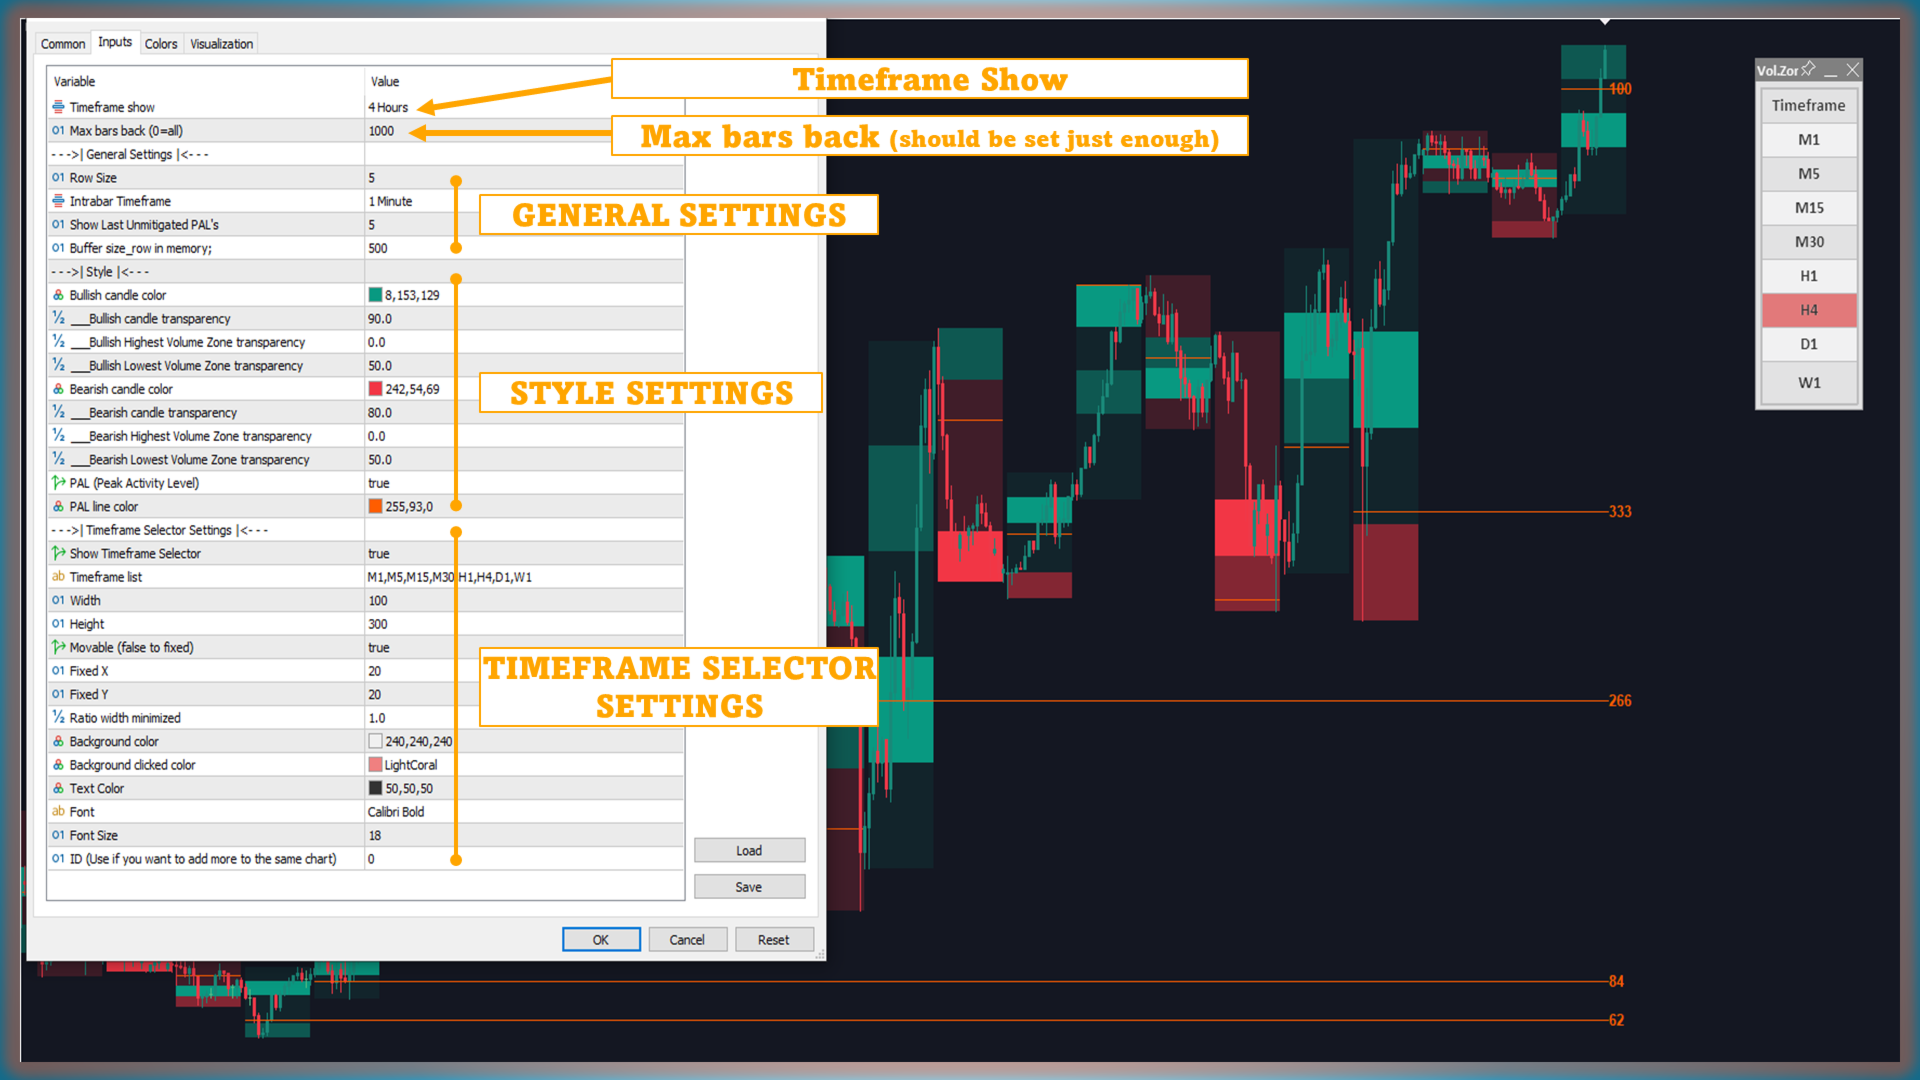
    • "Timeframe Show" 파라미터를 통해 어떤 시간대의 거래량 존을 표시할지 지정하거나, Timeframe Selector를 사용하여 필요에 따라 다양한 시간대에서 거래량 존을 유연하게 숨기거나 표시할 수 있습니다.
  3. 화면 표시 해석

    • Box: 상위 차트 캔들의 전체 범위(고가~저가)를 표시합니다.
    • Lowest Volume Zone: 캔들 세션 중 거래량이 가장 낮은 구간을 강조합니다.
    • Highest Volume Zone: 가장 거래량이 높은 구간으로, 주요 거래 활동을 파악하는 데 중요합니다.
    • Line/dot: 최대 거래량을 포함했던 하위 차트 캔들의 종가(PAL)를 나타냅니다.
  4. PAL 모니터링 및 대응

    • PAL 라인은 향후 가격 움직임에도 연장 표시되며, 동적으로 지지선 또는 저항선 역할을 하는 경우가 많습니다.
    • PAL이 “돌파”되거나 “해소”되면, 해당 라인은 자동으로 사라져 차트를 깔끔하게 유지합니다.
Technical Details
  • “Row Size”를 이용한 Volume Profile

    • 하위 차트의 거래량을 합산하여 볼륨 프로파일을 생성합니다. “Row Size” 값을 높이면, 거래량 분포가 더욱 세분화되어 표시됩니다.
  • 자동으로 최고 & 최저 거래량 존 식별

    • 볼륨 프로파일이 생성된 후, 인디케이터는 가장 높은 거래량 존(불투명)과 더 낮은 거래량 존(반투명)을 자동으로 강조합니다.
  • 확장 가능 & 커스터마이즈 가능

    • Show Last Unmitigated PALs: 아직 돌파되지 않은 PAL을 몇 개나 볼지 설정할 수 있습니다.
    • Style & Colors: 구역 표시, 선 스타일, 색상 테마 등을 취향에 맞게 조절할 수 있습니다.
Settings
  1. Row Size

    • 하위 차트 데이터를 기반으로 볼륨 프로파일을 만들 때 사용할 행(row)의 수를 정의합니다.
  2. Intrabar Timeframe

    • 인디케이터가 참조할 하위 시간대(M1, M5, M15 등)를 선택하세요.
  3. Show Last Unmitigated PALs

    • 차트 상에 유지할, 아직 돌파되지 않은 PAL 라인의 수를 선택하세요.
  4. Style

    • 인디케이터 기능을 활성/비활성화하고, 색상 및 투명도 등을 사용자 설정할 수 있습니다.
  5. Multi-Timeframe
    • 표시할 상위 시간대를 지정합니다.
    • Timeframe Selector 설정

Conclusion

Volume Zones Internal Visualizer Multi-Timeframe를 통해 시장 거래량에 대한 새로운 시각을 얻을 수 있으며, 중요한 존을 정확하게 파악할 수 있습니다. 상위 차트 세션에 하위 차트 거래량 데이터를 결합할 수 있어, 시간을 절약하고 트레이딩 결정의 정확성을 높이는 데 도움이 됩니다.

추천 제품
Multi-timeframe trend indicator based on the ADX / ADXWilder indicator with Fibonacci levels The indicator shows trend areas using ADX or ADXWilder indicator data from multiple timeframes. The impulse mode of the indicator allows you to catch the beginning of a trend, and several "Screens" with different timeframes allow you to filter out market noise. Fibonacci levels are added to the price chart, which have flexible settings. How the indicator works: if PDI is greater than NDI, then   it`s
FREE
Raymond Cloudy Day
The Hung Ngo
5 (3)
Raymond Cloudy Day Indicator for MT5 – Pivot-Based Reversal and Trend Levels Raymond Cloudy Day Indicator is a pivot-based level indicator for MetaTrader 5 (MT5). It was developed by Ngo The Hung based on Raymond’s original idea and is designed to give a structured view of potential reversal zones, trend extensions and support/resistance levels directly on the chart. The default settings are optimised for XAUUSD on the H1 timeframe, but the indicator can be tested and adjusted for other symbols
FREE
Phoenix Momentum 5 Star
Nigel Nii Darku Narnor Darko
This indicator, "Phoenix Volume Amazing", is a sophisticated Volume Delta and Order Flow Dashboard. Unlike standard volume indicators that only show total activity, this tool dissects the internal "tug-of-war" between buyers and sellers in real-time. Core Functionality The indicator calculates Delta (the difference between buying volume and selling volume) to provide a "under the hood" look at market sentiment. It uses a custom-built GUI (Graphical User Interface) panel to display these metrics
FREE
Swiss VWAPsimple
Terence Gronowski
4.8 (5)
Swiss VWAPsimple Motivation Did not find free VWAP that works, the one that I found craseh. So I created a VWAP which calculates values only for the actual day. So computer resouces are not over stressed. What is VWAP, how is it used?  VWAP stands for Volume Weighed Average Price, it calculates the running sum of tick volume and the runnung sum of price times tickvolume. The division of these sums result in a weighed price (Sum P*V/Sum V). The calculation starts normally at midnight. The values
FREE
Indicator Description 4 Hull MA Color + Envelopes is a powerful trend-following indicator for MetaTrader 5 that combines four Hull Moving Averages (HMA) with Moving Average Envelopes to clearly identify market direction, trend strength, and potential reversal or pullback zones. This indicator is designed to reduce noise, react quickly to price movement, and provide a clean visual structure for professional trading.   Key Features   4 Hull Moving Averages (20, 50, 100, 200) Automatic color change
FREE
Important Lines
Terence Gronowski
4.88 (24)
This indicator displays Pivot-Lines, preday high and low, preday close and the minimum and maximum of the previous hour. You just have to put this single indicator to the chart to have all these important lines, no need to setup many single indicators. Why certain lines are important Preday high and low : These are watched by traders who trade in a daily chart. Very often, if price climbs over or falls under a preday low/high there is an acceleration in buying/selling. It is a breakout out of a
FREE
ThreePointsChannelFree
Dimitr Trifonov
5 (1)
This is a free version of the indicator, the period between the vertical lines is always 30 bars. In the paid version the period can be set by user, so a configuration with many ThreePointsChannel indicators with different periods is possible. The principle of construction - on top of any number of bars set by the user, a channel is constructed with maximum and minimum lines so that the bars touch the maximum and minimum of the channel at exactly three points. The name of the indicator follows
FREE
Qunity ADX Trend
Rodion Kachkin
Trend indicator based on the ADX / ADXWilder indicator The indicator shows trend areas using ADX or ADXWilder indicator data. How the indicator works: if PDI is greater than NDI, then it`s bullish movement; if PDI is less than NDI, then it`s bearish movement; if ADX is less than or equal to the filter value specified in the parameters, then there is no movement state. Input parameters of the indicator: Calculate Timeframe - timeframe for calculation; ADX Type - type of ADX calculation based
FREE
The indicator identifies when a divergence occurs between price and an indicator or oscillator. It identifies both regular and hidden divergences. Combined with your own rules and techniques, this indicator will allow you to create (or enhance) your own powerful system. For higher probability setups I can recommend you to use my Supply Demand indicator and trade only if the divergence occurs inside a zone. Supply zone for bearish div and demand zone for bullish div. The optimal scenario is if it
FREE
Follow The Line MT5
Oliver Gideon Amofa Appiah
4.6 (35)
This indicator obeys the popular maxim that: "THE TREND IS YOUR FRIEND" It paints a GREEN line for BUY and also paints a RED line for SELL. (you can change the colors). It gives alarms and alerts of all kinds. IT DOES NOT REPAINT and can be used for all currency pairs and timeframes. Yes, as easy and simple as that. Even a newbie can use it to make great and reliable trades. NB: For best results, get my other premium indicators for more powerful and reliable signals. Get them here: https://www.m
FREE
Support Resistance Channels - Trading Guide *** Group support:  https://www.mql5.com/en/channels/vuongphamtrading Overview The Support Resistance Channels indicator automatically identifies and displays the strongest support and resistance zones based on pivot points. Unlike simple horizontal lines, this indicator creates channels (zones) which better represent real market behavior where support and resistance act as areas rather than precise levels. Key Features Automatic Detection : Identifie
FREE
Automatic Trendlines
Pasi Hakamaki
4.69 (49)
The indicator draws trendlines on chart. This indicator has six inputs. User can specify alternative labels for both lines. If multiple instances of the indicator are used, the labels must differ. User can set width and color of the lines and depth which specifies what significant peaks should be used. For example, Depth=10 sets trendlines using the current peaks and valleys that have at least 10 bars to the right and to the left and that have highs/lows less/greater than the peak's high/low. In
FREE
Donchian Channel DC
Renato Takahashi
Donchian Channel DC is the indicator of Donchian Channels, that plots maximum and minimum values of a specific period, besides mean value line. It´s possible to configure simple period for analysis and the indicator will plot all three values. You can trade with this indicator as trend or reversal, according to each strategy. Do not let to test others indicators as soon as others expert advisors.
VWAP Daily Clean
Bambang Nugroho
English VWAP Daily (Clean) is a simple and lightweight indicator that plots the classic Daily VWAP (Volume Weighted Average Price) directly on your MT5 chart. Features: Classic Daily VWAP calculation Supports real volume (if available) or tick volume Timezone offset option to match your broker’s server time Weekend merge option (merge Saturday/Sunday data into Friday) Clean version → no arrows, no alerts, only VWAP line VWAP is widely used by institutional traders to identify fair value, su
FREE
Multi-timeframe trend indicator, based on the ADX / ADXWilder indicator The indicator shows trend areas using ADX or ADXWilder indicator data from multiple timeframes. The impulse mode of the indicator allows you to catch the beginning of a trend, and several "Screens" with different timeframes allow you to filter out market noise. How the indicator works: if PDI is greater than NDI, then it`s bullish movement; if PDI is less than NDI, then it`s bearish movement; to determine any trend, it is
FREE
Support and Ressistance
Raphael Lorenz Baumgartner
Last Day Support & Resistance Platform: MetaTrader 5 Type: Custom Indicator Display: Chart Window (Overlay) Functions: Calculates Support and Resistance zones based on high/low patterns of the previous day. Uses a sliding sampling window ( SampleWindowSize ) to detect recent price ranges. Detects potential support if current price range is significantly below previous highs. Detects potential resistance if price range is significantly above previous lows. Updates four output buffers: LDResistanc
FREE
Super Trend Strategy
Minh Khoa Nguyen
5 (3)
The SuperTrend Strategy is a widely-used technical indicator based on the Average True Range (ATR), primarily employed as a trailing stop tool to identify prevailing market trends. The indicator is designed for ease of use while providing reliable insights into the current market trend. It operates based on two key parameters: the period and the multiplier . By default, it uses a period of 15  for the ATR calculation and a multiplier of 3 . The Average True Range (ATR) plays a crucial role in th
FREE
Harmonic Pattern Suite Pro
Patricia Manzano Gomez
Harmonic Pattern Suite Pro Introduction Harmonic Pattern Suite Pro is an indicator designed to identify and display harmonic structures on the chart based on X-A-B-C-D sequences. Its purpose is to present pattern formations that meet geometric and proportional criteria, providing a clear visual representation directly on the chart. The indicator automates the detection process, removing the need for manual measurement of ratios and allowing the user to review the structural configuration withou
FREE
Pivot MT5
Dmitrij Isaenko
The indicator draws daily support and resistance lines on the chart, as well as the Pivot level (reversal level). Adapted to work in MT5 The standard timeframe for calculating support and resistance levels is D1. You can choose other timeframes according to your strategy (for example, for M1-M15, the optimal timeframe for calculations is H1) The function for calculating support and resistance levels has been updated; in this calculation option, fibonacci levels are taken into account, respec
FREE
Magic 7 Indicator
Marek Pawel Szczesny
5 (1)
Overview Magic 7 Indicator is a comprehensive MetaTrader 5 (MQL5) indicator that identifies seven different trading scenarios based on candlestick patterns and technical analysis. The indicator combines traditional price action patterns with modern concepts like Fair Value Gaps (FVG) to provide trading signals with precise entry points and stop loss levels. Features 7 Trading Scenarios : Each scenario identifies specific market conditions and trading opportunities Visual Signals : Clear buy/sell
FREE
Bollinger Bands B
Flavio Javier Jarabeck
4.25 (4)
John Bollinger created this indicator in 2010 as a way to read the original indicator (Bollinger Bands) in a more "technical" way, shown as an oscillator. The typical range of the Bollinger Bands %B is 0 - 0.5 - 1.0, where "0" represents the lower band, the "0.5" the middle band, and "1" the upper band. The line on the indicator represents the Closing prices. As simple as that. SETTINGS Bollinger Bands period of analysis Standard Deviation multiplier Shift Price type to be analyzed If you like
FREE
Mitimom
Danil Poletavkin
The indicator is based on Robert Miner's methodology described in his book "High probability trading strategies" and displays signals along with momentum of 2 timeframes. A Stochastic oscillator is used as a momentum indicator. The settings speak for themselves period_1 is the current timeframe, 'current' period_2 is indicated - the senior timeframe is 4 or 5 times larger than the current one. For example, if the current one is 5 minutes, then the older one will be 20 minutes The rest of the s
FREE
HMA Color with Alerts MT5
Pavel Zamoshnikov
4.75 (57)
Hull Moving Average (HMA) is well-deservedly popular among traders because of the effective averaging of market noise and a relatively small delay. The current MetaTrader 5 version changes its color when the movement direction changes. Sound and text signals are available. It also supports sending email and push messages. It is possible to trigger a signal on the current incomplete bar, although such a signal may be canceled before completion if conditions are no longer appropriate. One of the p
FREE
Free automatic Fibonacci is an indicator that automatically plots a Fibonacci retracement based on the number of bars you select on the BarsToScan setting in the indicator. The Fibonacci is automatically updated in real time as new highest and lowest values appears amongst the selected bars. You can select which level values to be displayed in the indicator settings. You can also select the color of the levels thus enabling the trader to be able to attach the indicator several times with differe
FREE
Dynamic Zones
Kee Huang Tan
Dynamic Supply and Demand indicator automatically identifies and displays Supply and Demand Zones on your chart based on price action patterns and market structure.  These zones represent areas where institutional buying or selling pressure has historically occurred, making them key levels for potential price reactions. This form of indicator takes inspiration from ICT as well as traditional Support & Resistance formation. **For the first 50 candles (number depends on LookBackCandles) when indic
FREE
This is a regression tree indicator for MT4/MT5. This indicator classificate nodes on the time period so that the deviation becomes smaller, and displays regression line and channel for each node. It's free! Attached CartDemo.ex4 and CartDemo.ex5 is a Demo version and has the following limitations: Can't use HighSpeed method (default method is RandomForest) Maximum number of bars is 260 (increase from 200) There is no expiration date and can be started many times, but it stops after an hour.
FREE
Rainbow MT5
Jamal El Alama
4 (1)
Description : Rainbow MT5 is a technical indicator based on Moving Average with period 34 and very easy to use. When price crosses above MA and MA changes color to green, then this is a signal to buy. When price crosses below MA and MA changes color to red, then this is a signal to sell. The Expert advisor ( Rainbow EA MT5 ) based on Rainbow MT5 indicator is now available here . MT4 version is available here .
FREE
RSI Divergence L
Vasin Chatkittisuk
RSI Divergence Lite (Free) - MT5 Indicator ------------------------------------------------- This is the Lite (free) version of RSI Divergence. - Detects basic Bullish and Bearish divergence between price and RSI - Works only on M15 timeframe - No divergence lines, no alerts - Fixed internal settings (RSI 14, pivot sensitivity, thresholds) - For educational and testing purposes For the full PRO version (multi-timeframe, alerts, divergence lines, advanced UI), please upgrade to RSI Divergence
FREE
Smart SMC Matrix
Mykhailo Karpiuk
SMC Trend Matrix FREE (v3.15) — Professional Multi-Timeframe Analytical Hub SMC Trend Matrix FREE is a high-performance analytical tool based on Smart Money Concepts (SMC). It is designed to filter out market noise and identify high-probability institutional supply and demand zones across multiple timeframes simultaneously. Version 3.15 is a massive upgrade from v2.73, focusing on execution speed, UI/UX, and professional market structure analysis. The Core Algorithm The indicator utilizes
FREE
This indicator is a zero-lag indicator and displays  strength of trend change . True Trend  Oscillator Pro works best in combination with True Trend Moving Average Pro that displays exact trend as is. Oscillator value is exact price change in given direction of the trend. True Trend Moving Average Pro: https://www.mql5.com/en/market/product/103586 If you set PERIOD input parameter to 1 this indicator becomes a sharpshooter for binary options. Developers can use True Trend Oscillator in Exper
FREE
이 제품의 구매자들이 또한 구매함
SuperScalp Pro
Van Minh Nguyen
4.57 (21)
SuperScalp Pro – 고급 멀티 필터 스캘핑 지표 시스템 SuperScalp Pro는 클래식 Supertrend와 여러 지능형 확인 필터를 결합한 고급 스캘핑 지표로, 거래 기회를 식별하는 데 도움을 줍니다. M1부터 H4까지 다양한 시간대에서 효율적으로 작동하며, XAUUSD, BTCUSD 및 주요 Forex 통화쌍에 최적화되어 있습니다. 이 지표는 명확한 매수 및 매도 신호를 제공하며, ATR 기반으로 진입가, 손절가, 익절가를 자동 계산하여 보다 효과적인 리스크 관리를 지원합니다. Fibonacci Take Profit 기능은 중요한 가격 구간에서 더 빠르게 포지션을 청산할 수 있도록 하며, 해당 수준 도달 시 알림을 전송합니다. 기본 설정은 Fibonacci Take Profit이 활성화된 상태로 최적화되어 있으며, 보다 안정적이고 일관된 거래 경험에 중점을 둡니다. 차트에 적용하는 것만으로 즉시 사용할 수 있습니다. 고급 사용자를 위해 모든 파라미터는 자유롭게 사용
Divergence Bomber
Ihor Otkydach
4.9 (87)
이 지표를 구매하신 분께는 다음과 같은 혜택이 무료로 제공됩니다: 각 거래를 자동으로 관리하고, 손절/익절 수준을 설정하며, 전략 규칙에 따라 거래를 종료하는 전용 도우미 툴 "Bomber Utility" 다양한 자산에 맞게 지표를 설정할 수 있는 셋업 파일(Set Files) "최소 위험", "균형 잡힌 위험", "관망 전략" 모드로 설정 가능한 Bomber Utility의 셋업 파일 이 전략을 빠르게 설치, 설정, 시작할 수 있도록 돕는 단계별 영상 매뉴얼 주의: 위의 모든 보너스를 받기 위해서는 MQL5 개인 메시지 시스템을 통해 판매자에게 연락해 주세요. 독창적인 커스텀 지표인 “Divergence Bomber(다이버전스 봄버)”를 소개합니다. 이 지표는 MACD 다이버전스(괴리) 전략을 기반으로 한 올인원(All-in-One) 거래 시스템입니다. 이 기술 지표의 주요 목적은 가격과 MACD 지표 간의 다이버전스를 감지하고, **향후 가격이 어느 방향으로 움직일지를 알려주는
Entry In The Zone and SMC Multi Timeframe is a real-time 2-in-1 market analysis tool that combines market structure analysis and a No Repaint BUY / SELL signal system into a single indicator, built on Smart Money Concepts (SMC) — a widely adopted framework used by professional traders to understand market structure. This indicator helps you see the market more clearly, make decisions based on structure rather than guesswork, and focus on high-probability zones where price is more likely to react
Grabber System MT5
Ihor Otkydach
4.83 (23)
탁월한 기술적 지표인 Grabber를 소개합니다. 이 도구는 즉시 사용 가능한 “올인원(All-Inclusive)” 트레이딩 전략으로 작동합니다. 하나의 코드 안에 강력한 시장 기술 분석 도구, 매매 신호(화살표), 알림 기능, 푸시 알림이 통합되어 있습니다. 이 인디케이터를 구매하신 모든 분들께는 다음의 항목이 무료로 제공됩니다: Grabber 유틸리티: 오픈 포지션을 자동으로 관리하는 도구 단계별 영상 매뉴얼: 설치, 설정, 그리고 실제 거래 방법을 안내 맞춤형 세트 파일: 인디케이터를 빠르게 자동 설정하여 최고의 성과를 낼 수 있도록 도와줍니다 다른 전략은 이제 잊어버리세요! Grabber만이 여러분을 새로운 트레이딩의 정점으로 이끌어 줄 수 있습니다. Grabber 전략의 주요 특징: 거래 시간 프레임: M5부터 H4까지 거래 가능한 자산: 어떤 자산이든 사용 가능하지만, 제가 직접 테스트한 종목들을 추천드립니다 (GBPUSD, GBPCAD, GBPCHF, AUDCAD, AU
Power Candles MT5
Daniel Stein
5 (7)
Power Candles V3 - 최초의 자가 최적화 강도 지표 Power Candles V3 는 강도 분석을 즉시 실행 가능한 트레이딩 시스템으로 바꿉니다. 시장 강도에 따라 차트에 색을 입히는 것에 그치지 않고, 백그라운드에서 실시간 자동 최적화를 돌려 해당 심볼에 가장 적합한 Stop Loss, Take Profit, 시그널 임계값을 제시합니다. 원클릭으로 실거래에 그대로 적용됩니다. 이 도구는 Stein Investments 생태계의 일부입니다.  18종 도구 전체 탐색, AI 기반 셋업 추천,  커뮤니티 참여는 여기에서: https://stein.investments Version 3 신규 기능 - AUTO-OPTIMIZER 차트가 로드될 때마다, 그리고 각 봉이 마감될 때마다 Power Candles V3는 해당 심볼의 과거 데이터 위에서 3,000개 이상의 트레이드 조합 을 시뮬레이션합니다: 두 가지 전략 을 병렬 테스트: Momentum(MOM)과 Reversal(
이 지표를 구매하면 제 프로페셔널 트레이드 매니저를 무료로 드립니다. 우선 이 거래 시스템이 리페인팅, 리드로잉 및 레이그 인디케이터가 아니라는 점을 강조하는 것이 중요합니다. 이는 수동 및 로봇 거래 모두에 이상적인 것으로 만듭니다. 온라인 강좌, 설명서 및 프리셋 다운로드. "스마트 트렌드 트레이딩 시스템 MT5"은 새로운 및 경험이 풍부한 트레이더를 위해 맞춤형으로 제작된 종합적인 거래 솔루션입니다. 10개 이상의 프리미엄 인디케이터를 결합하고 7개 이상의 견고한 거래 전략을 특징으로 하여 다양한 시장 조건에 대한 다목적 선택이 가능합니다. 트렌드 추종 전략: 효과적인 트렌드 추이를 타기 위한 정확한 진입 및 손절 관리를 제공합니다. 반전 전략: 잠재적인 트렌드 반전을 식별하여 트레이더가 범위 시장을 활용할 수 있게 합니다. 스캘핑 전략: 빠르고 정확한 데이 트레이딩 및 단기 거래를 위해 설계되었습니다. 안정성: 모든 인디케이터가 리페인팅, 리드로잉 및 레이그가 아니므로 신뢰
SignalTech MT5
Yue Wang
5 (4)
SignalTech MT5 is a trading system for EURUSD, USDCHF, USDJPY, AUDUSD, NZDUSD, EURJPY, AUDJPY, NZDJPY, CADJPY H2 and H3 Timeframe.  It can generate signals with Buy/Sell Arrows and Pop-Up/Sound Alerts. Each signal has clear Entry and Stop Loss levels, which should be automatically flagged on the chart, as well as potential Targets 1, 2, and 3. The Entry and TP levels are fixed after the trade is taken. The exit level is dynamic. If there are signs of a potential short-term trend reversal, the
Quantum TrendPulse
Bogdan Ion Puscasu
5 (23)
SuperTrend   ,   RSI   ,   Stochastic   의 힘을 하나의 포괄적인 지표로 결합하여 트레이딩 잠재력을 극대화하는 궁극의 트레이딩 도구   인 Quantum TrendPulse를   소개합니다. 정밀성과 효율성을 추구하는 트레이더를 위해 설계된 이 지표는 시장 추세, 모멘텀 변화, 최적의 진입 및 종료 지점을 자신 있게 식별하는 데 도움이 됩니다. 주요 특징: SuperTrend 통합:   주요 시장 추세를 쉽게 따라가고 수익성의 물결을 타세요. RSI 정밀도:   매수 과다 및 매도 과다 수준을 감지하여 시장 반전 시점을 파악하는 데 적합하며 SuperTrend 필터로 사용 가능 확률적 정확도:   변동성이 큰 시장에서 숨겨진 기회를 찾기 위해 확률적 진동   을 활용하고 SuperTrend의 필터로 사용 다중 시간대 분석:   M5부터 H1 또는 H4까지 다양한 시간대에 걸쳐 시장을 최신 상태로 유지하세요. 맞춤형 알림:   맞춤형 거래 조건이 충족되면
Gann Made Easy MT5
Oleg Rodin
5 (2)
Gann Made Easy 는 mr.의 이론을 사용하여 최고의 거래 원칙을 기반으로 하는 전문적이고 사용하기 쉬운 Forex 거래 시스템입니다. W.D. 간. 이 표시기는 Stop Loss 및 Take Profit Levels를 포함하여 정확한 BUY 및 SELL 신호를 제공합니다. PUSH 알림을 사용하여 이동 중에도 거래할 수 있습니다. 구매 후 거래 방법 안내 및 유용한 추가 지표를 무료로 받으시려면 저에게 연락주세요! 아마도 Gann 거래 방법에 대해 이미 여러 번 들었을 것입니다. 일반적으로 Gann의 이론은 초보자 거래자뿐만 아니라 이미 거래 경험이 있는 사람들에게도 매우 복잡한 것입니다. Gann의 거래 방식은 이론적으로 적용하기 쉽지 않기 때문입니다. 나는 그 지식을 연마하고 Forex 지표에 최고의 원칙을 적용하기 위해 몇 년을 보냈습니다. 표시기는 적용하기가 매우 쉽습니다. 차트에 첨부하고 간단한 거래 권장 사항을 따르기만 하면 됩니다. 지표는 지속적으로 시장 분석
Trend Screener Pro MT5
STE S.S.COMPANY
4.85 (104)
트렌드 표시기, 트렌드 트레이딩 및 필터링을 위한 획기적인 고유 솔루션, 하나의 도구 안에 내장된 모든 중요한 트렌드 기능! Forex, 상품, 암호 화폐, 지수 및 주식과 같은 모든 기호/도구에 사용할 수 있는 100% 다시 칠하지 않는 다중 시간 프레임 및 다중 통화 표시기입니다. Trend Screener는 차트에 점이 있는 화살표 추세 신호를 제공하는 효율적인 지표 추세 추종 지표입니다. 추세 분석기 표시기에서 사용할 수 있는 기능: 1. 트렌드 스캐너. 2. 최대 이익 분석이 있는 추세선. 3. 추세 통화 강도 측정기. 4. 경고가 있는 추세 반전 점. 5. 경고가 있는 강력한 추세 점. 6. 추세 화살표 Trend Screener Indicator가 있는 일일 분석 예, 일일 신호 성능...등은 여기에서 찾을 수 있습니다. 여기를 클릭하십시오. LIMITED TIME OFFER : Trend Screener Indicator는 50$ 및 평생 동안만 사용할 수 있습니다.
소개       Quantum Breakout PRO   , 브레이크아웃 존 거래 방식을 변화시키는 획기적인 MQL5 지표! 13년 이상의 거래 경험을 가진 숙련된 트레이더 팀이 개발한       퀀텀 브레이크아웃 PRO       혁신적이고 역동적인 브레이크아웃 존 전략으로 거래 여정을 새로운 차원으로 끌어올리도록 설계되었습니다. Quantum Breakout Indicator는 5개의 이익 목표 영역이 있는 브레이크아웃 영역의 신호 화살표와 브레이크아웃 상자를 기반으로 한 손절 제안을 제공합니다. 초보자 거래자와 전문 거래자 모두에게 적합합니다. Quantum EA 채널:       여기를 클릭하세요 중요한! 구매 후 설치 매뉴얼을 받으려면 개인 메시지를 보내주십시오. 추천: 기간: M15 통화쌍: GBPJPY, EURJPY, USDJPY,NZDUSD, XAUUSD 계정 유형: 스프레드가 매우 낮은 ECN, Raw 또는 Razor 브로커 시간: GMT +3 중개인 :
Entry Points Pro for MT5
Yury Orlov
4.48 (138)
다시 색을 칠하지 않고 거래에 진입할 수 있는 정확한 신호를 제공하는 MT5용 지표입니다. 외환, 암호화폐, 금속, 주식, 지수 등 모든 금융 자산에 적용할 수 있습니다. 매우 정확한 추정값을 제공하고 매수와 매도의 가장 좋은 시점을 알려줍니다. 하나의 시그널로 수익을 내는 지표의 예와 함께 비디오 (6:22)시청하십시오! 대부분의 거래자는 Entry Points Pro 지표의 도움으로 첫 거래 주 동안 트레이딩 결과를 개선합니다. 저희의   Telegram Group 을 구독하세요! Entry Points Pro 지표의 좋은점. 재도색이 없는 진입 신호 신호가 나타나고 확인되면(시그널 캔들이 완성된 경우) 신호는 더 이상 사라지지 않습니다. 여타 보조지표의 경우 신호를 표시한 다음 제거되기 때문에 큰 재정적 손실로 이어집니다. 오류 없는 거래 게시 알고리즘을 통해 트레이드(진입 또는 청산)를 할 이상적인 순간을 찾을 수 있으며, 이를 통해 이를 사용하는 모든 거래자의 성공률이
Azimuth Pro
Ottaviano De Cicco
5 (7)
Azimuth Pro V2: Synthetic Fractal Structure and Confirmed Entries for MT5 Overview Azimuth Pro is a multi-level swing structure indicator by Merkava Labs . Four nested swing layers, swing-anchored VWAP, ABC pattern detection, three-timeframe structural filtering, and closed-bar confirmed entries — one chart, one workflow from micro-swings to macro-cycles. This is not a blind signal product. It is a structure-first workflow for traders who care about location, context, and timing. V2 Launch Offe
Meravith MT5
Ivan Stefanov
5 (1)
마켓 메이커를 위한 도구. Meravith는 다음과 같은 기능을 제공합니다: 모든 타임프레임을 분석하고 현재 유효한 추세를 표시합니다. 강세와 약세 거래량이 동일한 유동성 구간(거래량 균형 구간)을 강조 표시합니다. 서로 다른 타임프레임의 모든 유동성 레벨을 차트에 직접 표시합니다. 텍스트 기반 시장 분석을 생성하여 참고용으로 제공합니다. 현재 추세를 기반으로 목표가, 지지선 및 손절가를 계산합니다. 거래의 위험 대비 보상 비율(Risk/Reward)을 계산합니다. 계좌 잔고에 따라 포지션 크기를 산출하고 잠재 수익을 추정합니다. 시장에 중대한 변화가 발생할 경우 경고도 제공합니다. 지표의 주요 라인: 강세/약세 거래량 소진 라인 — 목표가로 사용됩니다. 시장 추세를 나타내는 라인. 시장이 강세인지 약세인지에 따라 색상이 변경되며 추세 지지선 역할을 합니다. 색상은 주로 시장 심리를 보여줍니다. 거래량 균형선(Eq). Eq(Volume Equilibrium) 라인은 시스템의 핵심입니
Btmm state engine pro
Garry James Goodchild
5 (4)
BTMM State Engine Pro is a MetaTrader 5 indicator for traders who use the Beat The Market Maker approach: Asian session context, kill zone timing, level progression, peak formation detection, and a multi-pair scanner from a single chart. It combines cycle state logic with a built-in scanner dashboard so you do not need the same tool on many charts at once. What it does Draws the Asian session range; session times can follow broker server offset or be set in inputs. Tracks level progression (L
FX Trend MT5 NG
Daniel Stein
5 (4)
FX Trend NG: 차세대 멀티 마켓 트렌드 인텔리전스 개요 FX Trend NG 는 다중 시간 프레임 기반의 전문 트렌드 분석 및 시장 모니터링 도구입니다. 몇 초 만에 전체 시장 구조를 파악할 수 있도록 설계되었습니다. 여러 차트를 일일이 전환할 필요 없이, 어떤 종목이 추세에 있는지, 어디에서 모멘텀이 약화되고 있는지, 그리고 어떤 시간 프레임이 서로 정렬되어 있는지 즉시 확인할 수 있습니다. 출시 기념 특별 혜택 – FX Trend NG 를 $30 (6개월) 또는 $80 평생 라이선스 로 이용할 수 있습니다. 이미 Stein Investments 고객이신가요? -> 메시지를 보내 전용 고객 그룹에 참여하세요. 설정이나 사용 방법이 필요하신가요? -> Stein Investments 공식 페이지 를 방문하세요. 1. FX Trend NG가 특별한 이유 3단계 추세 로직 – 단순한 Buy / Sell이 아닙니다 • 대부분의 지표는 Buy 또는 Sell 두 가지 상태만 제
Atomic Analyst MT5
Issam Kassas
3.94 (31)
우선적으로 언급할 점은이 거래 지표가 다시 그리지 않고 지연되지 않으며 이를 통해 수동 및 로봇 거래 모두에 이상적이라는 점입니다. 사용자 매뉴얼: 설정, 입력 및 전략. Atomic Analyst는 가격의 강도와 모멘텀을 활용하여 시장에서 더 나은 이점을 찾는 PA Price Action Indicator입니다. 고급 필터를 장착하여 잡음과 거짓 신호를 제거하고 거래 잠재력을 높이는 데 도움이 됩니다. 복잡한 지표의 다중 레이어를 사용하여 Atomic Analyst는 차트를 스캔하고 복잡한 수학적 계산을 간단한 신호와 색상으로 변환하여 초보 트레이더가 이해하고 일관된 거래 결정을 내릴 수 있도록합니다. "Atomic Analyst"는 새로운 및 경험이 풍부한 트레이더를위한 종합적인 거래 솔루션입니다. 프리미엄 지표와 최고 수준의 기능을 하나의 거래 전략에 결합하여 모든 종류의 트레이더에 대한 다재다능한 선택지가되었습니다. 인트라데이 거래 및 스캘핑 전략 : 빠르고 정확한 일일
OmniSync Projection
Antonio-alin Teculescu
5 (1)
Chronos Fractal Engine is an innovative price projection indicator for MetaTrader 5, designed to transform your technical analysis by intelligently identifying and projecting historical price patterns. Built upon an advanced correlation algorithm and the fractal principles of the market, this powerful tool visualizes potential future price movements, giving you a unique edge in your trading decisions. What is Chronos Fractal Engine? At its core, the Chronos Fractal Engine employs a sophisticat
SMC Intraday Formula
Kareem Abbas
5 (4)
먼저 솔직하게 말하겠습니다. 어떤 인디케이터도 단독으로 당신을 수익성 있게 만들어주지 않습니다. 누군가 그렇게 말한다면, 그는 당신에게 꿈을 파는 것입니다. 완벽한 매수/매도 화살표를 보여주는 모든 인디케이터는 완벽하게 보이도록 만들 수 있습니다 — 단지 올바른 과거 구간을 확대하고 승리한 거래만 캡처하면 됩니다. 우리는 그렇게 하지 않습니다.  SMC Intraday Formula는 도구입니다. 시장 구조를 읽고, 가장 높은 확률의 가격 구간을 표시하며, 현재 스마트 머니의 흐름이 어떻게 보이는지 아주 단순한 언어로 보여줍니다. 최종 결정은 여전히 당신이 합니다. 실행도 당신이 합니다. 하지만 이제는 희망이 아니라 정확성으로 거래하게 됩니다. 우리는 이 인디케이터를 지난 약 3년 동안 골드(XAUUSD) 및 주요 외환 통화쌍의 데이 트레이딩 스캘핑에 사용해 왔습니다. M1, M5, M15, M30에서 우리의 핵심 도구입니다. 이 도구는 미래를 예측하려 하지 않습니다 — 지금 형성
RelicusRoad Pro MT5
Relicus LLC
5 (24)
RelicusRoad Pro: 퀀트 시장 운영 체제 70% 할인 평생 이용권 (한정 시간) - 2,000명 이상의 트레이더와 함께하세요 왜 대부분의 트레이더는 "완벽한" 지표를 가지고도 실패할까요? 진공 상태에서 단일 개념 만으로 거래하기 때문입니다. 문맥 없는 신호는 도박입니다. 지속적인 승리를 위해서는 컨플루언스(중첩) 가 필요합니다. RelicusRoad Pro는 단순한 화살표 지표가 아닙니다. 완전한 퀀트 시장 생태계 입니다. 독점적인 변동성 모델링을 사용하여 가격이 이동하는 "공정 가치 로드"를 매핑하고, 단순 노이즈와 실제 구조적 돌파를 구분합니다. 추측은 그만두세요. 기관급 로드 로직으로 거래를 시작하세요. 핵심 엔진: "Road" 알고리즘 시스템의 중심에는 시장 상황에 실시간으로 적응하는 동적 변동성 채널인 Road Algo 가 있습니다. 세이프 라인(평형) 과 가격이 수학적으로 반전될 가능성이 높은 확장 레벨 을 투영합니다. Simple Road: 일반적인 시장을 위
Crystal Heikin Ashi Signals
Muhammad Jawad Shabir
5 (2)
Crystal Heikin Ashi Signals - Professional Trend & Signal Detection Indicator Advanced Heikin Ashi Visualization with Intelligent Signal System for Manual & Automated Trading Final Price: $149 ---------> Price goes up $10 after every 10 sales . Limited slots available — act fast . Overview Crystal Heikin Ashi Signals is a professional-grade MetaTrader 5 indicator that combines pure Heikin Ashi candle visualization with an advanced momentum-shift detection system. Designed for both manual traders
Trend indicator AI mt5
Ramil Minniakhmetov
5 (17)
트렌드 인공 지능 지표는 실행 가능한 진입 점 및 반전 경고와 추세 식별을 결합하여 상인의 시장 분석을 향상시킬 훌륭한 도구입니다. 이 표시기는 사용자가 자신감과 정밀도로 외환 시장의 복잡성을 탐색 할 수 있도록 지원합니다 기본 신호 외에도 트렌드 인공 지능 지표는 풀백 또는 되돌림 중에 발생하는 2 차 진입 점을 식별하여 거래자가 기존 트렌드 내에서 가격 수정을 활용할 수 있도록합니다. 중요한 장점: ·작동 4 및 5 *명확한 구매 또는 판매 신호 *다시 칠하지 않습니다 *모든 자산에서 작동 나는 전보 사기에 개 또는 세트를 판매하지 않도록주의. 모든 설정은 블로그에 여기에 무료.  중요! 지침 및 보너스를 얻기 위해 구입 후 즉시 저에게 연락! 진짜 가동 감시는 뿐 아니라 나의 다른 제품 여기에서 찾아낼 수 있습니다: https://www.mql5.com/en/users/mechanic/seller&nbsp ; 설정 및 입력: 모든 자산에 대해 기본 설정을 권
Market Structure Order Block Dashboard MT5는 시장 구조와 주요 가격 반응 구역을 차트에서 직접 읽고자 하는 트레이더를 위해 설계된 MT5 지표입니다. BOS, ChoCH, 오더 블록, Fair Value Gap (FVG), 유동성, Kill Zones, Volume Profile 그리고 빠른 분석을 위한 콤팩트한 대시보드를 결합합니다. 이 지표는 시장 구조, ICT 및 Smart Money 개념을 의사결정 프레임워크로 사용하는 트레이더를 대상으로 합니다. 추세 지속, 가능한 반전, 가격 불균형, 유동성 타겟 및 관심 구역을 보다 체계적으로 식별하는 데 도움을 줄 수 있습니다. 구매자를 위한 포함 리소스 구매 후 MQL5 개인 메시지로 요청하시면 완전한 PDF 사용 설명서와 파라미터 설정 팁을 제공해 드립니다. MQL5 개인 메시지를 통한 직접 기술 지원. 1.20 버전은 두 가지 주요 추가 기능을 제공합니다: Pending BOS / Pending
FX Levels MT5
Daniel Stein
5 (13)
FX Levels: 모든 시장을 위한 뛰어난 정확도의 지지와 저항 간단 요약 통화쌍, 지수, 주식, 원자재 등 어떤 시장이든 믿을 만한 지지·저항 레벨을 찾고 싶나요? FX Levels 는 전통적인 “Lighthouse” 기법과 첨단 동적 접근을 결합해, 거의 보편적인 정확성을 제공합니다. 실제 브로커 경험을 반영하고, 자동화된 일별 업데이트와 실시간 업데이트를 결합함으로써 FX Levels 는 가격 반전 포인트를 파악하고, 수익 목표를 설정하며, 자신 있게 트레이드를 관리할 수 있게 돕습니다. 지금 바로 시도해 보세요—정교한 지지/저항 분석이 어떻게 여러분의 트레이딩을 한 단계 끌어올릴 수 있는지 직접 확인하세요! 1. FX Levels가 트레이더에게 매우 유용한 이유 뛰어난 정확도의 지지·저항 존 • FX Levels 는 다양한 브로커 환경에서도 거의 동일한 존을 생성하도록 설계되어, 데이터 피드나 시간 설정 차이로 인한 불일치를 해소합니다. • 즉, 어떤 브로커를 사용하
Bill Williams Advanced
Siarhei Vashchylka
5 (11)
Bill Williams Advanced is designed for automatic chart analysis using Bill Williams' "Profitunity" system. The indicator analyzes four timeframes at once. Manual (Be sure to read before purchasing) Advantages 1. Analyzes the chart using Bill Williams' "Profitunity" system. Signals are displayed in a table in the corner of the screen and on the price chart. 2. Finds all known AO and AC signals, as well as zone signals. Equipped with a trend filter based on the Alligator. 3. Finds "Divergence Bar
Basic Harmonic Patterns Dashboard MT5
Mehran Sepah Mansoor
4.36 (11)
이 대시보드는 선택한 심볼에 대해 사용 가능한 최신 고조파 패턴을 표시하므로 시간을 절약하고 더 효율적으로 사용할 수 있습니다 /   MT4 버전 . 무료 인디케이터:   Basic Harmonic Pattern 인디케이터 열 Symbol :   선택한 심볼이 나타납니다 Trend :   강세 또는 약세 Pattern :   패턴 유형(가틀리, 나비, 박쥐, 게, 상어, 사이퍼 또는 ABCD) Entry :   진입 가격 SL:   스톱로스 가격 TP1:   1차 테이크프로핏 가격 TP2:   2차 테이크프로핏 가격 TP3:   3차 테이크프로핏 가격 Current price:   현재 가격 Age (in bars):   마지막으로 그려진 패턴의 나이 주요 입력 Symbols :   "28개 주요 통화쌍" 또는 "선택한 심볼" 중에서 선택합니다. Selected Symbols :   쉼표로 구분하여 모니터링하려는 원하는 심볼("EURUSD,GBPUSD,XAUUSD")을 선택
ARICoins
Temirlan Kdyrkhan
ARICoin is a powerful trading companion designed to generate high-probability entry signals with dynamic TP/SL/DP levels based on volatility. Built-in performance tracking shows win/loss stats, PP1/PP2 hits, and success rates all updated live. Key Features: Buy/Sell signals with adaptive volatility bands Real-time TP/SL/DP levels based on ATR Built-in MA Filter with optional ATR/StdDev volatility Performance stats panel (Success, Profit/Loss, PP1/PP2) Alerts via popup, sound, push, or email Cust
IX Power MT5
Daniel Stein
4.92 (13)
IX Power: 지수, 원자재, 암호화폐 및 외환 시장 통찰력을 발견하세요 개요 IX Power 는 지수, 원자재, 암호화폐 및 외환 시장의 강도를 분석할 수 있는 다목적 도구입니다. FX Power 는 모든 가용 통화 쌍 데이터를 사용하여 외환 쌍에 대해 가장 높은 정확도를 제공하는 반면, IX Power 는 기초 자산 시장 데이터에만 초점을 맞춥니다. 이로 인해 IX Power 는 비외환 시장에 이상적이며, 다중 쌍 분석이 필요하지 않은 간단한 외환 분석에도 신뢰할 수 있는 도구입니다. 모든 차트에서 매끄럽게 작동하며, 거래 결정을 향상시키기 위한 명확하고 실행 가능한 통찰력을 제공합니다. 1. IX Power가 트레이더에게 유용한 이유 다양한 시장 강도 분석 • IX Power 는 지수, 원자재, 암호화폐 및 외환 심볼의 강도를 계산하여 각 시장에 맞는 통찰력을 제공합니다. • US30, WTI, 금, 비트코인 또는 통화 쌍과 같은 자산을 모니터링하여 거래 기회를 발견
FX Power MT5 NG
Daniel Stein
5 (31)
FX Power: 통화 강세 분석으로 더 스마트한 거래 결정을 개요 FX Power 는 어떤 시장 상황에서도 주요 통화와 금의 실제 강세를 이해하기 위한 필수 도구입니다. 강한 통화를 매수하고 약한 통화를 매도함으로써 FX Power 는 거래 결정을 단순화하고 높은 확률의 기회를 발견합니다. 트렌드를 따르거나 극단적인 델타 값을 사용해 반전을 예측하고자 한다면, 이 도구는 귀하의 거래 스타일에 완벽히 적응합니다. 단순히 거래하지 말고, FX Power 로 더 스마트하게 거래하세요. 1. FX Power가 거래자에게 매우 유용한 이유 통화와 금의 실시간 강세 분석 • FX Power 는 주요 통화와 금의 상대적 강세를 계산하고 표시하여 시장 역학에 대한 명확한 통찰력을 제공합니다. • 어떤 자산이 앞서고 있고 어떤 자산이 뒤처지는지 모니터링하여 보다 현명한 거래 결정을 내릴 수 있습니다. 포괄적인 멀티 타임프레임 뷰 • 단기, 중기 및 장기 타임프레임에서 통화와 금의 강세를
Power Bar MT5
Daniel Stein
실제 자금을 투입하기 전에 어떤 전략이 내 심볼에서 효과적인지 확인하세요. Power Bar는 모든 심볼과 모든 타임프레임에서 극단적인 가격 바 를 감지한 다음, 3가지 다른 트레이딩 전략을 즉시 백테스트하여 승률, 수익 팩터, 손익을 나란히 비교할 수 있습니다. 모든 것이 하나의 인터랙티브 패널에 담겨 있습니다. 추측 없음. 커브 피팅 없음. 오직 데이터뿐입니다. Power Bar가 특별한 이유 대부분의 인디케이터는 신호를 주고 그것이 효과가 있는지는 추측에 맡깁니다. Power Bar는 한 걸음 더 나아갑니다 - 모든 신호를 세 가지 전략 에 대해 테스트하고 통계를 보여줍니다. FlipFlop, Momentum, Reversal을 원클릭으로 전환하고 숫자가 즉시 변하는 것을 확인하세요. FlipFlop - 항상 포지션 유지. 신호에 진입하고, 반대 신호에 청산. 당사의 연구에 따르면 US30, US500, DAX와 같은 추세가 있는 지수에서 가장 효과적입니다. Momentum
제작자의 제품 더 보기
Special offer : ALL TOOLS , just $35 each! New tools   will be   $30   for the   first week   or the   first 3 purchases !  Trading Tools Channel on MQL5 : Join my MQL5 channel to update the latest news from me SuperTrend ATR Multiplier with Scanner for MT5 를 소개합니다 – 시장 트렌드를 앞서기 위해 설계된 다기능 강력한 도구로, 사용자 맞춤형 기능과 실시간 알림을 제공합니다. Kivanc Ozbilgic 의 신뢰할 수 있는 SuperTrend 로직을 기반으로 한 이 지표는 정확한 트렌드 신호를 제공합니다. ATR 계산 방법을 RMA (상대 이동 평균)와 SMA (단순 이동 평균) 중에서 선택하여 최대한의 유연성을 제공할 수 있습니다. 기본 설정으로 ATR 기간은 10, 배수는 3
FREE
Volumatic VIDyA MT4
Duc Hoan Nguyen
4.5 (4)
Special offer : ALL TOOLS , just $35 each! New tools   will be   $30   for the   first week   or the   first 3 purchases !  Trading Tools Channel on MQL5 : Join my MQL5 channel to update the latest news from me Volumatic VIDYA (Variable Index Dynamic Average) 는 트렌드를 추적하고 각 트렌드 단계에서 매수 및 매도 압력을 분석하기 위해 설계된 고급 지표입니다. 가변 지수 동적 평균(Variable Index Dynamic Average)을 핵심 동적 평활화 기술로 활용하여 이 도구는 주요 시장 구조 수준에서 가격 및 거래량 역학에 대한 중요한 통찰력을 제공합니다. MT5 버전 보기:  Volumatic VIDyA MT5 다른 제품 보기:    모든 제품 To use iCustom
Supertrend Fakeout MT5
Duc Hoan Nguyen
5 (4)
Special offer : ALL TOOLS , just $35 each! New tools   will be   $30   for the   first week   or the   first 3 purchases !  Trading Tools Channel on MQL5 : Join my MQL5 channel to update the latest news from me Supertrend Fakeout 지표는 기존의 Supertrend 지표를 개선한 버전으로, 더 신뢰할 수 있는 추세 신호를 제공하도록 설계되었습니다. Fakeout Index Limit 와 Fakeout ATR Mult 와 같은 고급 기능을 통합하여 단기 가격 변동이나 시장 노이즈로 인해 발생하는 잘못된 추세 반전을 필터링하는 데 도움을 줍니다. MT4 버전에 대해 자세히 알아보기:  Supertrend Fakeout MT4 다른 제품 보기:   모든 제품 작동 원리 Supertrend Fakeout 지표는
FREE
Special offer : ALL TOOLS , just $35 each! New tools   will be   $30   for the   first week   or the   first 3 purchases !  Trading Tools Channel on MQL5 : Join my MQL5 channel to update the latest news from me Trendlines with Breaks Scanner 는 트레이더가 중요한 트렌드를 식별하고 실시간으로 돌파를 감지하도록 설계된 첨단 거래 도구입니다. 피벗 포인트를 기반으로 자동 생성된 추세선을 사용하여 이 지표는 트레이더가 정밀하고 자신 있게 거래 기회를 포착할 수 있도록 돕습니다. MT4 버전 보기:  Trendlines with Breaks Scanner MT4 다른 제품 보기:   All Products 주요 기능 1. 실시간 돌파 감지 돌파 알림: 가격이 추세선을 돌파하면 즉시 알림을 받습니다. 통
Special offer : ALL TOOLS , just $35 each! New tools   will be   $30   for the   first week   or the   first 3 purchases !  Trading Tools Channel on MQL5 : Join my MQL5 channel to update the latest news from me Liquidity Pools 지표는 고급 도구로, 빈번하게 윅이 닿는 고점 및 저점을 분석하고 각 구역에서 거래된 재방문 횟수와 거래량을 분석하여 잠재적인 유동성 구역을 차트에 식별하고 표시합니다. 이 도구는 거래자에게 유동성이 쌓이는 시장 역학에 대한 종합적인 뷰를 제공하여 잠재적인 전환점을 예측하고 주요 지지 및 저항 수준을 식별하는 데 도움을 줍니다. MT4 버전 보기:  Liquidity Pools MT4 다른 제품 보기:   모든 제품 주요 특징 및 혜택 1. 정확한 유동성 구역 식별 고영향 구역 강조
Special offer : ALL TOOLS , just $35 each! New tools   will be   $30   for the   first week   or the   first 3 purchases !  Trading Tools Channel on MQL5 : Join my MQL5 channel to update the latest news from me Follow Line MT5와 스캐너로 거래에서 앞서 나가세요. 이 고급 변동성 기반 지표는 진지한 트레이더를 위해 설계되었습니다. 이 도구는 Bollinger 밴드의 강력한 기능과 맞춤 설정을 결합하여 가격 움직임에 대한 정확한 통찰력을 제공합니다. See more MT4 version at:   Follow Line MT4 with Scanner See more products at:   https://www.mql5.com/en/users/ndhsfy/seller Follow Line의 핵심은 가격이 1
FREE
Special offer : ALL TOOLS , just $35 each! New tools   will be   $30   for the   first week   or the   first 3 purchases !  Trading Tools Channel on MQL5 : Join my MQL5 channel to update the latest news from me 다중 시간 프레임의 체적 주문 블록 지표는 주요 시장 참가자들이 주문을 축적하는 중요한 가격 영역을 식별하여 시장 행동에 대한 더 깊은 통찰을 원하는 트레이더들을 위해 설계된 강력한 도구입니다. 이 영역들은 체적 주문 블록으로 알려져 있으며, 잠재적 지지 및 저항 구역으로 작용해 정보에 입각한 거래 결정에 중요한 이점을 제공합니다. MT5 버전 보기:   Volumetric Order Blocks MT5 Multi Timeframe See more products at:   https://www.mql5.com
OA SnR Power MT5
Duc Hoan Nguyen
5 (3)
Special offer : ALL TOOLS , just $35 each! New tools   will be   $30   for the   first week   or the   first 3 purchases !  Trading Tools Channel on MQL5 : Join my MQL5 channel to update the latest news from me 개요 OA SnR Power는 트레이더가 지지와 저항 레벨의 강도를 식별하고 평가하도록 설계된 강력한 도구입니다. 거래량, 반등 빈도 및 재테스트 횟수와 같은 주요 요소를 통합하여 이 지표는 시장의 주요 가격 영역에 대한 종합적인 뷰를 제공합니다. 더 많은 제품 보기:   모든 제품 OA SnR Power의 작동 원리 고점과 저점 식별 이 지표는 지역 고점과 저점을 계산하기 위해 지능형 알고리즘을 사용합니다. 사용자는 영역 폭 설정을 조정하여 잠재적인 지지 및 저항 수준을 정확하게 탐지할 수 있습니다. 주요
FREE
Volumatic VIDyA MT5
Duc Hoan Nguyen
5 (2)
Special offer : ALL TOOLS , just $35 each! New tools   will be   $30   for the   first week   or the   first 3 purchases !  Trading Tools Channel on MQL5 : Join my MQL5 channel to update the latest news from me Volumatic VIDYA (Variable Index Dynamic Average) 는 트렌드를 추적하고 각 트렌드 단계에서 매수 및 매도 압력을 분석하기 위해 설계된 고급 지표입니다. 가변 지수 동적 평균(Variable Index Dynamic Average)을 핵심 동적 평활화 기술로 활용하여 이 도구는 주요 시장 구조 수준에서 가격 및 거래량 역학에 대한 중요한 통찰력을 제공합니다. MT4 버전 보기:  Volumatic VIDyA MT4 다른 제품 보기:    모든 제품 To use iCustom
Liquidity Pools MT4
Duc Hoan Nguyen
5 (1)
Special offer : ALL TOOLS , just $35 each! New tools   will be   $30   for the   first week   or the   first 3 purchases !  Trading Tools Channel on MQL5 : Join my MQL5 channel to update the latest news from me Liquidity Pools 지표는 고급 도구로, 빈번하게 윅이 닿는 고점 및 저점을 분석하고 각 구역에서 거래된 재방문 횟수와 거래량을 분석하여 잠재적인 유동성 구역을 차트에 식별하고 표시합니다. 이 도구는 거래자에게 유동성이 쌓이는 시장 역학에 대한 종합적인 뷰를 제공하여 잠재적인 전환점을 예측하고 주요 지지 및 저항 수준을 식별하는 데 도움을 줍니다. MT5 버전 보기:   Liquidity Pools MT5 다른 제품 보기:   모든 제품 주요 특징 및 혜택 1. 정확한 유동성 구역 식별 고영향 구역 강
Special offer : ALL TOOLS , just $35 each! New tools   will be   $30   for the   first week   or the   first 3 purchases !  Trading Tools Channel on MQL5 : Join my MQL5 channel to update the latest news from me 최근 변동성이 큰 금융 트레이딩 환경에서 지지선과 저항선을 정확하게 파악하는 것은 트레이더가 올바른 의사결정을 내리는 데 매우 중요합니다. Predictive Ranges Scanner Multi-TF 는 여러 통화쌍과 시간 프레임에 걸쳐 미래의 매매 구간을 스캔 및 예측하도록 설계된 고급 도구로, 효과적이고 정밀한 시장 추세 파악을 지원합니다. See more MT5 version at:  Predictive Ranges MT5 Scanner Multi TF See more products at:   All
Supertrend Fakeout MT4
Duc Hoan Nguyen
4.25 (4)
Special offer : ALL TOOLS , just $35 each! New tools   will be   $30   for the   first week   or the   first 3 purchases !  Trading Tools Channel on MQL5 : Join my MQL5 channel to update the latest news from me Supertrend Fakeout 지표는 기존의 Supertrend 지표를 개선한 버전으로, 더 신뢰할 수 있는 추세 신호를 제공하도록 설계되었습니다. Fakeout Index Limit 와 Fakeout ATR Mult 와 같은 고급 기능을 통합하여 단기 가격 변동이나 시장 노이즈로 인해 발생하는 잘못된 추세 반전을 필터링하는 데 도움을 줍니다. MT5 버전에 대해 자세히 알아보기:  Supertrend Fakeout MT5 다른 제품 보기:   모든 제품 작동 원리 Supertrend Fakeout 지표는
FREE
Special offer : ALL TOOLS , just $35 each! New tools   will be   $30   for the   first week   or the   first 3 purchases !  Trading Tools Channel on MQL5 : Join my MQL5 channel to update the latest news from me 다중 시간 프레임의 체적 주문 블록 지표는 주요 시장 참가자들이 주문을 축적하는 중요한 가격 영역을 식별하여 시장 행동에 대한 더 깊은 통찰을 원하는 트레이더들을 위해 설계된 강력한 도구입니다. 이 영역들은 체적 주문 블록으로 알려져 있으며, 잠재적 지지 및 저항 구역으로 작용해 정보에 입각한 거래 결정에 중요한 이점을 제공합니다. MT4 버전 보기:   Volumetric Order Blocks MT4 Multi Timeframe See more products at:   https://www.mql5.com
Special offer : ALL TOOLS , just $35 each! New tools   will be   $30   for the   first week   or the   first 3 purchases !  Trading Tools Channel on MQL5 : Join my MQL5 channel to update the latest news from me 삼중 반전 패턴 지표 는 트레이더들에게 강력한 도구를 제공하여 가격 차트에 삼중 반전 패턴을 자동으로 식별하고 강조 표시합니다. 이 지표는 잠재적인 트렌드 반전을 탐지하는 데 유용하며, 통합된 트렌드 지표를 통해 신호 정확도를 향상시킬 수 있습니다. MT5 버전 보기: Three Bar Reversal Pattern MT5 다른 제품 보기:   모든 제품 주요 특징 자동 패턴 감지: 이 지표는 삼중 반전 패턴을 스캔하며, 명확한 시각적 신호로 표시하여 잠재적인 트렌드 반전 포인트를 인식하는 데 도움을 줍니다.
스페셜 오퍼 : ALL TOOLS , 각 $35 에 구매 가능! New tools   will be   $30   for the   first week   or the   first 3 purchases !  Trading Tools Channel on MQL5 : Join my MQL5 channel to update the latest news from me 변동성이 큰 트레이딩 환경에서 강력하고 직관적인 분석 도구는 신속하게 기회를 포착하는 데 도움이 됩니다. Fibonacci Trend Scanner는 전통적인 피보나치(Fibonacci) 지표 기능과 SuperTrend를 통합할 뿐만 아니라, 통화쌍 스캔, 멀티 타임프레임 모니터링, 그리고 추세가 상승세에서 하락세로(또는 반대로) 전환될 때 인텔리전트 알림을 제공하도록 기능을 확장하였습니다. See more MT5 version at:   Fibonacci Trend MT5 Scanner See more products a
Special offer : ALL TOOLS , just $35 each! New tools   will be   $30   for the   first week   or the   first 3 purchases !  Trading Tools Channel on MQL5 : Join my MQL5 channel to update the latest news from me Kalman Trend Levels 는 최첨단 칼만 필터 기술을 활용하여 강력한 분석 신호를 제공하는 고급 추세 추적 지표입니다. 정확성과 적응성을 위해 설계된 이 도구는 중요한 지지 및 저항 영역을 식별할 뿐만 아니라 시장의 모멘텀 및 추세 변화를 분석하는 종합적인 접근 방식을 제공합니다. MT4 버전 보기:  Kalman Trend Levels MT4 다른 제품 보기:   All Products See more detailed explanation of Kalman Filter logic in this in
Special offer : ALL TOOLS , just $35 each! New tools   will be   $30   for the   first week   or the   first 3 purchases !  Trading Tools Channel on MQL5 : Join my MQL5 channel to update the latest news from me 뛰어난 기능부터 시작해 보겠습니다. EA에는 뉴스 필터와 RSI 필터가 장착되어 있습니다. 낮은 위험(일부 통화 쌍은 10% 미만, 심지어 5%의 하락률을 보입니다). 이 EA는 마팅게일이나 그리드 기능을 사용하지 않습니다. EA는 원하는 경우 수동 거래를 위한 시각적 영역을 표시할 수 있습니다. 우선, EA를 완전히 이해하려면 링크에서 자세한 지침을 읽어보세요. 스캘핑 EA 브레이크아웃 탑 및 봇 MT5에 대한 자세한 소개 이 EA가 도움이 되는지 여부를 결정하기 전에 데모를 다운로드하여 확인하십시오. Sca
Special offer : ALL TOOLS , just $35 each! New tools   will be   $30   for the   first week   or the   first 3 purchases !  Trading Tools Channel on MQL5 : Join my MQL5 channel to update the latest news from me Trendlines with Breaks Scanner 는 트레이더가 중요한 트렌드를 식별하고 실시간으로 돌파를 감지하도록 설계된 첨단 거래 도구입니다. 피벗 포인트를 기반으로 자동 생성된 추세선을 사용하여 이 지표는 트레이더가 정밀하고 자신 있게 거래 기회를 포착할 수 있도록 돕습니다. MT5 버전 보기:  Trendlines with Breaks Scanner MT5 다른 제품 보기:   All Products 주요 기능 1. 실시간 돌파 감지 돌파 알림: 가격이 추세선을 돌파하면 즉시 알림을 받습니다. 통
Special offer : ALL TOOLS , just $35 each! New tools   will be   $30   for the   first week   or the   first 3 purchases !  Trading Tools Channel on MQL5 : Join my MQL5 channel to update the latest news from me 선형 회귀 채널 지표 는 가격 추세와 잠재적인 반전 지점을 포착하는 데 도움을 주는 강력한 기술적 분석 도구입니다. 선형 회귀 채널, 밴드 및 미래 예측을 계산하여 시장 역학에 대한 깊은 통찰력을 제공합니다. 이 지표는 과매수 및 과매도 상태, 추세 방향을 식별하는 데 도움을 주며, 향후 가격 움직임에 대한 명확한 시각적 신호를 제공합니다. MT5 버전은 여기를 참조하십시오:   Linear Regression Channel  MT5 See more products at:   https://www.mql5.co
AI Channels MT5
Duc Hoan Nguyen
5 (1)
Special offer : ALL TOOLS , just $35 each! New tools   will be   $30   for the   first week   or the   first 3 purchases !  Trading Tools Channel on MQL5 : Join my MQL5 channel to update the latest news from me AI Channels 지표는 클러스터링 분석의 강력한 머신 러닝 기술인 롤링 K-평균 클러스터링 을 활용하여 실시간으로 기초 가격 트렌드에 대한 통찰을 제공합니다. 이 지표는 클러스터링된 가격 데이터를 기반으로 적응형 채널을 생성하여, 트레이더가 트렌드 방향과 시장 상황에 대한 정보를 바탕으로 결정을 내릴 수 있도록 합니다. 지표 설정에는 트레일링 스탑 옵션 도 포함되어 있어 리스크 관리에 추가적인 유연성을 제공합니다. MT4 버전 보기:   AI Channels MT4 다른 제품 보기:     모든 제품 AI
FREE
Follow Line MT4 with Scanner
Duc Hoan Nguyen
2.33 (3)
Special offer : ALL TOOLS , just $35 each! New tools   will be   $30   for the   first week   or the   first 3 purchases !  Trading Tools Channel on MQL5 : Join my MQL5 channel to update the latest news from me Follow Line 와 스캐너로 거래에서 앞서 나가세요. 이 고급 변동성 기반 지표는 진지한 트레이더를 위해 설계되었습니다. 이 도구는 Bollinger 밴드의 강력한 기능과 맞춤 설정을 결합하여 가격 움직임에 대한 정확한 통찰력을 제공합니다. See more MT5 version at:   Follow Line MT5 with Scanner See more products at:   https://www.mql5.com/en/users/ndhsfy/seller Follow Line의 핵심은 가격이 1 표준
FREE
RSI Divergence MT5 Scanner
Duc Hoan Nguyen
3.33 (3)
Special offer : ALL TOOLS , just $35 each! New tools   will be   $30   for the   first week   or the   first 3 purchases !  Trading Tools Channel on MQL5 : Join my MQL5 channel to update the latest news from me 역동적인 금융 시장에서 추세 반전 신호를 식별하는 것은 효과적인 거래에 필수적입니다. RSI Divergence Scanner는 다양한 통화 쌍과 시간대에서 RSI 다이버전스 신호를 정확하고 효율적으로 감지하도록 설계되었습니다. MT4 버전 자세히 보기:    RSI Divergence MT4 Scanner 더 많은 제품 보기:   모든 제품 1. RSI 다이버전스 이해하기 RSI (상대 강도 지수) 는 가격 모멘텀을 측정하는 기술 지표로, 트레이더들 사이에서 널리 사용됩니다. RSI 다이버전스는 가격 움직임과
FREE
SMC System MT5
Duc Hoan Nguyen
Special offer : ALL TOOLS , just $35 each! New tools   will be   $30   for the   first week   or the   first 3 purchases !  Trading Tools Channel on MQL5 : Join my MQL5 channel to update the latest news from me SMC 는 유동성 영역, 기관 주문 위치, 그리고 시장의 주요 전환점을 식별하는 데 도움을 주는 거래 접근 방식입니다. SMC 원칙을 활용하면 트레이더는 시장을 더 효과적으로 탐색하고 최적의 진입 및 종료 지점을 찾을 수 있습니다. SMC System  지표는 이러한 개념을 자동화하여 아래와 같은 주요 가격 행동 요소로 차트를 빠르게 표시할 수 있게 해줍니다: 실시간 시장 구조  (내부 및 스윙 BOS / CHoCH) 주문 블록  (강세 및 약세) 프리미엄 및 할인 영역 동일 고점 및 동일 저점 공정 가치 갭(
Special offer : ALL TOOLS , just $35 each! New tools   will be   $30   for the   first week   or the   first 3 purchases !  Trading Tools Channel on MQL5 : Join my MQL5 channel to update the latest news from me Fibonacci Confluence Toolkit Multi-Timeframe 은(는) 전문 트레이더를 위해 설계된 고급 기술적 분석 도구로, 주요 시장 신호와 패턴을 결합하여 잠재적인 가격 반전 영역을 식별하는 데 도움을 줍니다. 타임프레임 선택기 대시보드를 통한 다중 타임프레임 표시 기능을 갖춘 이 툴킷은 시장 역학에 대한 포괄적이고 통찰력 있는 시각을 제공하여 정확하고 시기적절한 거래 결정을 내릴 수 있게 합니다. MT5 버전 더 보기:  Fibonacci Confluence Toolkit MT5 Mul
AI Channels MT4
Duc Hoan Nguyen
5 (1)
Special offer : ALL TOOLS , just $35 each! New tools   will be   $30   for the   first week   or the   first 3 purchases !  Trading Tools Channel on MQL5 : Join my MQL5 channel to update the latest news from me AI Channels 지표는 클러스터링 분석의 강력한 머신 러닝 기술인 롤링 K-평균 클러스터링 을 활용하여 실시간으로 기초 가격 트렌드에 대한 통찰을 제공합니다. 이 지표는 클러스터링된 가격 데이터를 기반으로 적응형 채널을 생성하여, 트레이더가 트렌드 방향과 시장 상황에 대한 정보를 바탕으로 결정을 내릴 수 있도록 합니다. 지표 설정에는 트레일링 스탑 옵션 도 포함되어 있어 리스크 관리에 추가적인 유연성을 제공합니다. MT5 버전 보기:     AI Channels MT5 다른 제품 보기:     모든 제품
FREE
Special offer : ALL TOOLS , just $35 each! New tools   will be   $30   for the   first week   or the   first 3 purchases !  Trading Tools Channel on MQL5 : Join my MQL5 channel to update the latest news from me SuperTrend by Kivanc Ozbilgic with Scanner 를 소개합니다 – 시장 트렌드를 앞서기 위해 설계된 다기능 강력한 도구로, 사용자 맞춤형 기능과 실시간 알림을 제공합니다. ATR 계산 방법을 RMA (상대 이동 평균)와 SMA (단순 이동 평균) 중에서 선택하여 최대한의 유연성을 제공할 수 있습니다. 기본 설정으로 ATR 기간은 10, 배수는 3으로 설정되어 있으며, SuperTrend 는 매수 및 매도 신호를 효율적으로 감지합니다. 내장된 스캐너와 알림 시스템은 여러 통화 쌍과 시
FREE
RSI Divergence MT4 Scanner
Duc Hoan Nguyen
5 (3)
Special offer : ALL TOOLS , just $35 each! New tools   will be   $30   for the   first week   or the   first 3 purchases !  Trading Tools Channel on MQL5 : Join my MQL5 channel to update the latest news from me 역동적인 금융 시장에서 추세 반전 신호를 식별하는 것은 효과적인 거래에 필수적입니다. RSI Divergence Scanner는 다양한 통화 쌍과 시간대에서 RSI 다이버전스 신호를 정확하고 효율적으로 감지하도록 설계되었습니다. MT5 버전 자세히 보기:    RSI Divergence MT5 Scanner 더 많은 제품 보기:   모든 제품 1. RSI 다이버전스 이해하기 RSI (상대 강도 지수) 는 가격 모멘텀을 측정하는 기술 지표로, 트레이더들 사이에서 널리 사용됩니다. RSI 다이버전스는 가격 움직임과
FREE
Special offer : ALL TOOLS , just $35 each! New tools   will be   $30   for the   first week   or the   first 3 purchases !  Trading Tools Channel on MQL5 : Join my MQL5 channel to update the latest news from me 끊임없이 변화하는 금융 거래 환경에서 지원 및 저항 수준을 정확하게 식별하고 분석하는 것은 정보에 입각한 투자 결정을 내리는 데 필수적입니다. SnR Retest and Break Multi-Timeframe , 거래 분석을 향상시키기 위해 설계된 지원 및 저항 지표입니다. 혁신적인 Timeframe Selector 기능을 활용하여 이 도구는 여러 시간대에 걸친 시장 동향에 대한 포괄적인 보기를 제공하고, 정확한 거래 선택을 돕습니다. 더 많은 MT4 버전 보기:  SnR Retest and Break MT4
OA SnR Power MT4
Duc Hoan Nguyen
Special offer : ALL TOOLS , just $35 each! New tools   will be   $30   for the   first week   or the   first 3 purchases !  Trading Tools Channel on MQL5 : Join my MQL5 channel to update the latest news from me 개요 OA SnR Power는 트레이더가 지지와 저항 레벨의 강도를 식별하고 평가하도록 설계된 강력한 도구입니다. 거래량, 반등 빈도 및 재테스트 횟수와 같은 주요 요소를 통합하여 이 지표는 시장의 주요 가격 영역에 대한 종합적인 뷰를 제공합니다. 더 많은 제품 보기:   모든 제품 OA SnR Power의 작동 원리 고점과 저점 식별 이 지표는 지역 고점과 저점을 계산하기 위해 지능형 알고리즘을 사용합니다. 사용자는 영역 폭 설정을 조정하여 잠재적인 지지 및 저항 수준을 정확하게 탐지할 수 있습니다. 주요
FREE
Special offer : ALL TOOLS , just $35 each! New tools   will be   $30   for the   first week   or the   first 3 purchases !  Trading Tools Channel on MQL5 : Join my MQL5 channel to update the latest news from me MT5용 혁신적인 RSI Kernel Optimized with Scanner를 소개합니다. 이 최첨단 도구는 강력한 커널 밀도 추정(KDE) 알고리즘을 통합하여 전통적인 RSI 분석을 재정의합니다. 이 고급 지표는 실시간으로 시장 트렌드에 대한 인사이트를 제공할 뿐만 아니라, 여러 통화쌍과 시간 프레임을 동시에 스캔할 수 있는 대시보드를 포함하고 있습니다. 이 도구가 당신의 거래 도구 상자에 필수적인 이유를 살펴보겠습니다. See more MT4 version at:  RSI Kernel Optimized M
필터:
리뷰 없음
리뷰 답변