Volume Zones Internal Visualizer MT5 Multi TF

特別オファー: ALL TOOLS 、各$35で提供中!

New tools will be $30 for the first week or the first 3 purchases

Trading Tools Channel on MQL5: Join my MQL5 channel to update the latest news from me

Volume Zones Internal Visualizer Multi-Timeframe は、上位足チャートを見ながら下位足のボリューム動向を詳細に把握するための最適なソリューションです。マルチタイムフレーム機能をサポートし、強力かつ直感的にボリューム分析を行いたい方には最適です!

MT4バージョンはこちら:  Volume Zones Internal Visualizer MT4 Multi TF

その他の製品はこちら:  All Products

Why Choose Volume Zones Internal Visualizer Multi-Timeframe?
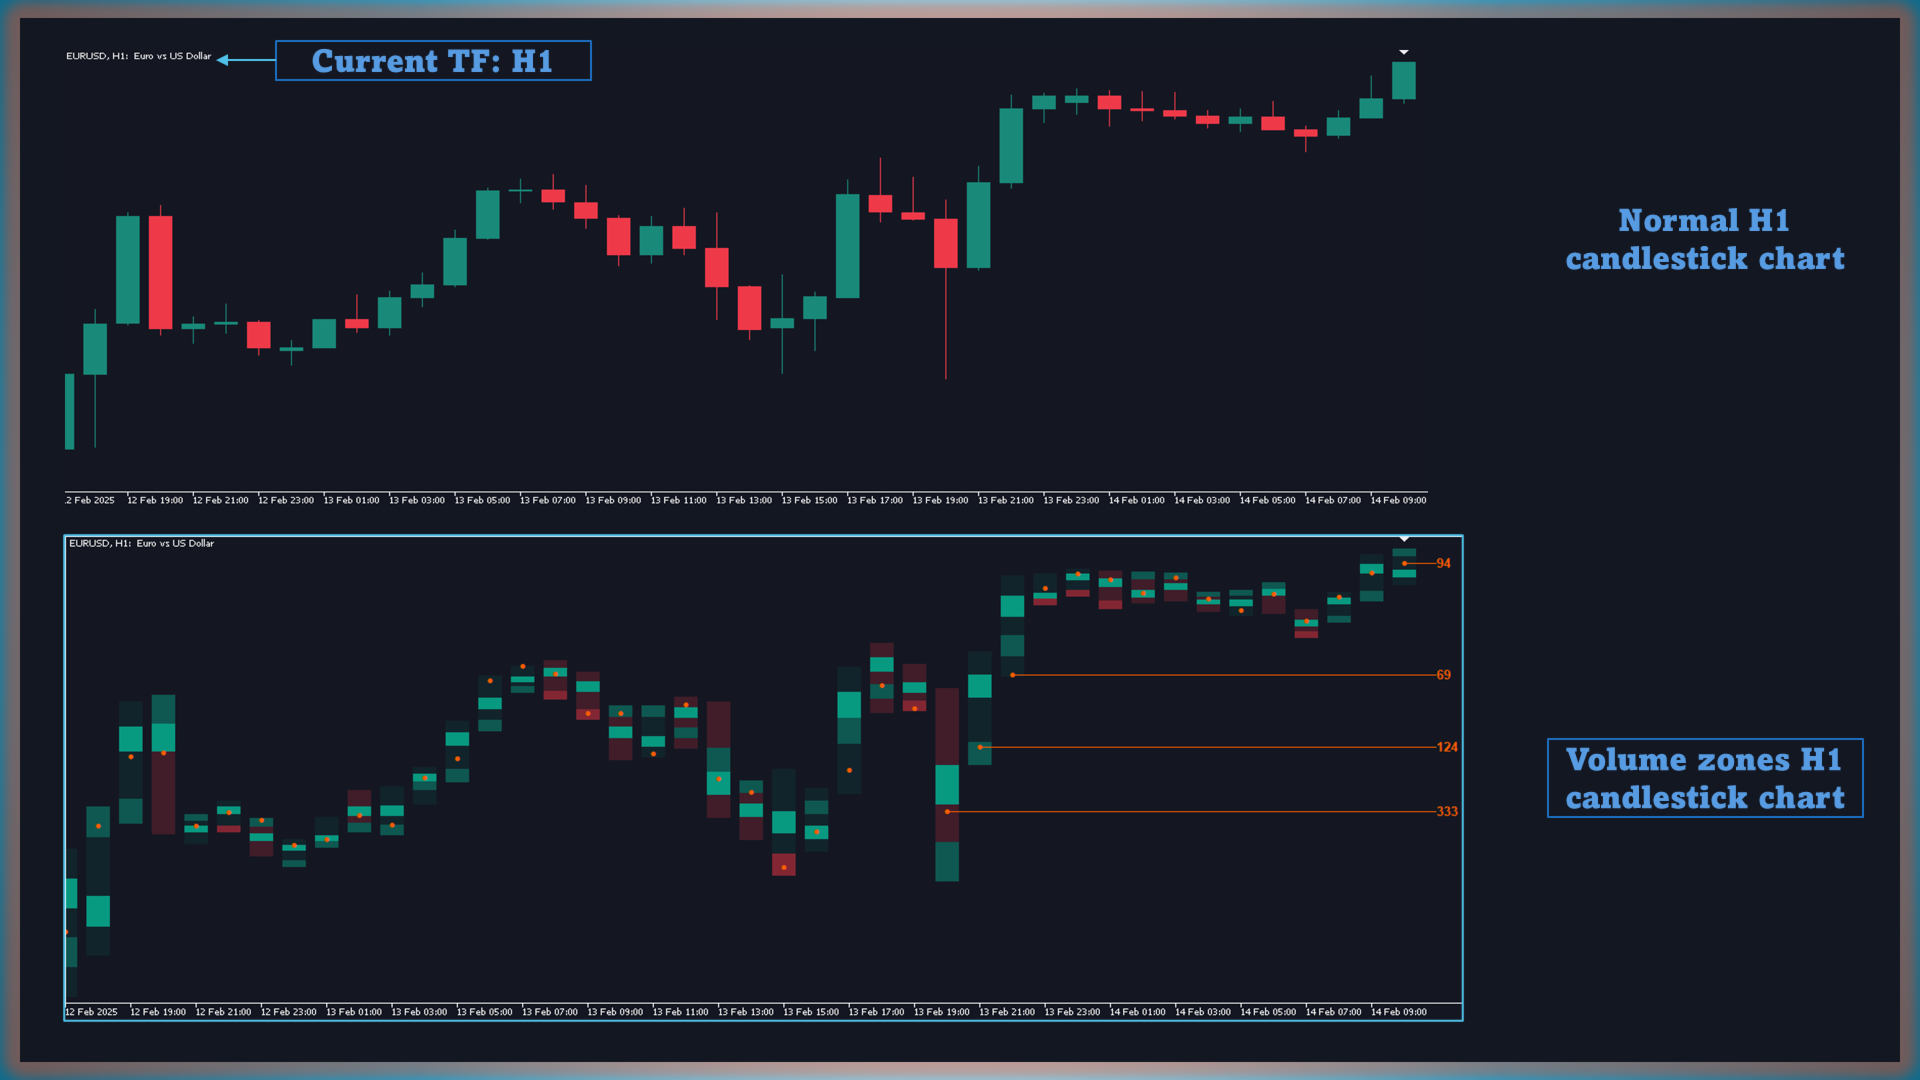
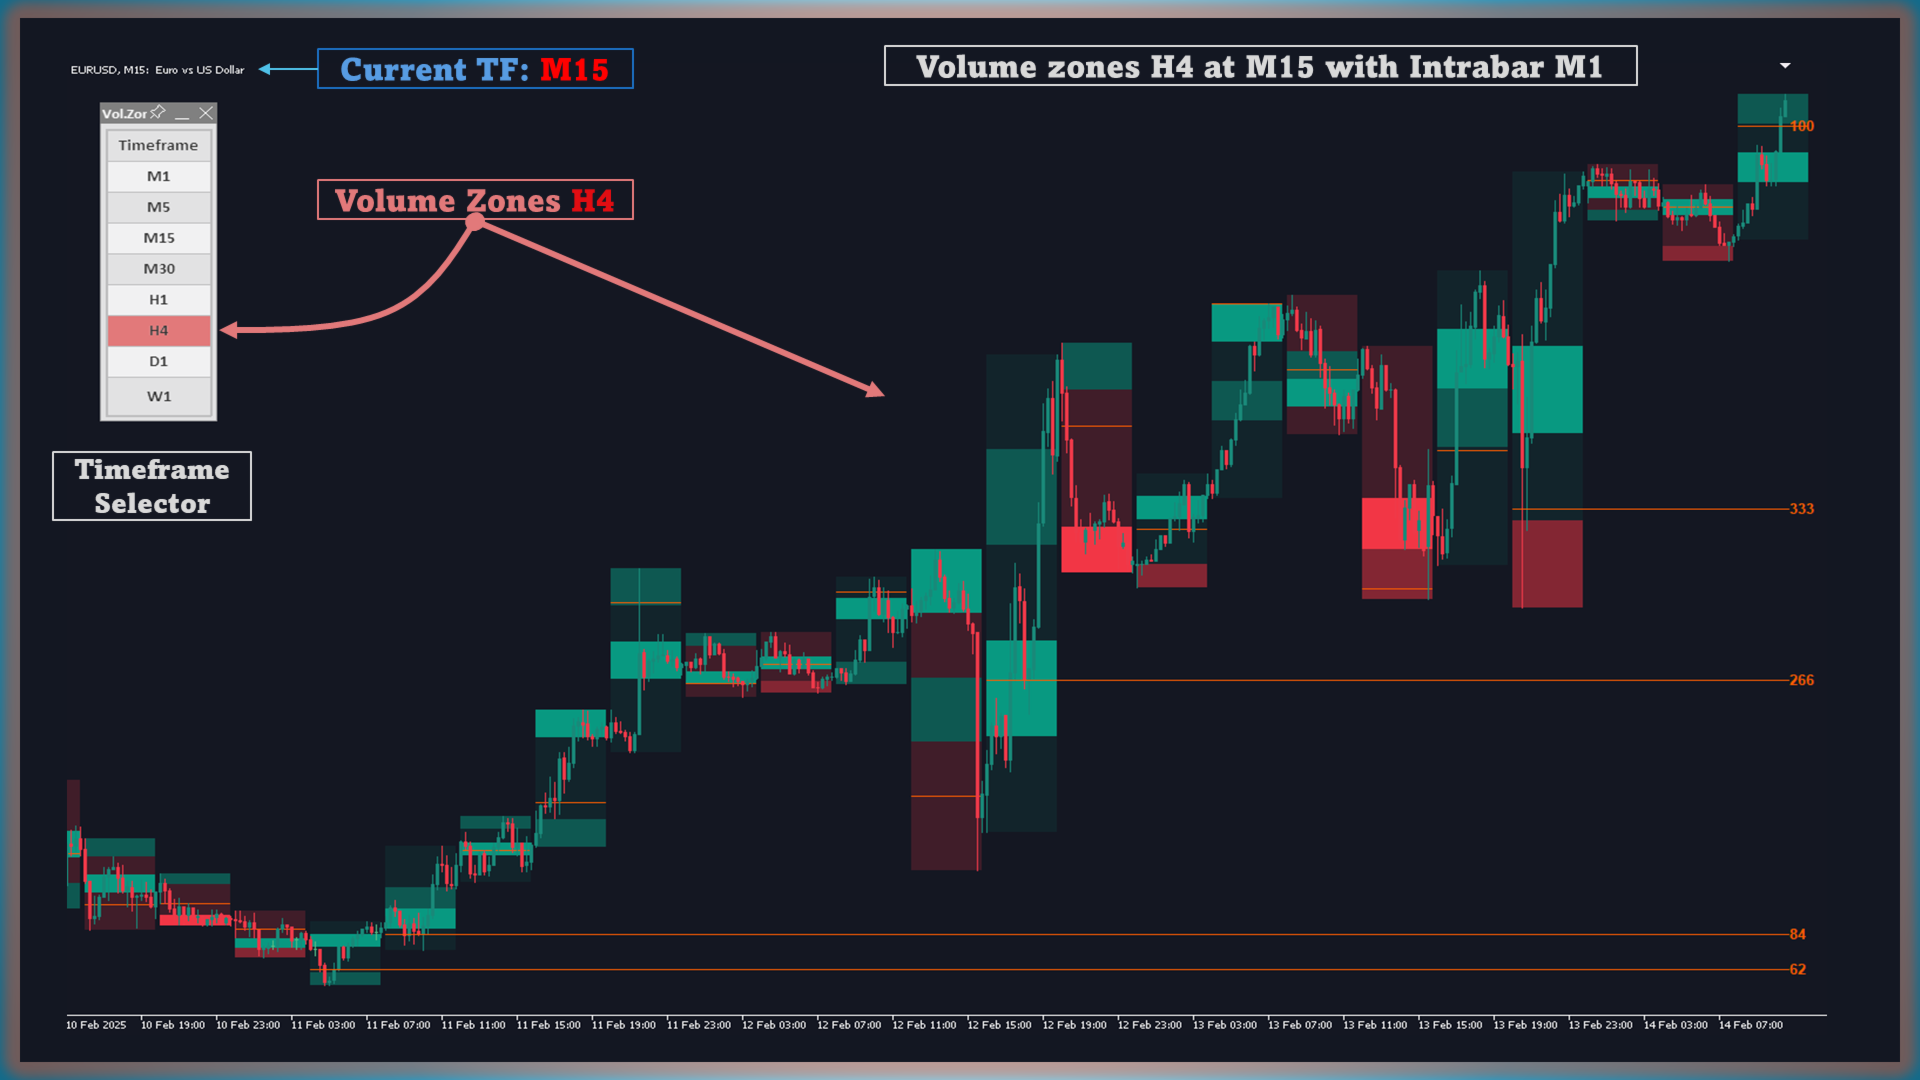
  1. 上位足チャートに下位足のボリュームを表示

    • 本インジケーターは “alternate candle” スタイルを提供しており、上位足のチャートから離れずに下位足のボリュームが集中する場所を素早く確認できます。
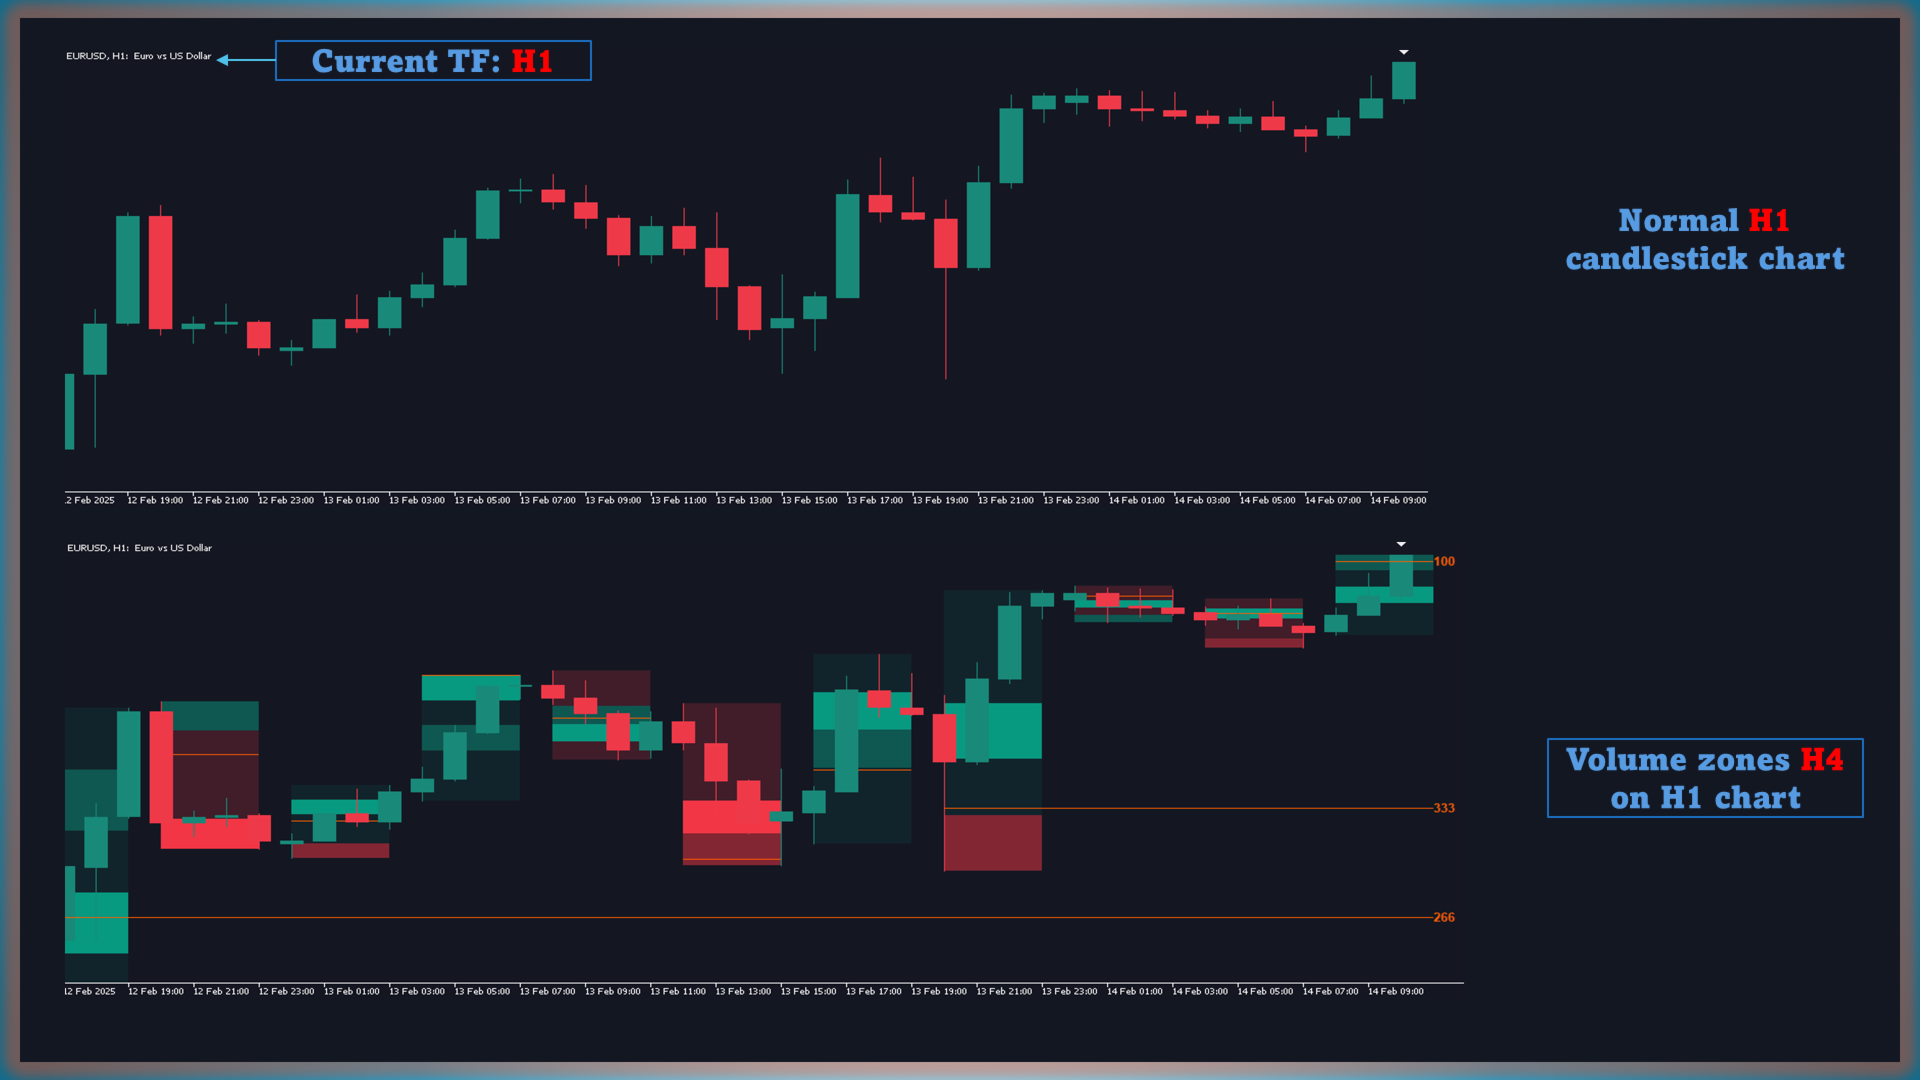
  2. マルチタイムフレーム分析

    • Intrabar Timeframe 機能により、監視したい下位足 (M1, M5, M15 など) を選択できます。下位足のボリュームデータがすべて集計され、各上位足のローソク足セッション内に表示されます。
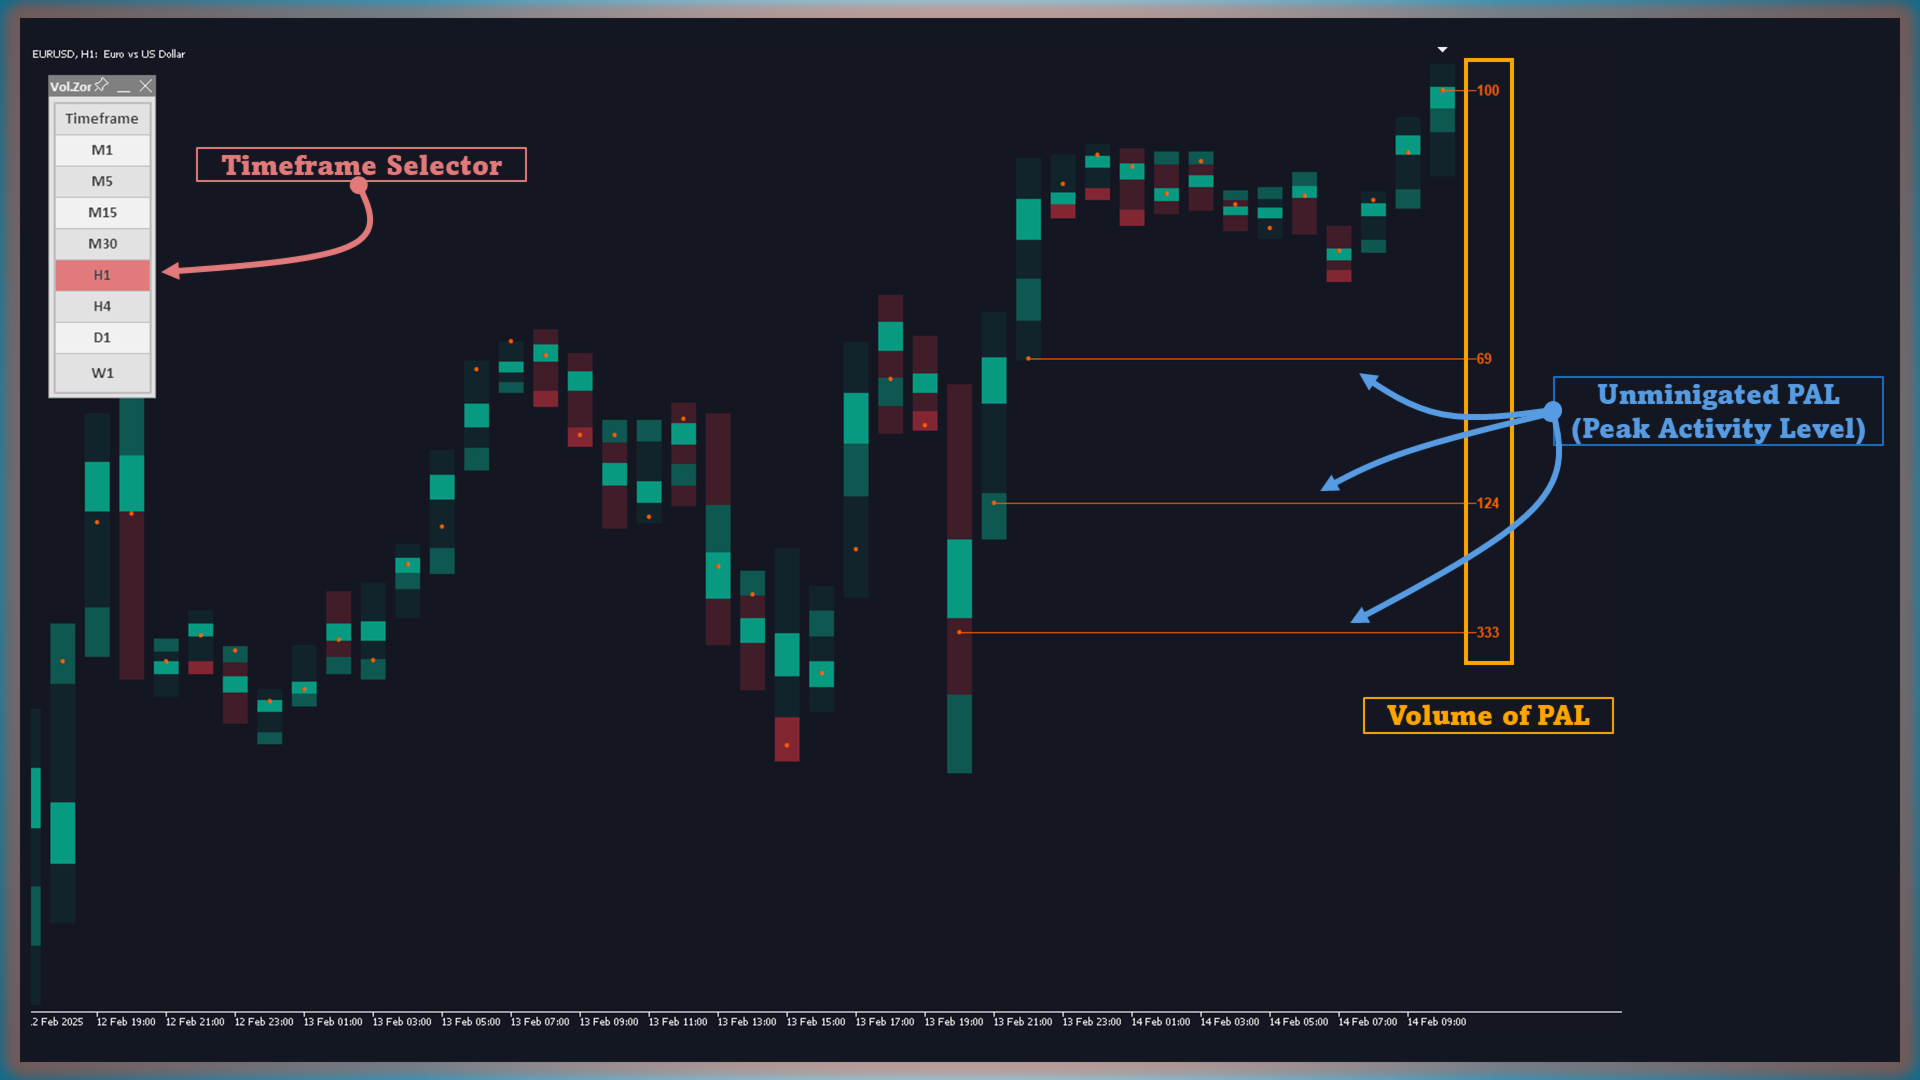
    • Timeframe Selector 機能を使えば、どの上位足のボリュームゾーンをどのタイムフレームで表示するかを簡単に設定できます。例として、M15チャート上にH4のボリュームゾーンを表示し、さらにIntrabar M1を組み合わせるなどが可能です(詳細はスクリーンショットを参照)
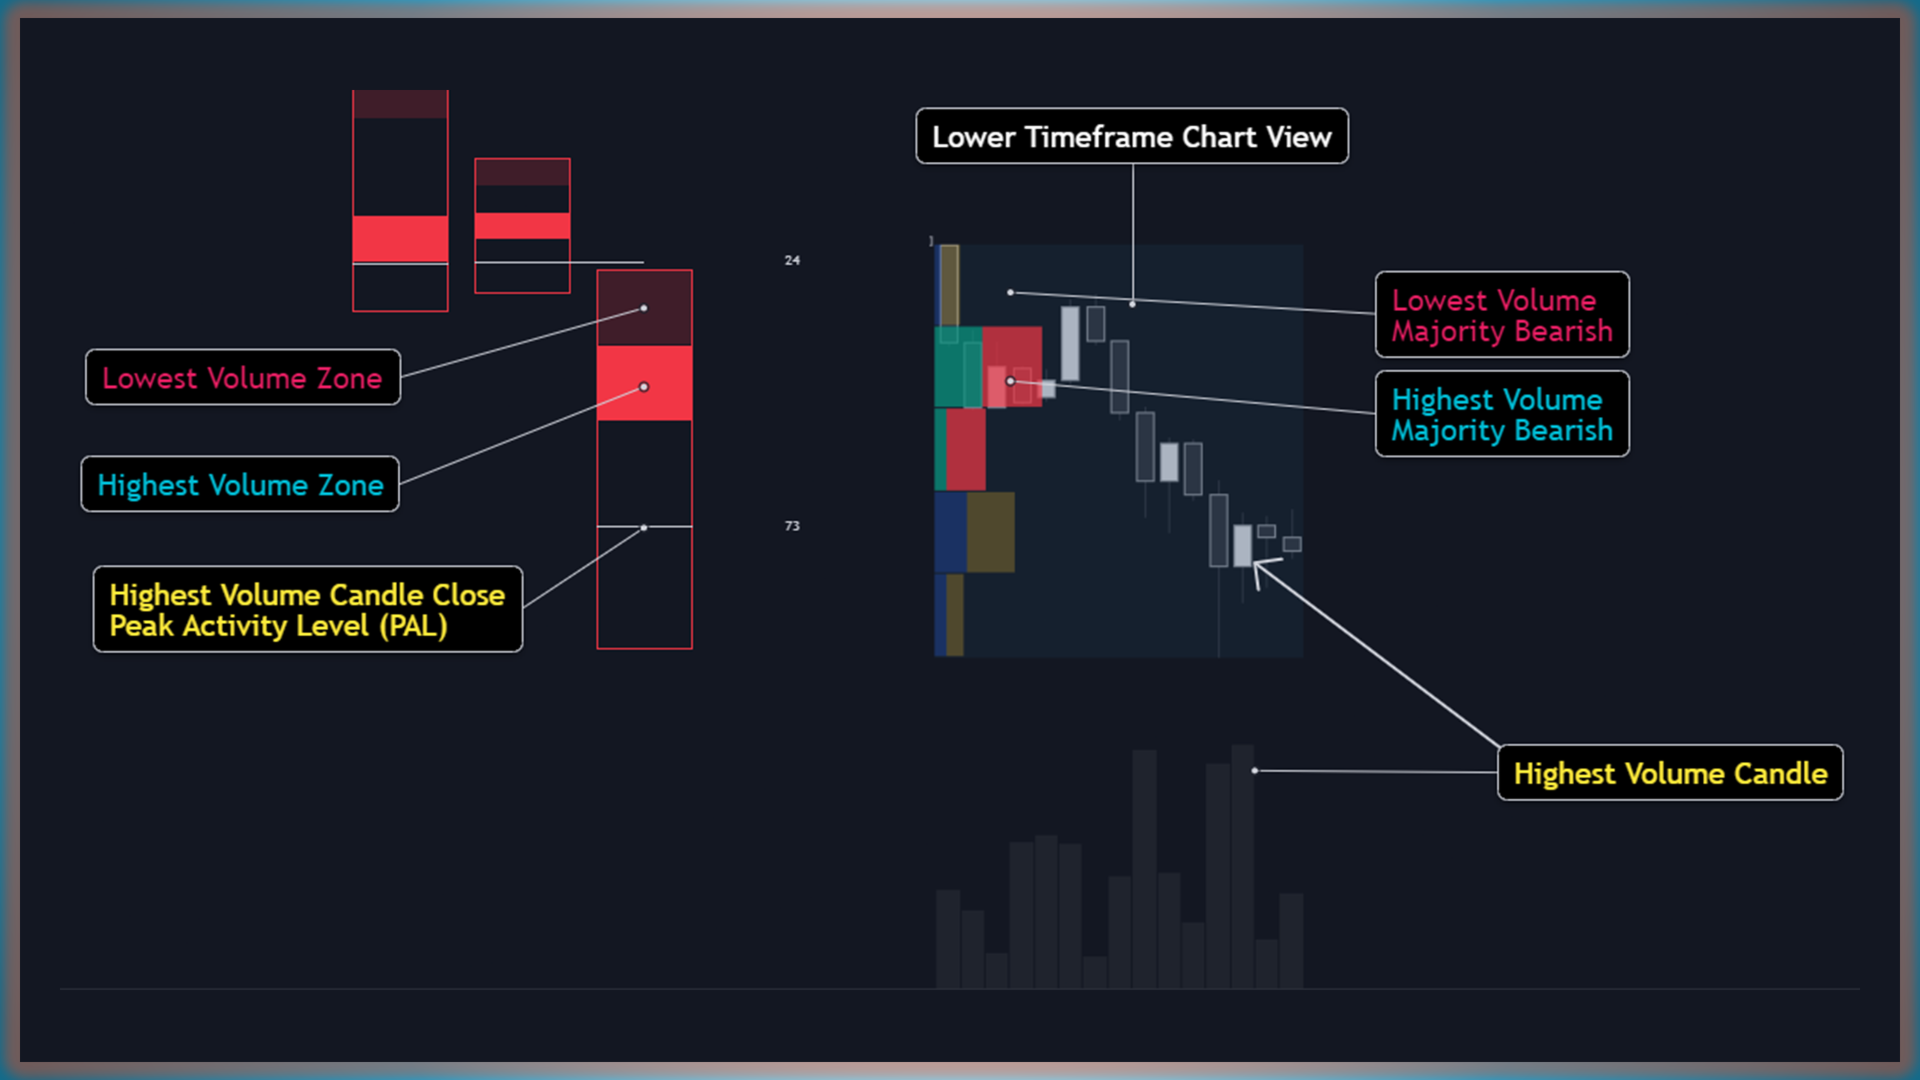
  3. “Peak Activity Level” (PAL) の検出

    • インジケーターは自動的に、最もボリュームが大きい下位足のローソク足を特定します。そのローソク足の終値が PAL としてマークされ、上位足ローソク足セッション内で最もボリュームが集中した重要レベルとなります。
    • 各PALは将来の価格動向に向かって延長され、“ブレイク”または“解消”されるまで残り、エントリーエグジットの可能性を示唆します。
  4. 最高ボリュームゾーンと最低ボリュームゾーンの特定

    • 下位足のデータをもとに Volume Profile を構築し、インジケーターは2つの重要領域をピンポイントで示します。
      • Highest Volume Zone: ボリュームが最も集中している領域を表します。
      • Lowest Volume Zone: 比較的低い(しかし依然として重要な)ボリュームが集まった領域を示します。
How to Use
  1. Intrabar Timeframe の設定

    • ご自身のトレードスタイルに合わせて、追跡したい下位足 (M1, M5, M15 など) を選択します。
  2. マルチタイムフレームの設定

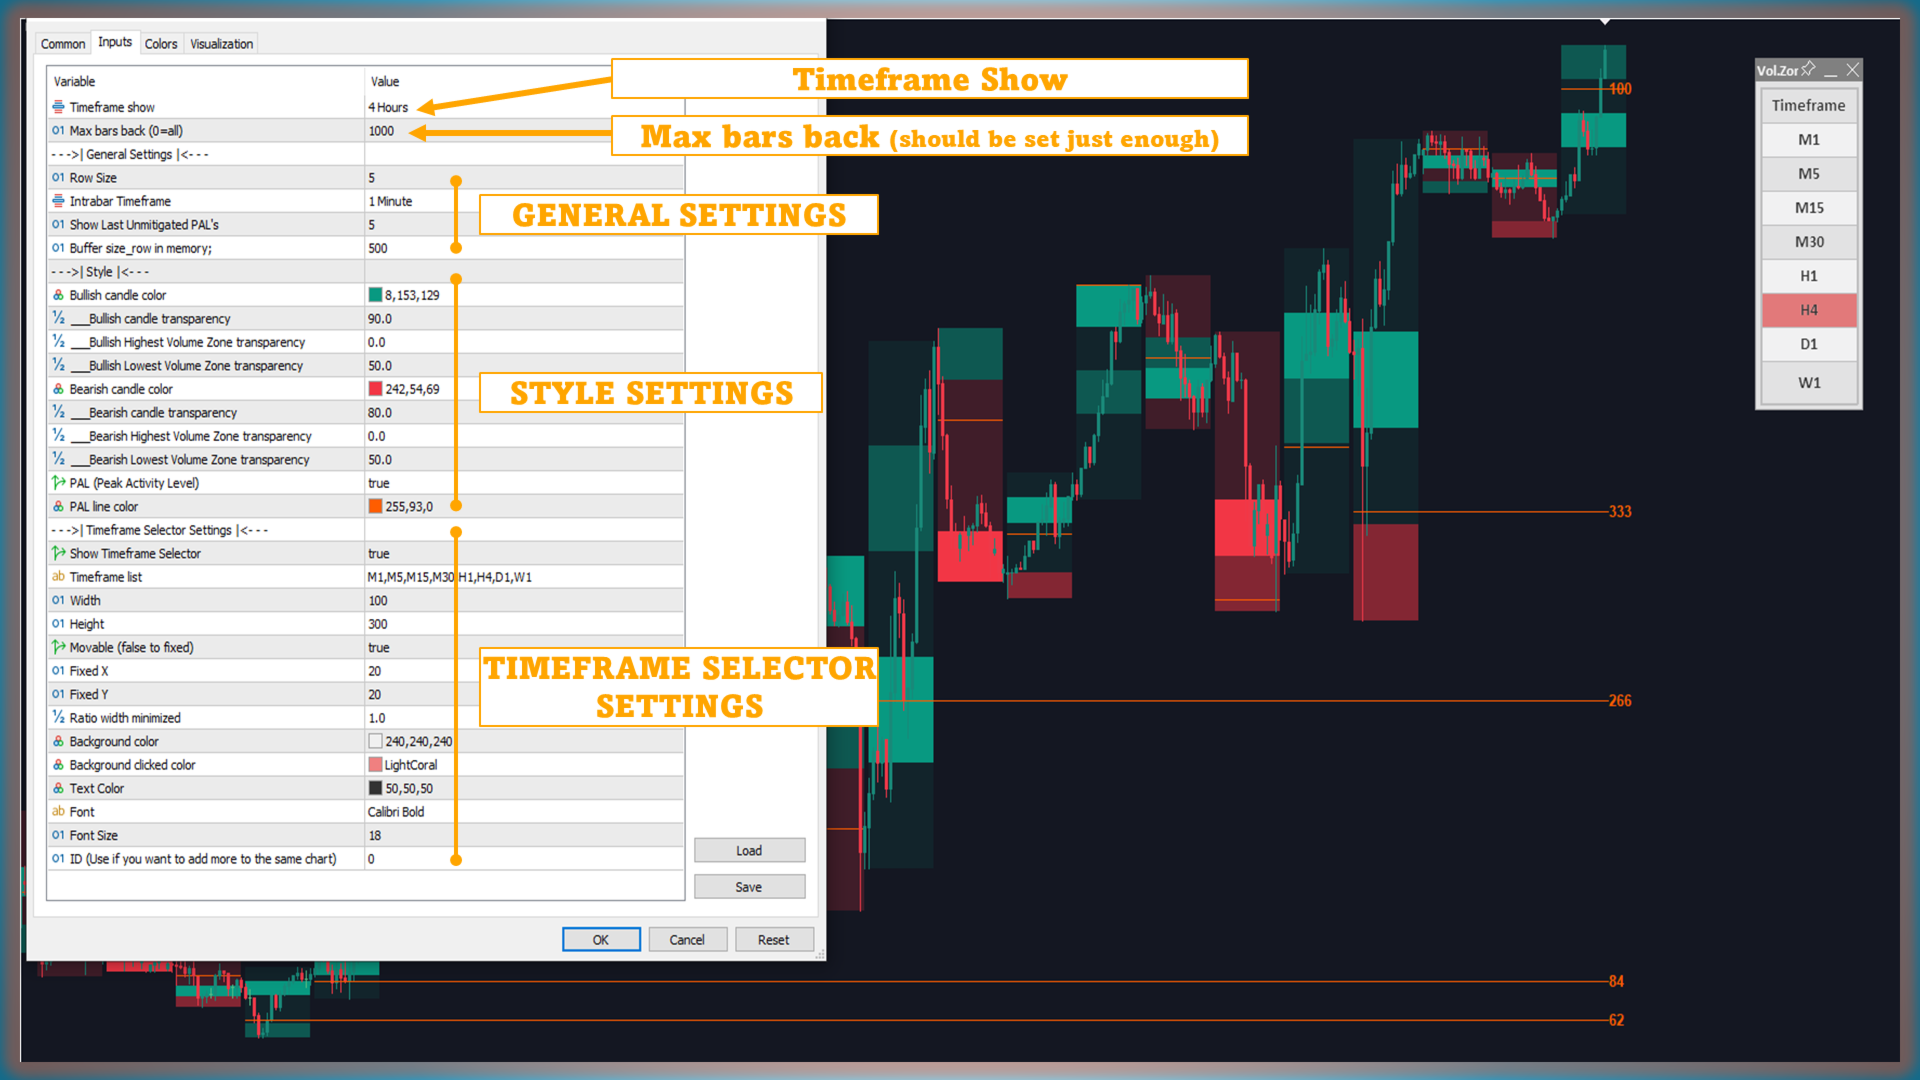
    • "Timeframe Show" パラメータを使って表示したいボリュームゾーンのタイムフレームを指定するか、Timeframe Selector を使用して、状況に応じて異なるタイムフレームのボリュームゾーンを柔軟に表示/非表示にできます。
  3. 表示内容の解釈

    • Box: 上位足のローソク足の高値から安値までの範囲を示します。
    • Lowest Volume Zone: ローソク足セッション内でボリュームの最も低い領域を強調表示します。
    • Highest Volume Zone: ボリュームが最も高い領域を示し、主要なアクティビティを把握するのに重要です。
    • Line/dot: ボリュームが最も大きかった下位足のローソク足の終値(PAL)を表します。
  4. PAL を監視し、対応する

    • PALラインは今後の価格変動に投影され、動的なサポートやレジスタンスとして機能することがよくあります。
    • PAL が“ブレイク”または“解消”された場合、そのラインは自動的に消去され、チャートが整理されます。
Technical Details
  • “Row Size” を使用した Volume Profile

    • 下位足のボリュームを集約してボリュームプロファイルを構築します。“Row Size”を大きくすると、ボリューム分布をより細かく表示できます。
  • 自動的に高ボリュームゾーンと低ボリュームゾーンを検出

    • ボリュームプロファイルを構築した後、インジケーターは最もボリュームの高いゾーン(実線)と、比較的低いボリュームのゾーン(半透明)を自動的に強調表示します。
  • スケーラブルかつカスタマイズ可能

    • Show Last Unmitigated PALs: まだブレイクされていないPALをいくつ表示するかを設定できます。
    • Style & Colors: ゾーンやラインの表示、カラー設定などを好みに合わせて調整可能です。
Settings
  1. Row Size

    • 下位足データからボリュームプロファイルを作成する際に使用する行数を定義します。
  2. Intrabar Timeframe

    • インジケーターが参照すべき下位足(例:M1、M5、M15)を選択します。
  3. Show Last Unmitigated PALs

    • チャート上に残す、未ブレイクのPALラインの数を選択します。
  4. Style

    • インジケーターの各種機能のオン/オフや、色・透明度などをカスタマイズします。
  5. Multi-Timeframe
    • 表示する上位足のタイムフレームを指定
    • Timeframe Selector の設定

Conclusion

Volume Zones Internal Visualizer Multi-Timeframe を使えば、市場のボリュームを新たな視点からとらえ、重要ゾーンを正確に把握できます。上位足のセッション内に下位足のボリュームデータを組み込む機能により、時間を節約し、トレード判断の精度を高めることができます。

おすすめのプロダクト
Multi-timeframe trend indicator based on the ADX / ADXWilder indicator with Fibonacci levels The indicator shows trend areas using ADX or ADXWilder indicator data from multiple timeframes. The impulse mode of the indicator allows you to catch the beginning of a trend, and several "Screens" with different timeframes allow you to filter out market noise. Fibonacci levels are added to the price chart, which have flexible settings. How the indicator works: if PDI is greater than NDI, then   it`s
FREE
Raymond Cloudy Day Indicator for MT5 – Pivot-Based Reversal and Trend Levels Raymond Cloudy Day Indicator is a pivot-based level indicator for MetaTrader 5 (MT5). It was developed by Ngo The Hung based on Raymond’s original idea and is designed to give a structured view of potential reversal zones, trend extensions and support/resistance levels directly on the chart. The default settings are optimised for XAUUSD on the H1 timeframe, but the indicator can be tested and adjusted for other symbols
FREE
This indicator, "Phoenix Volume Amazing", is a sophisticated Volume Delta and Order Flow Dashboard. Unlike standard volume indicators that only show total activity, this tool dissects the internal "tug-of-war" between buyers and sellers in real-time. Core Functionality The indicator calculates Delta (the difference between buying volume and selling volume) to provide a "under the hood" look at market sentiment. It uses a custom-built GUI (Graphical User Interface) panel to display these metrics
FREE
Swiss VWAPsimple
Terence Gronowski
4.8 (5)
Swiss VWAPsimple Motivation Did not find free VWAP that works, the one that I found craseh. So I created a VWAP which calculates values only for the actual day. So computer resouces are not over stressed. What is VWAP, how is it used?  VWAP stands for Volume Weighed Average Price, it calculates the running sum of tick volume and the runnung sum of price times tickvolume. The division of these sums result in a weighed price (Sum P*V/Sum V). The calculation starts normally at midnight. The values
FREE
Indicator Description 4 Hull MA Color + Envelopes is a powerful trend-following indicator for MetaTrader 5 that combines four Hull Moving Averages (HMA) with Moving Average Envelopes to clearly identify market direction, trend strength, and potential reversal or pullback zones. This indicator is designed to reduce noise, react quickly to price movement, and provide a clean visual structure for professional trading.   Key Features   4 Hull Moving Averages (20, 50, 100, 200) Automatic color change
FREE
Important Lines
Terence Gronowski
4.88 (24)
This indicator displays Pivot-Lines, preday high and low, preday close and the minimum and maximum of the previous hour. You just have to put this single indicator to the chart to have all these important lines, no need to setup many single indicators. Why certain lines are important Preday high and low : These are watched by traders who trade in a daily chart. Very often, if price climbs over or falls under a preday low/high there is an acceleration in buying/selling. It is a breakout out of a
FREE
This is a free version of the indicator, the period between the vertical lines is always 30 bars. In the paid version the period can be set by user, so a configuration with many ThreePointsChannel indicators with different periods is possible. The principle of construction - on top of any number of bars set by the user, a channel is constructed with maximum and minimum lines so that the bars touch the maximum and minimum of the channel at exactly three points. The name of the indicator follows
FREE
Trend indicator based on the ADX / ADXWilder indicator The indicator shows trend areas using ADX or ADXWilder indicator data. How the indicator works: if PDI is greater than NDI, then it`s bullish movement; if PDI is less than NDI, then it`s bearish movement; if ADX is less than or equal to the filter value specified in the parameters, then there is no movement state. Input parameters of the indicator: Calculate Timeframe - timeframe for calculation; ADX Type - type of ADX calculation based
FREE
The indicator identifies when a divergence occurs between price and an indicator or oscillator. It identifies both regular and hidden divergences. Combined with your own rules and techniques, this indicator will allow you to create (or enhance) your own powerful system. For higher probability setups I can recommend you to use my Supply Demand indicator and trade only if the divergence occurs inside a zone. Supply zone for bearish div and demand zone for bullish div. The optimal scenario is if it
FREE
Follow The Line MT5
Oliver Gideon Amofa Appiah
4.6 (35)
This indicator obeys the popular maxim that: "THE TREND IS YOUR FRIEND" It paints a GREEN line for BUY and also paints a RED line for SELL. (you can change the colors). It gives alarms and alerts of all kinds. IT DOES NOT REPAINT and can be used for all currency pairs and timeframes. Yes, as easy and simple as that. Even a newbie can use it to make great and reliable trades. NB: For best results, get my other premium indicators for more powerful and reliable signals. Get them here: https://www.m
FREE
Support Resistance Channels - Trading Guide *** Group support:  https://www.mql5.com/en/channels/vuongphamtrading Overview The Support Resistance Channels indicator automatically identifies and displays the strongest support and resistance zones based on pivot points. Unlike simple horizontal lines, this indicator creates channels (zones) which better represent real market behavior where support and resistance act as areas rather than precise levels. Key Features Automatic Detection : Identifie
FREE
インディケータはチャート上にトレンドラインを描画します。このインジケーターには6つの入力があります。ユーザーは両方の行に代替ラベルを指定できます。インジケーターの複数のインスタンスが使用される場合、ラベルは異なっている必要があります。ユーザーは、線の幅と色、および使用する重要なピークを指定する深さを設定できます。たとえば、Depth = 10は、現在の山と谷を使用してトレンドラインを設定します。この山と谷は、左右に少なくとも10本のバーがあり、高/低がピークの高/低よりも小さい/大きいです。インジケーターは、以前の山と谷もペイントします。インジケーターには、価格がサポート/レジスタンスラインから事前に設定された距離にあるときにユーザーに通知するために使用できるアラート機能が追加されています。アラート距離はピップで設定されます。
FREE
Donchian Channel DC is the indicator of Donchian Channels, that plots maximum and minimum values of a specific period, besides mean value line. It´s possible to configure simple period for analysis and the indicator will plot all three values. You can trade with this indicator as trend or reversal, according to each strategy. Do not let to test others indicators as soon as others expert advisors.
English VWAP Daily (Clean) is a simple and lightweight indicator that plots the classic Daily VWAP (Volume Weighted Average Price) directly on your MT5 chart. Features: Classic Daily VWAP calculation Supports real volume (if available) or tick volume Timezone offset option to match your broker’s server time Weekend merge option (merge Saturday/Sunday data into Friday) Clean version → no arrows, no alerts, only VWAP line VWAP is widely used by institutional traders to identify fair value, su
FREE
Multi-timeframe trend indicator, based on the ADX / ADXWilder indicator The indicator shows trend areas using ADX or ADXWilder indicator data from multiple timeframes. The impulse mode of the indicator allows you to catch the beginning of a trend, and several "Screens" with different timeframes allow you to filter out market noise. How the indicator works: if PDI is greater than NDI, then it`s bullish movement; if PDI is less than NDI, then it`s bearish movement; to determine any trend, it is
FREE
Last Day Support & Resistance Platform: MetaTrader 5 Type: Custom Indicator Display: Chart Window (Overlay) Functions: Calculates Support and Resistance zones based on high/low patterns of the previous day. Uses a sliding sampling window ( SampleWindowSize ) to detect recent price ranges. Detects potential support if current price range is significantly below previous highs. Detects potential resistance if price range is significantly above previous lows. Updates four output buffers: LDResistanc
FREE
The SuperTrend Strategy is a widely-used technical indicator based on the Average True Range (ATR), primarily employed as a trailing stop tool to identify prevailing market trends. The indicator is designed for ease of use while providing reliable insights into the current market trend. It operates based on two key parameters: the period and the multiplier . By default, it uses a period of 15  for the ATR calculation and a multiplier of 3 . The Average True Range (ATR) plays a crucial role in th
FREE
Harmonic Pattern Suite Pro Introduction Harmonic Pattern Suite Pro is an indicator designed to identify and display harmonic structures on the chart based on X-A-B-C-D sequences. Its purpose is to present pattern formations that meet geometric and proportional criteria, providing a clear visual representation directly on the chart. The indicator automates the detection process, removing the need for manual measurement of ratios and allowing the user to review the structural configuration withou
FREE
The indicator draws daily support and resistance lines on the chart, as well as the Pivot level (reversal level). Adapted to work in MT5 The standard timeframe for calculating support and resistance levels is D1. You can choose other timeframes according to your strategy (for example, for M1-M15, the optimal timeframe for calculations is H1) The function for calculating support and resistance levels has been updated; in this calculation option, fibonacci levels are taken into account, respec
FREE
FVG Metrics
Kim Raphael Reitz
5 (1)
FVG Indicator (Current Timeframe Zones and Multi-Timeframe Count Panel) This indicator detects and draws Fair Value Gap zones on the current chart timeframe only. It also includes a multi-timeframe panel that shows how many active (unmitigated)  zones exist on selected timeframes. This indicator detects and draws Fair Value Gap zones on the current chart timeframe . It can also display a panel with the number of active zones on selected timeframes. The indicator shows bullish and bearish zone
FREE
Magic 7 Indicator
Marek Pawel Szczesny
5 (1)
Overview Magic 7 Indicator is a comprehensive MetaTrader 5 (MQL5) indicator that identifies seven different trading scenarios based on candlestick patterns and technical analysis. The indicator combines traditional price action patterns with modern concepts like Fair Value Gaps (FVG) to provide trading signals with precise entry points and stop loss levels. Features 7 Trading Scenarios : Each scenario identifies specific market conditions and trading opportunities Visual Signals : Clear buy/sell
FREE
Bollinger Bands B
Flavio Javier Jarabeck
4.25 (4)
John Bollinger created this indicator in 2010 as a way to read the original indicator (Bollinger Bands) in a more "technical" way, shown as an oscillator. The typical range of the Bollinger Bands %B is 0 - 0.5 - 1.0, where "0" represents the lower band, the "0.5" the middle band, and "1" the upper band. The line on the indicator represents the Closing prices. As simple as that. SETTINGS Bollinger Bands period of analysis Standard Deviation multiplier Shift Price type to be analyzed If you like
FREE
The indicator is based on Robert Miner's methodology described in his book "High probability trading strategies" and displays signals along with momentum of 2 timeframes. A Stochastic oscillator is used as a momentum indicator. The settings speak for themselves period_1 is the current timeframe, 'current' period_2 is indicated - the senior timeframe is 4 or 5 times larger than the current one. For example, if the current one is 5 minutes, then the older one will be 20 minutes The rest of the s
FREE
Hull Moving Average (HMA) is well-deservedly popular among traders because of the effective averaging of market noise and a relatively small delay. The current MetaTrader 5 version changes its color when the movement direction changes. Sound and text signals are available. It also supports sending email and push messages. It is possible to trigger a signal on the current incomplete bar, although such a signal may be canceled before completion if conditions are no longer appropriate. One of the p
FREE
Free automatic Fibonacci is an indicator that automatically plots a Fibonacci retracement based on the number of bars you select on the BarsToScan setting in the indicator. The Fibonacci is automatically updated in real time as new highest and lowest values appears amongst the selected bars. You can select which level values to be displayed in the indicator settings. You can also select the color of the levels thus enabling the trader to be able to attach the indicator several times with differe
FREE
Dynamic Supply and Demand indicator automatically identifies and displays Supply and Demand Zones on your chart based on price action patterns and market structure.  These zones represent areas where institutional buying or selling pressure has historically occurred, making them key levels for potential price reactions. This form of indicator takes inspiration from ICT as well as traditional Support & Resistance formation. **For the first 50 candles (number depends on LookBackCandles) when indic
FREE
This is a regression tree indicator for MT4/MT5. This indicator classificate nodes on the time period so that the deviation becomes smaller, and displays regression line and channel for each node. It's free! Attached CartDemo.ex4 and CartDemo.ex5 is a Demo version and has the following limitations: Can't use HighSpeed method (default method is RandomForest) Maximum number of bars is 260 (increase from 200) There is no expiration date and can be started many times, but it stops after an hour.
FREE
Description : Rainbow MT5 is a technical indicator based on Moving Average with period 34 and very easy to use. When price crosses above MA and MA changes color to green, then this is a signal to buy. When price crosses below MA and MA changes color to red, then this is a signal to sell. The Expert advisor ( Rainbow EA MT5 ) based on Rainbow MT5 indicator is now available here . MT4 version is available here .
FREE
RSI Divergence Lite (Free) - MT5 Indicator ------------------------------------------------- This is the Lite (free) version of RSI Divergence. - Detects basic Bullish and Bearish divergence between price and RSI - Works only on M15 timeframe - No divergence lines, no alerts - Fixed internal settings (RSI 14, pivot sensitivity, thresholds) - For educational and testing purposes For the full PRO version (multi-timeframe, alerts, divergence lines, advanced UI), please upgrade to RSI Divergence
FREE
This indicator is a zero-lag indicator and displays  strength of trend change . True Trend  Oscillator Pro works best in combination with True Trend Moving Average Pro that displays exact trend as is. Oscillator value is exact price change in given direction of the trend. True Trend Moving Average Pro: https://www.mql5.com/en/market/product/103586 If you set PERIOD input parameter to 1 this indicator becomes a sharpshooter for binary options. Developers can use True Trend Oscillator in Exper
FREE
このプロダクトを購入した人は以下も購入しています
SuperScalp Pro
Van Minh Nguyen
4.69 (16)
SuperScalp Pro — 高度なマルチフィルター対応スキャルピングインジケーターシステム SuperScalp Pro は、クラシックな Supertrend と複数のインテリジェントな確認フィルターを組み合わせた高度なスキャルピング用インジケーターシステムです。M1〜H4 のすべての時間足で効率的に機能し、特に XAUUSD、BTCUSD、および主要なFX通貨ペアに適しています。単体のシステムとして、また既存の取引戦略へ柔軟に統合して使用できます。 本インジケーターは 11 以上のフィルターを統合しており、短期・長期の EMA、トレンド判定に用いる 3 本の EMA、EMA スロープ(EMA slope)、RSI、ADX、出来高、VWAP、ボリンジャーバンドのブレイクアウト、MACD ダイバージェンスフィルターなどを含みます。スマートキャンドルフィルターはローソク足の終値を確認して弱いシグナルを排除し、3 本の EMA と MACD ダイバージェンスを組み合わせたトレンド認識メカニズムにより勝率の高いシグナルの選別を支援します。 SuperScalp Pro は ATR に基
Azimuth Pro
Ottaviano De Cicco
5 (6)
発売プロモーション Azimuth Proは先着100名様限定で 299ドル でご提供します。最終価格は 499ドル となります。 リテールとインスティテューショナルのエントリーの違いはインジケーターではなく、ロケーションにあります。 多くのトレーダーは、モメンタムを追いかけたり、遅行シグナルに反応して、任意の価格レベルでエントリーします。機関投資家は、需給が実際にシフトする構造的なレベルに価格が到達するのを待ちます。 Azimuth Proはこれらのレベルを自動的にマッピングします:スイングアンカーVWAP、マルチタイムフレーム構造ライン、高確率ロケーションにのみ出現するABCパターン。 Azimuth Proは、構造分析とインテリジェントな自動化の両方を求めるプロフェッショナルトレーダー向けに構築されています。 Azimuthが外科的精度で市場構造をマッピングする一方、Azimuth Proはインテリジェンスレイヤーを追加します:トレーディングスタイルの自動検出、スマート設定された移動平均線、20年のデータでバックテストされた最適化パラメータ。その結果、お使いの銘柄と
このインジケーターを購入された方には、以下の特典を 無料 で提供しています: 各トレードを自動で管理し、ストップロスとテイクプロフィットを設定し、戦略ルールに基づいてポジションを決済する補助ツール 「Bomber Utility」 様々な銘柄に合わせたインジケーターの設定ファイル(セットファイル) 「最小リスク」、「バランスリスク」、「待機戦略」 の3つのモードで使用できる Bomber Utility 用の設定ファイル このトレーディング戦略をすぐに導入・設定・開始できる ステップバイステップのビデオマニュアル ご注意: 上記の特典を受け取るには、MQL5のプライベートメッセージシステムを通じて販売者にご連絡ください。 オリジナルのカスタムインジケーター 「Divergence Bomber(ダイバージェンス・ボンバー)」 をご紹介します。これは、MACDのダイバージェンス(乖離)戦略に基づいた 「オールインワン」型のトレーディングシステム です。 このテクニカルインジケーターの主な目的は、価格とMACDインジケーターの間に発生するダイバージェンスを検出 し、将来の価格の動きを示す
Power Candles – あらゆる市場に対応した強度ベースのエントリーシグナル Power Candles は、Stein Investments が長年培ってきた強度分析を価格チャート上に直接反映します。価格だけに反応するのではなく、各ローソク足は実際の市場の強さに基づいて色分けされ、モメンタムの蓄積、強度の加速、明確なトレンド転換を瞬時に把握できます。 すべての市場に共通する単一ロジック Power Candles は すべての取引シンボル で自動的に動作します。現在のシンボルが Forex か非 Forex 市場かを自動判別し、内部で適切な強度モデルを適用します。 Forex および Gold :FX Power のデルタ値を使用(絶対値レンジ最大 100) 指数、暗号資産、CFD :IX Power の強度値を使用(絶対値レンジ最大 50) 必要な強度計算は Power Candles に直接組み込まれています。ローソク足のカラーリングやシグナルロジックに、追加のインジケーターは不要です。 価格ノイズではなく「強度状態」 各ローソク足は、以下の 9 つの明確に定義された強
Entry In The Zone and SMC Multi Timeframe is a real-time 2-in-1 market analysis tool that combines market structure analysis and a No Repaint BUY / SELL signal system into a single indicator, built on Smart Money Concepts (SMC) — a widely adopted framework used by professional traders to understand market structure. This indicator helps you see the market more clearly, make decisions based on structure rather than guesswork, and focus on high-probability zones where price is more likely to react
このインジケーターを購入すると、プロ仕様のトレードマネージャーを無料で差し上げます。 まず第一に、このトレーディングシステムがノンリペイント、ノンリドロー、ノンラグのインジケーターであることを強調する価値がある。これにより、手動取引とロボット取引の両方に理想的なものになっています。 オンラインコース、マニュアル、プリセットのダウンロード。 「スマートトレンドトレーディングシステム MT5」は、新規および経験豊富なトレーダー向けにカスタマイズされた包括的なトレーディングソリューションです。10以上のプレミアムインジケーターを組み合わせ、7つ以上の堅実なトレーディング戦略を備えており、多様な市場状況に対応する多目的な選択肢となっています。 トレンドフォロー戦略:トレンドを効果的に乗り越えるための正確なエントリーとストップロス管理を提供します。 リバーサル戦略:潜在的なトレンドの反転を特定し、トレーダーがレンジ相場を活用できるようにします。 スキャルピング戦略:高速で正確なデイトレードおよび短期取引のために設計されています。 安定性:すべてのインジケーターはノンリペイント、ノンリドロー、ノ
OmniSync Projection
Antonio-alin Teculescu
5 (1)
Chronos Fractal Engine is an innovative price projection indicator for MetaTrader 5, designed to transform your technical analysis by intelligently identifying and projecting historical price patterns. Built upon an advanced correlation algorithm and the fractal principles of the market, this powerful tool visualizes potential future price movements, giving you a unique edge in your trading decisions. What is Chronos Fractal Engine? At its core, the Chronos Fractal Engine employs a sophisticat
Meridian Pro
Ottaviano De Cicco
5 (1)
Meridian Pro:MT5用プロフェッショナル・マルチタイムフレーム・トレンドマトリックス 概要 Meridian Pro は Merkava Labs が開発したマルチタイムフレーム・トレンドマトリックスで、方向性の状態、強度、モメンタムの状況、マトリックスの合意をひとつのコンパクトなパネルに集約します。ひとつのアダプティブエンジンがM1からW1まで一貫して適用されます。シンボルごとの調整は不要。インジケーターの積み重ねも不要。すべてのアセットとすべてのタイムフレームをカバーするひとつの構造化された読み取りです。 発売キャンペーン — Meridian Proを USD 99 (導入価格)で入手。通常価格:USD 149 。 1. Meridian Proが他と異なる理由 ひとつのエンジン、バラバラなインジケーターのダッシュボードではない 多くのMTFダッシュボードは、タイムフレームごとに生のインジケーター値を繰り返すだけです。Meridian Proはマトリックス全体でひとつのアダプティブ・トレンドエンジンを使用するため、パネルの各行が同じ構造化フレームワークから導出されます
あなたのシンボルでどの戦略が実際に機能するか確認しましょう - リアルマネーをリスクにさらす前に。 Power Barは、あらゆるシンボルとあらゆるタイムフレームで 極端な価格バー を検出し、3つの異なるトレード戦略を即座にバックテストします。勝率、プロフィットファクター、損益を並べて比較できます。すべてが1つのインタラクティブなパネルに集約されています。 推測なし。カーブフィッティングなし。データだけです。 Power Barが特別な理由 ほとんどのインジケーターはシグナルを出すだけで、それが機能するかどうかは推測に任されます。Power Barはさらに先を行きます - すべてのシグナルを 3つの戦略 に対してテストし、統計を表示します。FlipFlop、Momentum、Reversalをワンクリックで切り替え、数値が即座に変化するのを確認できます。 FlipFlop - 常にポジションを保有。シグナルでエントリーし、反対シグナルでイグジット。当社のリサーチでは、US30、US500、DAXなどのトレンドのあるインデックスで最も効果的です。 Momentum - シグナルの方向に
トレンド スクリーナー インジケーターでトレンド取引の力を解き放ちます。ファジー ロジックと複数通貨システムを活用した究極のトレンド取引ソリューションです。 ファジー ロジックを活用した革新的なトレンド インジケーターである Trend Screener を使用して、トレンド取引を向上させます。 これは、13 を超えるプレミアム ツールと機能、および 3 つの取引戦略を組み合わせた強力なトレンド追跡インジケーターであり、Metatrader をトレンド アナライザーにする多用途の選択肢となります。 期間限定オファー : トレンド スクリーナー インジケーターは、わずか 100 ドルで生涯ご利用いただけます。 (元の価格 50$ ) (オファー延長) Trend Screener の 100% 非再描画精度の揺るぎない精度を体験して、取引の決定が過去の価格変動の影響を受けないようにしてください。 マルチタイムフレームおよびマルチ通貨機能の多用途性を解放し、比類のない自信を持って外国為替、商品、暗号通貨、インデックスの世界を取引できるようにします。 Trend Screener の包括的な
FX Trend NG:次世代マルチマーケット・トレンドインテリジェンス 概要 FX Trend NG は、複数の時間足に対応したプロフェッショナル向けトレンド分析およびマーケット監視ツールです。 市場全体の構造を数秒で把握することができます。 複数のチャートを切り替える必要はありません。どの銘柄がトレンド中なのか、どこでモメンタムが弱まっているのか、そしてどの時間足で強い整合性があるのかを瞬時に確認できます。 ローンチ特別オファー – FX Trend NG を $30(6ヶ月) または $80 永久ライセンス でご利用いただけます。 すでに Stein Investments のユーザーですか? -> メッセージを送信 して、プライベートグループへアクセスしてください。 セットアップや詳細情報が必要ですか? -> Stein Investments 公式ページ をご覧ください。 1. FX Trend NG が他と異なる理由 3ステート・トレンドロジック ― Buy と Sell だけではない • 多くのインジケーターは Buy または Sell の2状態のみを表示します。
まず第一に、この取引インジケーターは再描画されず、再描画されず、遅延しないことを強調する価値があります。これにより、手動取引とロボット取引の両方に理想的なものになります。 ユーザーマニュアル:設定、入力、戦略。 アトミックアナリストは、価格の強さとモメンタムを利用して市場でより良いエッジを見つけるためのPA価格アクションインジケーターです。ノイズや誤ったシグナルを除去し、取引ポテンシャルを高めるための高度なフィルターを備えています。複雑なインジケーターの複数のレイヤーを使用して、アトミックアナリストはチャートをスキャンし、複雑な数学的計算をシンプルなシグナルと色に変換します。これにより、どのような初心者トレーダーでも理解して使用し、一貫した取引の決定を行うことができます。 「アトミックアナリスト」は、新規および経験豊富なトレーダー向けにカスタマイズされた包括的な取引ソリューションです。プレミアムインジケーターとトップノッチの機能を1つの取引戦略に組み合わせ、すべてのタイプのトレーダーにとって汎用性のある選択肢にします。 デイリートレーディングとスキャルピング戦略:高速で正確なデイ
このインジケーターは、反転ポイントと価格戻りゾーンを正確に表示します。     主要プレーヤー 。新たなトレンドが形成される場所を把握し、最大限の精度で意思決定を行い、すべての取引をコントロールします。 TREND LINES PRO インジケーターと組み合わせることで、その潜在能力を最大限に発揮します。 VERSION MT4 インジケーターが示す内容: 新しいトレンドの始まりに活性化する反転構造と反転レベル。 リスクと報酬の比率を最小限に抑えた利益 確定 と 損失停止の レベルの表示     RR 1:2   。 インテリジェントな削減ロジックによるストップロス。 指定されたインジケーターから 2 つのトレンド タイプの反転パターンを表示します。 指標: トレンドを追う   TREND LINES PRO   (世界的なトレンドの変化) TREND PRO   (クイックトレンド変更) シンプルで効果的   スキャナー   リアルタイムトレンド(新機能)。 マルチタイムフレームのインストゥルメント フィルタリング。 画面   利益     LOGIC AI信号の後。 当日プラス方
Trend Ai indicatorは、トレンドの識別と実用的なエントリポイントと反転アラートを組み合わせることで、トレーダーの市場分析を強化する優れたツールです。 この指標は、ユーザーが自信と正確さで外国為替市場の複雑さをナビゲートすることを可能にします トレンドAiインジケーターは、主要なシグナル以外にも、プルバックやリトレースメント中に発生するセカンダリエントリポイントを識別し、トレーダーが確立されたトレンド内の価格修正を活用できるようにします。 重要な利点: *MT4およびMT5の仕事 *明確な買いまたは売りシグナル *再描画しません ·すべての資産で動作します 私はeaやセットをtelegram it詐欺で販売しないように注意してください。 すべての設定はここでブログで無料です。  重要! 指示とボーナスを得るために購入後すぐに私に連絡してください! 私の他のプロダクトと同様、実質操作の監視はここに見つけることができます: https://www.mql5.com/en/users/mechanic/seller&nbsp ; 設定および入力: すべての
Crystal Heikin Ashi Signals - Professional Trend & Signal Detection Indicator Advanced Heikin Ashi Visualization with Intelligent Signal System for Manual & Automated Trading Final Price: $149 ---------> Price goes up $10 after every 10 sales . Limited slots available — act fast . Overview Crystal Heikin Ashi Signals is a professional-grade MetaTrader 5 indicator that combines pure Heikin Ashi candle visualization with an advanced momentum-shift detection system. Designed for both manual traders
BTMM State Engine Pro is a MetaTrader 5 indicator for traders who use the Beat The Market Maker approach: Asian session context, kill zone timing, level progression, peak formation detection, and a multi-pair scanner from a single chart. It combines cycle state logic with a built-in scanner dashboard so you do not need the same tool on many charts at once. What it does Draws the Asian session range; session times can follow broker server offset or be set in inputs. Tracks level progression (L
Gann Made Easy   は、ミスター・ギャンの理論を使用した取引の最良の原則に基づいた、プロフェッショナルで使いやすい外国為替取引システムです。 W・D・ガン。このインジケーターは、ストップロスとテイクプロフィットレベルを含む正確な買いと売りのシグナルを提供します。 PUSH通知を利用して外出先でも取引可能です。 ご購入後、取引方法の説明と優れた追加インジケーターを無料で入手するには、私にご連絡ください! おそらく、ギャンの取引手法についてはすでに何度も聞いたことがあるでしょう。通常、ギャンの理論は初心者のトレーダーだけでなく、すでにある程度の取引経験がある人にとっても非常に複雑なものです。なぜなら、ギャンの取引手法は理論的にはそれほど簡単に適用できるものではないからです。私はその知識を磨き、最良の原則を私の外国為替インジケーターに組み込むために数年を費やしました。 このインジケーターは非常に簡単に適用できます。必要なのは、それをチャートに添付し、簡単な取引推奨事項に従うだけです。このインジケーターは常に市場分析の仕事を行い、取引の機会を探します。適切なエントリーポイントを検
Currency Strength Dashboard Pro MetaTrader 5 用の リアルタイム通貨強度分析プロフェッショナルダッシュボード 。 このインジケーターは、 8つの主要通貨 (EUR、USD、GBP、JPY、CHF、AUD、CAD、NZD)の強さを計算し、 28の通貨ペア を同時に複数の時間足で分析・表示します。 ダッシュボードにより、トレーダーは 市場全体の状況を一目で把握 でき、余計な計算や複数のチャートを切り替える必要がありません。 計算方法 このインジケーターは、 高度な数学的通貨強度分析手法 に基づいています。 これは、類似インジケーターで一般的に使用されている RSIベースの手法 と比較して、より正確で客観的です。 この方法は 28の通貨ペアすべての相互関係を同時に分析 し、市場における実際の力関係をよりクリーンで偏りのない形で表示します。 リアルタイムダッシュボード メインテーブルには 8つの通貨 の完全なデータが表示されます。 Rank(順位) — 通貨の総合強度による順位。 1(最も強い)〜8(最も弱い) 。 Strength(強度) — 現在
FX Power: 通貨の強弱を分析して、より賢い取引を実現 概要 FX Power は主要通貨と金の実際の強弱をあらゆる市場状況で理解するための必須ツールです。強い通貨を買い、弱い通貨を売ることで、 FX Power は取引の意思決定を簡素化し、高い確率の取引機会を見出します。トレンドを追従する場合でも、極端なデルタ値を使用して反転を予測する場合でも、このツールはあなたの取引スタイルに完全に適応します。ただ取引するだけではなく、 FX Power で賢く取引をしましょう。 1. なぜ FX Power がトレーダーにとって非常に有益なのか 通貨と金のリアルタイム強弱分析 • FX Power は主要通貨と金の相対的な強弱を計算し、マーケットダイナミクスに関する明確な洞察を提供します。 • どの資産がリードしているか、または後れを取っているかを監視して、取引するペアを賢く選びましょう。 マルチタイムフレームの包括的なビュー • 短期、中期、長期のタイムフレームで通貨と金の強弱を追跡し、マーケットトレンドに基づいて取引戦略を調整できます。 • スキャルピングからスイングトレード
RelicusRoad Pro: 定量的市場オペレーティングシステム 【期間限定】無制限アクセス 70% OFF - 2,000人超のトレーダーと共に なぜ多くのトレーダーは「完璧な」インジケーターを使っても失敗するのでしょうか? それは、文脈を無視して 単一の概念 だけでトレードしているからです。文脈のないシグナルは単なるギャンブルです。勝ち続けるには、 根拠の重なり(コンフルエンス) が必要です。 RelicusRoad Proは単なる矢印インジケーターではありません。完全な 定量的市場エコシステム です。独自のボラティリティモデリングを用いて、価格が推移する「適正価値の道(Fair Value Road)」をマッピングし、ノイズと真の構造的ブレイクを判別します。 推測はやめましょう。機関投資家レベルの「ロード・ロジック」でトレードを。 コアエンジン:「Road」アルゴリズム システムの中心となる Road Algo は、市場環境にリアルタイムで適応するダイナミックなボラティリティチャネルです。 安全ライン(平衡点) と、価格が数学的に反転しやすい 拡張レベル を投影します。 Si
ARICoin is a powerful trading companion designed to generate high-probability entry signals with dynamic TP/SL/DP levels based on volatility. Built-in performance tracking shows win/loss stats, PP1/PP2 hits, and success rates all updated live. Key Features: Buy/Sell signals with adaptive volatility bands Real-time TP/SL/DP levels based on ATR Built-in MA Filter with optional ATR/StdDev volatility Performance stats panel (Success, Profit/Loss, PP1/PP2) Alerts via popup, sound, push, or email Cust
Market Structure Order Block Dashboard MT5 は、 MT5(MetaTrader 5)用インジケーター です。 市場構造 と ICT / Smart Money Concepts に基づき、 HH/HL/LH/LL 、 BOS 、 ChoCH に加えて、 Order Blocks 、 Fair Value Gaps (FVG) 、 流動性 (EQH/EQL、sweeps)、 セッション / Kill Zones 、 Volume Profile を表示し、コンパクトなコンフルエンス・ダッシュボードを提供します。 重要: これは 分析ツール です。自動売買は行いません(EAではありません)。 購入者特典(ボーナス) 購入後、私のストアから 2つのボーナスインジケーター を(選択して)受け取ることができます。 ボーナスの受け取り方法: 1) 本商品のページに正直なレビューを投稿してください。 2) MQL5のメッセージで、 BONUS MSOB + 選んだ 2つのインジケーター名 を送ってください。 主な機能 市場構造: HH/HL/LH/LL
Bill Williams Advanced is designed for automatic chart analysis using Bill Williams' "Profitunity" system. The indicator analyzes four timeframes at once. Manual (Be sure to read before purchasing) Advantages 1. Analyzes the chart using Bill Williams' "Profitunity" system. Signals are displayed in a table in the corner of the screen and on the price chart. 2. Finds all known AO and AC signals, as well as zone signals. Equipped with a trend filter based on the Alligator. 3. Finds "Divergence Bar
CGE Trading Suite
Carl Gustav Johan Ekstrom
5 (1)
CGE Trading Suite delivers the analytical edge typically reserved for professional trading desks. The platform integrates a full suite of analytical tools into one seamless workflow: dynamic grid mapping, liquidity behavior analysis, ECM, trend lines, MIDAS, trade cycles, and directional channel projections. Together, these provide a unified view of market structure and momentum. Directional clarity is further enhanced by the capital flow index, which measures currency basket strength to identif
ARIPoint is a powerful trading companion designed to generate high-probability entry signals with dynamic TP/SL/DP levels based on volatility. Built-in performance tracking shows win/loss stats, PP1/PP2 hits, and success rates all updated live. Key Features: Buy/Sell signals with adaptive volatility bands Real-time TP/SL/DP levels based on ATR Built-in MA Filter with optional ATR/StdDev volatility Performance stats panel (Success, Profit/Loss, PP1/PP2) Alerts via popup, sound, push, or email Cu
Gold Sniper Scalper Pro は、XAUUSD における ダマシブレイクアウト(false breakout)パターンの検出に特化した MetaTrader 5 用インジケーターです。価格がレンジの境界を突破してブレイクアウトトレーダーを誘い込み、その後反転してレンジ内に戻る4本バーのトラップ構造を識別します。インジケーターは各セットアップを17の品質要素で採点し、4層コンフルエンスパイプラインで評価し、7タイムフレームトレンドコンセンサスエンジンで検証し、ゴールドボラティリティレジーム分類器でフィルタリングします。すべてシグナルがチャートに表示される前に完了します。 詳細なユーザーガイドは、著者の   MQL5 ブログ   で入手できます。追加の更新は、著者の   MQL5 チャンネル   を通じて入手可能です。 現在のサポートポリシーに基づき、購入者は著者が開発した選定コンパニオンツールへの追加アクセスを受けることができます。 Forex通貨ペア、インデックス、暗号資産でも動作しますが、検出パラメーター、ボラティリティ処理、フィルターロジックはXAUUSD
トレンドラインプロ   市場の真の方向転換点を理解するのに役立ちます。この指標は、真のトレンド反転と主要プレーヤーが再び参入するポイントを示します。 分かりますか     BOSライン   複雑な設定や不要なノイズなしに、より長い時間足でのトレンドの変化と重要なレベルを把握できます。シグナルは再描画されず、バーが閉じた後もチャート上に残ります。 MT4バージョン   -   RFI LEVELS PRO インジケーター と組み合わせることで、その最大限の能力を発揮します インジケーターが示す内容: 本当の変化   トレンド(BOSライン) 一度シグナルが現れたら、それは有効です!これは、リペイント機能を持つインジケーターとの重要な違いです。リペイント機能を持つインジケーターは、シグナルを発した後、それを変更し、資金の損失につながる可能性があります。これにより、より高い確率と精度で市場に参入できます。また、矢印が現れた後、目標値(利益確定)に達するか、反転シグナルが現れるまで、ローソク足の色を変更する機能もあります。 繰り返しエントリ   主要プレーヤーの補充 エントリーポイントを探す
トレンドトレーディング は、タイミングのプルバックとブレイクアウトにより、市場で起こっているトレンドから可能な限り利益を得るように設計された指標です。確立されたトレンドの中で価格が何をしているかを分析することにより、取引の機会を見つけます。 [ インストールガイド | 更新ガイド | トラブルシューティング | よくある質問 | すべての製品 ] 自信を持って効率的に金融市場を取引する むち打ちにならずに確立されたトレンドから利益を得る 収益性の高いプルバック、ブレイクアウト、早期の逆転を認識する この指標は、独自の品質とパフォーマンスを分析します 複数時間枠のダッシュボードを実装します インジケーターは再描画されていません 電子メール/音声/視覚アラートを実装します 確立されたトレンドは多くの取引機会を提供しますが、ほとんどのトレンド指標はそれらを完全に無視しています。インジケーターの解釈はかなり簡単です: (1) トレンドの変化 (2) トレンドの方向への後退 (3) トレンドの方向へのブレイクアウト 赤いダッシュ は下降トレンド中の修正です 青いダッシュ は上昇トレンド中
Trend Hunter は、外国為替、仮想通貨、CFD 市場におけるトレンド指標です。 このインジケーターの特別な特徴は、価格がトレンドラインをわずかに突き抜けたときにシグナルを変更することなく、自信を持ってトレンドに従うことです。 インジケーターは再描画されず、バーが閉じた後に市場に参入するシグナルが表示されます。 トレンドに沿って移動すると、インジケーターにはトレンドの方向に追加のエントリーポイントが表示されます。 これらのシグナルに基づいて、小さなストップロスで取引できます。 トレンドハンターは正直な指標です。 インジケーター信号の上にマウスを置くと、信号の潜在的な利益と可能なストップが表示されます。 新しい信号が表示されると、次の通知を受け取ることができます。 アラート プッシュ通知 メールによる通知 電報での通知 チャートのスクリーンショットも Telegram に送信されるため、取引を決定するために端末を開く必要はありません。 インジケーターシグナルは、電報チャネル https://www.mql5.com/ja/market/product/11085#!ta
FX Levels: あらゆる市場における非常に高精度なサポート&レジスタンス 概要 通貨ペア、株式指数、個別銘柄やコモディティなど、どのような市場でも信頼できるサポートとレジスタンスを特定したいですか? FX Levels は伝統的な “Lighthouse” メソッドと先進的な動的アプローチを融合し、ほぼ汎用的な精度を実現します。ブローカーの実務経験を活かし、自動化されたデイリー更新とリアルタイム更新を組み合わせることで、 FX Levels は反転ポイントを見つけ、利益目標を設定し、自信をもってトレードを管理するための手助けをします。今すぐ試してみて、サポート/レジスタンス分析の正確性がどれほどトレードを向上させるかを実感してください! 1. FX Levels がトレーダーにとって非常に有用な理由 非常に正確なサポート&レジスタンスゾーン • FX Levels は異なるブローカー環境でもほぼ同一のゾーンを生成するよう設計されており、データフィードの差異や時刻設定のずれによる不一致を解消します。 • つまり、どのブローカーを利用していても一貫したレベルが得られるため、戦
作者のその他のプロダクト
Special offer : ALL TOOLS , just $35 each! New tools   will be   $30   for the   first week   or the   first 3 purchases !  Trading Tools Channel on MQL5 : Join my MQL5 channel to update the latest news from me SuperTrend ATR Multiplier with Scanner for MT5 をご紹介します。これは、マーケットトレンドに先んじるための多機能で強力なツールで、カスタマイズ可能な機能とリアルタイムのアラートが備わっています。このインディケーターは、 Kivanc Ozbilgic の信頼できる SuperTrend ロジックを基に、正確なトレンド信号を提供します。 ATR の計算方法は、柔軟に対応するために RMA (相対移動平均)と SMA (単純移動平均)から選べます。デフォルト設定では、 ATR 期間が10、乗数が3に設定されており、 SuperT
FREE
Special offer : ALL TOOLS , just $35 each! New tools   will be   $30   for the   first week   or the   first 3 purchases !  Trading Tools Channel on MQL5 : Join my MQL5 channel to update the latest news from me Volumatic VIDYA (Variable Index Dynamic Average) は、トレンドを追跡し、トレンドの各フェーズ内での買い圧力と売り圧力を分析するために設計された高度なインジケーターです。可変インデックス動的平均 (Variable Index Dynamic Average) をコアの動的平滑化技術として利用することで、このツールは、価格とボリュームのダイナミクスに関する重要な洞察を、市場構造の重要なレベルで提供します。 MT5バージョンを見る:  Volumatic VIDyA MT5 他の製品を見る:   全製品 To use iCus
Special offer : ALL TOOLS , just $35 each! New tools   will be   $30   for the   first week   or the   first 3 purchases !  Trading Tools Channel on MQL5 : Join my MQL5 channel to update the latest news from me Supertrend Fakeout インジケーターは、従来の Supertrend インジケーターを改良したバージョンで、より信頼性の高いトレンドシグナルを提供することを目的としています。 Fakeout Index Limit や Fakeout ATR Mult といった高度な機能を取り入れることで、このインジケーターは短期的な価格変動や市場ノイズによって引き起こされる誤ったトレンド反転をフィルタリングするのに役立ちます。 MT4バージョンを見る:  Supertrend Fakeout MT4 その他の製品を見る:   すべての製品 動作の仕組み Supertr
FREE
Special offer : ALL TOOLS , just $35 each! New tools   will be   $30   for the   first week   or the   first 3 purchases !  Trading Tools Channel on MQL5 : Join my MQL5 channel to update the latest news from me Follow Line MT5 とスキャナーを使って、ボラティリティに基づいた高度なインジケーターでトレーディングエッジを最大限に活用しましょう。このツールは、カスタマイズ可能な設定とともに、ボリンジャーバンドの力を組み合わせ、価格の動きについて正確な洞察を提供します。 See more MT4 version at:   Follow Line MT4 with Scanner See more products at:   https://www.mql5.com/en/users/ndhsfy/seller Follow Line の鍵は、価格が 1 標準偏差に設
FREE
Special offer : ALL TOOLS , just $35 each! New tools   will be   $30   for the   first week   or the   first 3 purchases !  Trading Tools Channel on MQL5 : Join my MQL5 channel to update the latest news from me Fibonacci Confluence Toolkit Multi-Timeframe は、プロのトレーダー向けに設計された高度な技術的分析ツールで、主要な市場シグナルとパターンを組み合わせて潜在的な価格反転ゾーンを特定するのに役立ちます。タイムフレームセレクターのダッシュボードを通じたマルチタイムフレーム表示機能により、このツールキットは市場のダイナミクスを包括的かつ洞察に満ちた視点で提供し、正確かつタイムリーなトレーディング判断を可能にします。 MT5バージョンの詳細は:  Fibonacci Confluence Toolkit MT5 Multi Timefr
SMC System MT4
Duc Hoan Nguyen
4.5 (2)
Special offer : ALL TOOLS , just $35 each! New tools   will be   $30   for the   first week   or the   first 3 purchases !  Trading Tools Channel on MQL5 : Join my MQL5 channel to update the latest news from me SMC は、流動性ゾーン、機関注文の配置、そして市場の主要な転換点を特定するためのトレーディングアプローチです。SMCの原則を活用することで、トレーダーは市場をより効果的にナビゲートし、最適なエントリーとエグジットを見つけることができます。 SMC System  インジケーターはこれらの概念を自動化し、以下のような重要なプライスアクション要素でチャートをすばやくマークすることを可能にします: リアルタイムの市場構造  (内部構造およびスイング構造のBOS / CHoCH) オーダーブロック  (強気および弱気) プレミアムゾーンとディスカウントゾーン イコールハイとイ
Special offer : ALL TOOLS , just $35 each! New tools   will be   $30   for the   first week   or the   first 3 purchases !  Trading Tools Channel on MQL5 : Join my MQL5 channel to update the latest news from me 概要 OA SnR Powerは、サポートおよびレジスタンスレベルの強度を識別して評価するために設計された強力なツールです。取引量、反発頻度、再テスト回数などの重要な要素を組み込むことで、このインジケーターは市場の重要な価格ゾーンを包括的に可視化します。 その他の製品を見る:   すべての 製品 OA SnR Powerの仕組み 高値と安値の特定 このインジケーターは、ローカル高値と安値を計算するための高度なアルゴリズムを使用します。 ユーザーはゾーン幅の設定を調整でき、サポートおよびレジスタンスの潜在的なレベルを正確に検出します。 主要レベルのフィルタリングと統合
FREE
Special offer : ALL TOOLS , just $35 each! New tools   will be   $30   for the   first week   or the   first 3 purchases !  Trading Tools Channel on MQL5 : Join my MQL5 channel to update the latest news from me SMC は、流動性ゾーン、機関注文の配置、そして市場の主要な転換点を特定するためのトレーディングアプローチです。SMCの原則を活用することで、トレーダーは市場をより効果的にナビゲートし、最適なエントリーとエグジットを見つけることができます。 SMC System  インジケーターはこれらの概念を自動化し、以下のような重要なプライスアクション要素でチャートをすばやくマークすることを可能にします: リアルタイムの市場構造  (内部構造およびスイング構造のBOS / CHoCH) オーダーブロック  (強気および弱気) プレミアムゾーンとディスカウントゾーン イコールハイとイ
Special offer : ALL TOOLS , just $35 each! New tools   will be   $30   for the   first week   or the   first 3 purchases !  Trading Tools Channel on MQL5 : Join my MQL5 channel to update the latest news from me ボリュメトリックオーダーブロック多時間枠 インジケーターは、主要な市場参加者が注文を蓄積する重要な価格エリアを特定することで、より深い市場の洞察を求めるトレーダー向けに設計された強力なツールです。これらのエリアはボリュメトリックオーダーブロックとして知られており、サポートやレジスタンスの潜在的ゾーンとして機能し、取引の意思決定において重要な優位性を提供します。 MT4バージョンを見る:   Volumetric Order Blocks MT4 Multi Timeframe See more products at:   https://www.mql5.com/en
Special offer : ALL TOOLS , just $35 each! New tools   will be   $30   for the   first week   or the   first 3 purchases !  Trading Tools Channel on MQL5 : Join my MQL5 channel to update the latest news from me Supertrend Fakeout インジケーターは、従来の Supertrend インジケーターを改良したバージョンで、より信頼性の高いトレンドシグナルを提供することを目的としています。 Fakeout Index Limit や Fakeout ATR Mult といった高度な機能を取り入れることで、このインジケーターは短期的な価格変動や市場ノイズによって引き起こされる誤ったトレンド反転をフィルタリングするのに役立ちます。 MT5バージョンを見る:  Supertrend Fakeout MT5 その他の製品を見る:   すべての製品 動作の仕組み Supertr
FREE
スペシャルオファー : ALL TOOLS 、1つあたり $35 のみ! New tools   will be   $30   for the   first week   or the   first 3 purchases !  Trading Tools Channel on MQL5 : Join my MQL5 channel to update the latest news from me ボラティリティの高いトレード環境では、パワフルで直感的な分析ツールがあれば、チャンスを素早く捉えることができます。Fibonacci Trend Scanner は従来のFibonacciインジケーター機能とSuperTrendを統合しただけでなく、通貨ペアのスキャン、マルチタイムフレームのモニタリング、そしてトレンドが強気から弱気へ(またはその逆)転換する際にインテリジェントアラートを出す機能など、機能を拡張しています。 See more MT4 version at:   Fibonacci Trend MT4 Scanner See more products at:   A
Special offer : ALL TOOLS , just $35 each! New tools   will be   $30   for the   first week   or the   first 3 purchases !  Trading Tools Channel on MQL5 : Join my MQL5 channel to update the latest news from me スリーバーレバーサルパターンインジケーター は、トレーダーに強力なツールを提供し、価格チャート上で三本の反転パターンを自動的に識別して強調表示します。このインジケーターは、潜在的なトレンドの反転を検出するための貴重なリソースであり、統合されたトレンドインジケーターを通じて信号精度を向上させることができます。 MT4バージョンの詳細はこちら:  Three Bar Reversal Pattern MT4 その他の製品はこちら:   すべての製品 主な機能 パターンの自動検出: このインジケーターは、三本の反転パターンをスキャンし、視覚的に明確なシグナルで表示し、潜在的な
Special offer : ALL TOOLS , just $35 each! New tools   will be   $30   for the   first week   or the   first 3 purchases !  Trading Tools Channel on MQL5 : Join my MQL5 channel to update the latest news from me ボリュメトリックオーダーブロック多時間枠 インジケーターは、主要な市場参加者が注文を蓄積する重要な価格エリアを特定することで、より深い市場の洞察を求めるトレーダー向けに設計された強力なツールです。これらのエリアはボリュメトリックオーダーブロックとして知られており、サポートやレジスタンスの潜在的ゾーンとして機能し、取引の意思決定において重要な優位性を提供します。 MT5バージョンを見る:   Volumetric Order Blocks MT5 Multi Timeframe See more products at:   https://www.mql5.com/en
Special offer : ALL TOOLS , just $35 each! New tools   will be   $30   for the   first week   or the   first 3 purchases !  Trading Tools Channel on MQL5 : Join my MQL5 channel to update the latest news from me AI Channels インジケーターは、クラスタリング分析における強力な機械学習技術である ローリングK-平均クラスタリング を使用して、価格の基礎的なトレンドについてリアルタイムの洞察を提供します。このインジケーターは、クラスタ化された価格データに基づいた適応チャネルを作成し、トレーダーがトレンド方向や市場の状況について情報に基づいた判断を下せるようにします。 インジケーターにはリスク管理に柔軟性を持たせるため、 トレーリングストップオプション も設定内に含まれています。 MT4バージョンを見る:   AI Channels MT4 他の製品を見る:     すべて
FREE
Special offer : ALL TOOLS , just $35 each! New tools   will be   $30   for the   first week   or the   first 3 purchases !  Trading Tools Channel on MQL5 : Join my MQL5 channel to update the latest news from me Follow Line とスキャナーを使って、ボラティリティに基づいた高度なインジケーターでトレーディングエッジを最大限に活用しましょう。このツールは、カスタマイズ可能な設定とともに、ボリンジャーバンドの力を組み合わせ、価格の動きについて正確な洞察を提供します。 See more MT5 version at:   Follow Line MT5 with Scanner See more products at:   https://www.mql5.com/en/users/ndhsfy/seller Follow Line の鍵は、価格が 1 標準偏差に設定された
FREE
Special offer : ALL TOOLS , just $35 each! New tools   will be   $30   for the   first week   or the   first 3 purchases !  Trading Tools Channel on MQL5 : Join my MQL5 channel to update the latest news from me ダイナミックな金融市場では、トレンド反転のシグナルを識別することが効果的な取引に不可欠です。RSI Divergence Scannerは、さまざまな通貨ペアと時間枠にわたるRSIのダイバージェンスシグナルを正確かつ効率的に検出するために設計されています。 MT4バージョンの詳細はこちら:    RSI Divergence MT4 Scanner その他の製品は以下をご覧ください:   すべての 製品 1. RSIダイバージェンスの理解 RSI(相対力指数) は、価格のモメンタムを測定するテクニカル指標であり、トレーダーによく利用されています。RSIダイバージェンスは
FREE
Special offer : ALL TOOLS , just $35 each! New tools   will be   $30   for the   first week   or the   first 3 purchases !  Trading Tools Channel on MQL5 : Join my MQL5 channel to update the latest news from me ダイナミックな金融市場では、トレンド反転のシグナルを識別することが効果的な取引に不可欠です。RSI Divergence Scannerは、さまざまな通貨ペアと時間枠にわたるRSIのダイバージェンスシグナルを正確かつ効率的に検出するために設計されています。 MT5バージョンの詳細はこちら:    RSI Divergence MT5 Scanner その他の製品は以下をご覧ください:   すべての 製品 1. RSIダイバージェンスの理解 RSI(相対力指数) は、価格のモメンタムを測定するテクニカル指標であり、トレーダーによく利用されています。RSIダイバージェンスは
FREE
Special offer : ALL TOOLS , just $35 each! New tools   will be   $30   for the   first week   or the   first 3 purchases !  Trading Tools Channel on MQL5 : Join my MQL5 channel to update the latest news from me 用の画期的な RSI Kernel Optimized with Scanner をご紹介します。この最先端ツールは、強力なカーネル密度推定 (KDE) アルゴリズムを統合することで、従来の RSI 分析を再定義します。この高度なインジケーターは、リアルタイムでの市場トレンドのインサイトを提供するだけでなく、複数の通貨ペアや時間枠を同時にスキャンできるダッシュボードも備えています。このツールがトレードアーセナルに必須な理由をご紹介します。 See more MT5 version at:   RSI Kernel Optimized with Scanner for M
Special offer : ALL TOOLS , just $35 each! New tools   will be   $30   for the   first week   or the   first 3 purchases !  Trading Tools Channel on MQL5 : Join my MQL5 channel to update the latest news from me AI Channels インジケーターは、クラスタリング分析における強力な機械学習技術である ローリングK-平均クラスタリング を使用して、価格の基礎的なトレンドについてリアルタイムの洞察を提供します。このインジケーターは、クラスタ化された価格データに基づいた適応チャネルを作成し、トレーダーがトレンド方向や市場の状況について情報に基づいた判断を下せるようにします。 インジケーターにはリスク管理に柔軟性を持たせるため、 トレーリングストップオプション も設定内に含まれています。 MT5バージョンを見る:   AI Channels MT5 他の製品を見る:     すべて
FREE
Special offer : ALL TOOLS , just $35 each! New tools   will be   $30   for the   first week   or the   first 3 purchases !  Trading Tools Channel on MQL5 : Join my MQL5 channel to update the latest news from me Liquidity Pools インジケーターは、チャート上の潜在的な流動性ゾーンを、高頻度でウィックが触れる高安領域と、それぞれのゾーンでの再訪回数および取引量を分析することによって特定し、マークする高度なツールです。このツールは、流動性が集積される市場のダイナミクスをトレーダーに提供し、潜在的な転換点を予測し、重要なサポートおよびレジスタンスレベルを特定するのに役立ちます。 MT5バージョンはこちら:   Liquidity Pools MT5 他の製品はこちら:   全製品 主な機能と利点 1. 正確な流動性ゾーンの特定 高影響ゾーンのハイライト: Liquidi
Special offer : ALL TOOLS , just $35 each! New tools   will be   $30   for the   first week   or the   first 3 purchases !  Trading Tools Channel on MQL5 : Join my MQL5 channel to update the latest news from me Volumatic VIDYA (Variable Index Dynamic Average) は、トレンドを追跡し、トレンドの各フェーズ内での買い圧力と売り圧力を分析するために設計された高度なインジケーターです。可変インデックス動的平均 (Variable Index Dynamic Average) をコアの動的平滑化技術として利用することで、このツールは、価格とボリュームのダイナミクスに関する重要な洞察を、市場構造の重要なレベルで提供します。 MT4バージョンを見る:  Volumatic VIDyA MT4 他の製品を見る:   全製品 To use iCus
Special offer : ALL TOOLS , just $35 each! New tools   will be   $30   for the   first week   or the   first 3 purchases !  Trading Tools Channel on MQL5 : Join my MQL5 channel to update the latest news from me Trendlines with Breaks Scanner は、トレーダーが重要なトレンドを特定し、リアルタイムでブレイクアウトを検出するのを支援するために設計された最先端の取引ツールです。ピボットポイントに基づいて自動生成されたトレンドラインを使用することで、このインジケーターはトレーダーが精度と自信を持って取引の機会を活用できるようにします。 MT4バージョンを見る:  Trendlines with Breaks Scanner MT4 他の製品を見る:   All Products 主な機能 1. リアルタイムのブレイクアウト検出 ブレイクアウトアラート: 価
Special offer : ALL TOOLS , just $35 each! New tools   will be   $30   for the   first week   or the   first 3 purchases !  Trading Tools Channel on MQL5 : Join my MQL5 channel to update the latest news from me SuperTrend by Kivanc Ozbilgic with Scanner をご紹介します。これは、マーケットトレンドに先んじるための多機能で強力なツールで、カスタマイズ可能な機能とリアルタイムのアラートが備わっています ATR の計算方法は、柔軟に対応するために RMA (相対移動平均)と SMA (単純移動平均)から選べます。デフォルト設定では、 ATR 期間が10、乗数が3に設定されており、 SuperTrend は効率的に買いと売りのシグナルを識別します。 組み込みのスキャナーとアラートシステムは、複数の通貨ペアやタイムフレームを監視し、リアルタイムの
FREE
Special offer : ALL TOOLS , just $35 each! New tools   will be   $30   for the   first week   or the   first 3 purchases !  Trading Tools Channel on MQL5 : Join my MQL5 channel to update the latest news from me 概要 OA SnR Powerは、サポートおよびレジスタンスレベルの強度を識別して評価するために設計された強力なツールです。取引量、反発頻度、再テスト回数などの重要な要素を組み込むことで、このインジケーターは市場の重要な価格ゾーンを包括的に可視化します。 その他の製品を見る:   すべての 製品 OA SnR Powerの仕組み 高値と安値の特定 このインジケーターは、ローカル高値と安値を計算するための高度なアルゴリズムを使用します。 ユーザーはゾーン幅の設定を調整でき、サポートおよびレジスタンスの潜在的なレベルを正確に検出します。 主要レベルのフィルタリングと統合
FREE
Special offer : ALL TOOLS , just $35 each! New tools   will be   $30   for the   first week   or the   first 3 purchases !  Trading Tools Channel on MQL5 : Join my MQL5 channel to update the latest news from me まずは優れた機能から始めましょう: EA にはニュース フィルターと RSI フィルターが搭載されています。 低リスク (一部の通貨ペアのドローダウンは 10% 未満、5% の場合もあります)。 この EA はマーチンゲールやグリッド機能を使用しません。 EA は必要に応じて手動取引用のビジュアル ゾーンを表示できます。 まず、EA を完全に理解するには、リンクの詳細な手順をお読みください: スキャルピング EA ブレイクアウト トップとボット MT5 の詳細な紹介 このEAを購入する前に、EAがお手伝いできるかどうかを確認するためにデモをダウンロードしてください。 S
Special offer : ALL TOOLS , just $35 each! New tools   will be   $30   for the   first week   or the   first 3 purchases !  Trading Tools Channel on MQL5 : Join my MQL5 channel to update the latest news from me Fibonacci Confluence Toolkit Multi-Timeframe は、プロのトレーダー向けに設計された高度な技術的分析ツールで、主要な市場シグナルとパターンを組み合わせて潜在的な価格反転ゾーンを特定するのに役立ちます。タイムフレームセレクターのダッシュボードを通じたマルチタイムフレーム表示機能により、このツールキットは市場のダイナミクスを包括的かつ洞察に満ちた視点で提供し、正確かつタイムリーなトレーディング判断を可能にします。 MT4バージョンの詳細は:  Fibonacci Confluence Toolkit MT4 Multi Timefr
Special offer : ALL TOOLS , just $35 each! New tools   will be   $30   for the   first week   or the   first 3 purchases !  Trading Tools Channel on MQL5 : Join my MQL5 channel to update the latest news from me 絶えず変化する金融取引の世界では、サポートとレジスタンスレベルを正確に識別し分析することが、情報に基づいた投資判断を下すために不可欠です。 SnR Retest and Break Multi-Timeframe は、取引分析を強化するために設計されたサポートとレジスタンスのインジケーターです。革新的な Timeframe Selector 機能を利用して、このツールは複数のタイムフレームにわたる市場動向の包括的なビューを提供し、正確な取引選択を支援します。 詳細なMT4バージョンはこちら:  SnR Retest and Break MT4 Multi Timefra
Special offer : ALL TOOLS , just $35 each! New tools   will be   $30   for the   first week   or the   first 3 purchases !  Trading Tools Channel on MQL5 : Join my MQL5 channel to update the latest news from me MT5 用の画期的な RSI Kernel Optimized with Scanner をご紹介します。この最先端ツールは、強力なカーネル密度推定 (KDE) アルゴリズムを統合することで、従来の RSI 分析を再定義します。この高度なインジケーターは、リアルタイムでの市場トレンドのインサイトを提供するだけでなく、複数の通貨ペアや時間枠を同時にスキャンできるダッシュボードも備えています。このツールがトレードアーセナルに必須な理由をご紹介します。 See more MT4 version at:  RSI Kernel Optimized MT4 with Scanne
Special offer : ALL TOOLS , just $35 each! New tools   will be   $30   for the   first week   or the   first 3 purchases !  Trading Tools Channel on MQL5 : Join my MQL5 channel to update the latest news from me ICTの 反転フェアバリューギャップ (IFVG) の概念を活用した Inversion Fair Value Gaps Indicator でその力を解放しましょう!この最新ツールは、フェアバリューギャップ (FVG) を次のレベルに引き上げ、反転したFVGゾーンを特定して表示します。これらは、価格修正後に形成される重要なサポートおよびレジスタンスエリアです。スキャルパー、スイングトレーダー、長期投資家のいずれであっても、IFVGインジケーターはリアルタイムでの意思決定にとって貴重な洞察を提供します。 MT5バージョンはこちら:   Inversion Fair Va
Special offer : ALL TOOLS , just $35 each! New tools   will be   $30   for the   first week   or the   first 3 purchases !  Trading Tools Channel on MQL5 : Join my MQL5 channel to update the latest news from me ICTの 反転フェアバリューギャップ (IFVG) の概念を活用した Inversion Fair Value Gaps Indicator でその力を解放しましょう!この最新ツールは、フェアバリューギャップ (FVG) を次のレベルに引き上げ、反転したFVGゾーンを特定して表示します。これらは、価格修正後に形成される重要なサポートおよびレジスタンスエリアです。スキャルパー、スイングトレーダー、長期投資家のいずれであっても、IFVGインジケーターはリアルタイムでの意思決定にとって貴重な洞察を提供します。 MT4バージョンはこちら:  Inversion Fair Val
フィルタ:
レビューなし
レビューに返信