Volume Zones Internal Visualizer MT5 Multi TF

Oferta especial: ALL TOOLS , apenas $35 cada!

New tools will be $30 for the first week or the first 3 purchases

Trading Tools Channel on MQL5: Join my MQL5 channel to update the latest news from me

Volume Zones Internal Visualizer Multi-Timeframe – A solução definitiva para obter uma visão detalhada da atividade de volume em timeframes inferiores enquanto negocia em um gráfico de timeframe superior. Se você está procurando uma ferramenta de análise de volume poderosa e intuitiva, com suporte a múltiplos timeframes, este é o produto ideal para você!

Veja mais versão MT4 em:  Volume Zones Internal Visualizer MT4 Multi TF

Veja mais produtos em:  All Products

Why Choose Volume Zones Internal Visualizer Multi-Timeframe?
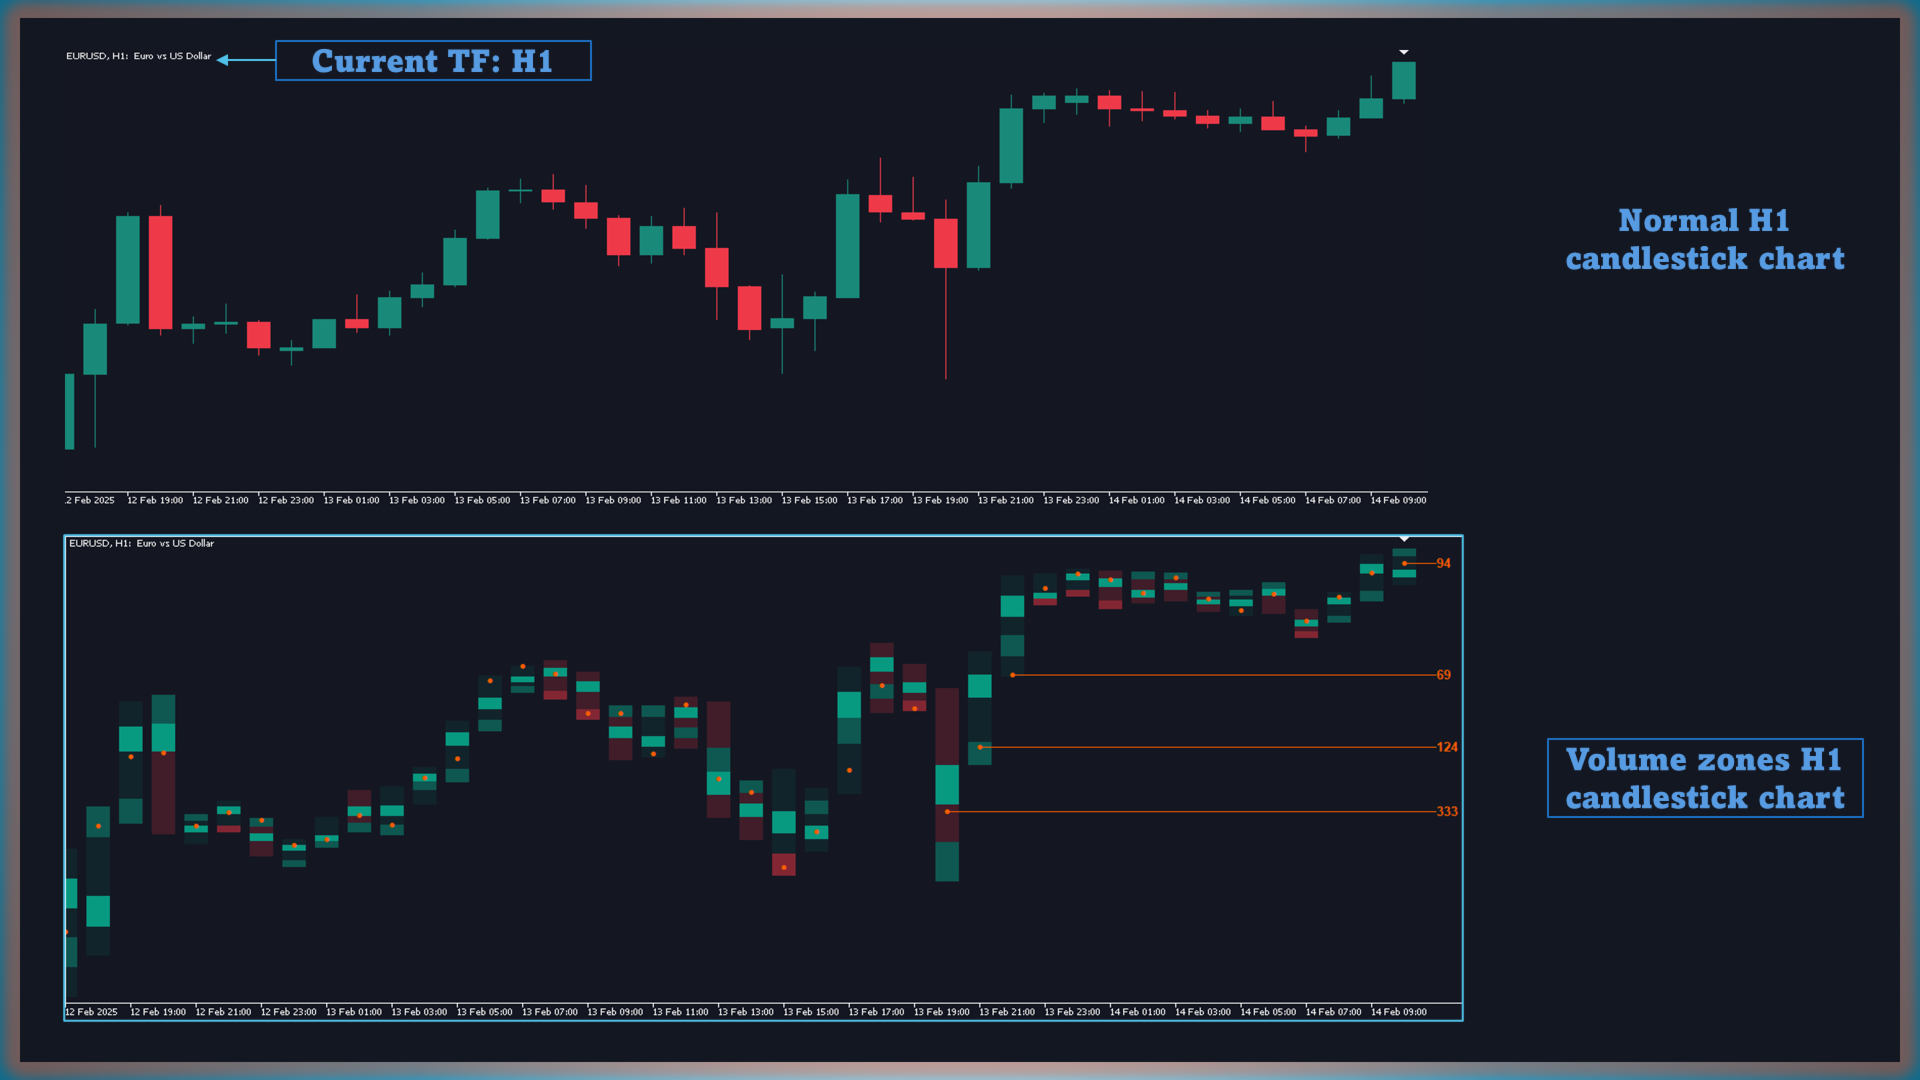
  1. Exibe o volume de timeframes menores em um gráfico de timeframe maior

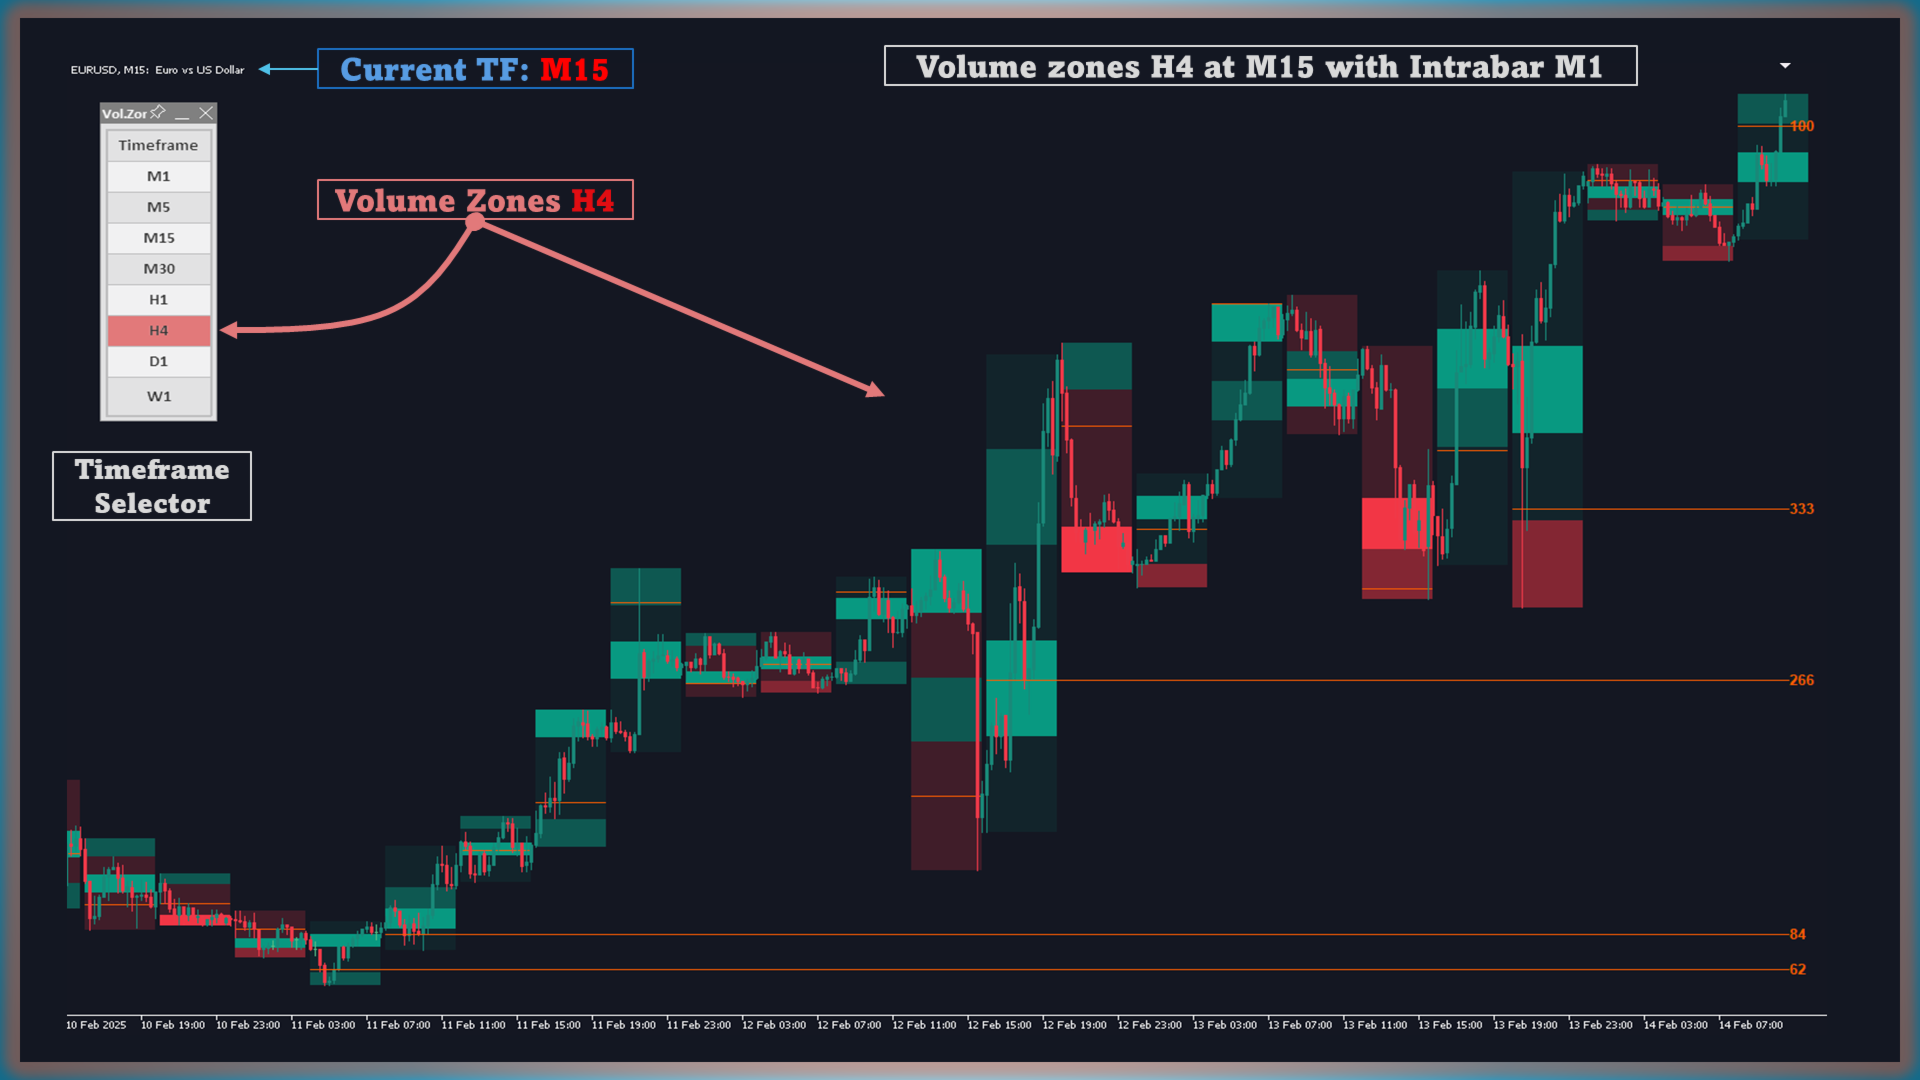
    • Este indicador oferece um estilo “alternate candle”, permitindo identificar rapidamente onde o volume se acumula em timeframes menores sem sair do gráfico de timeframe maior.
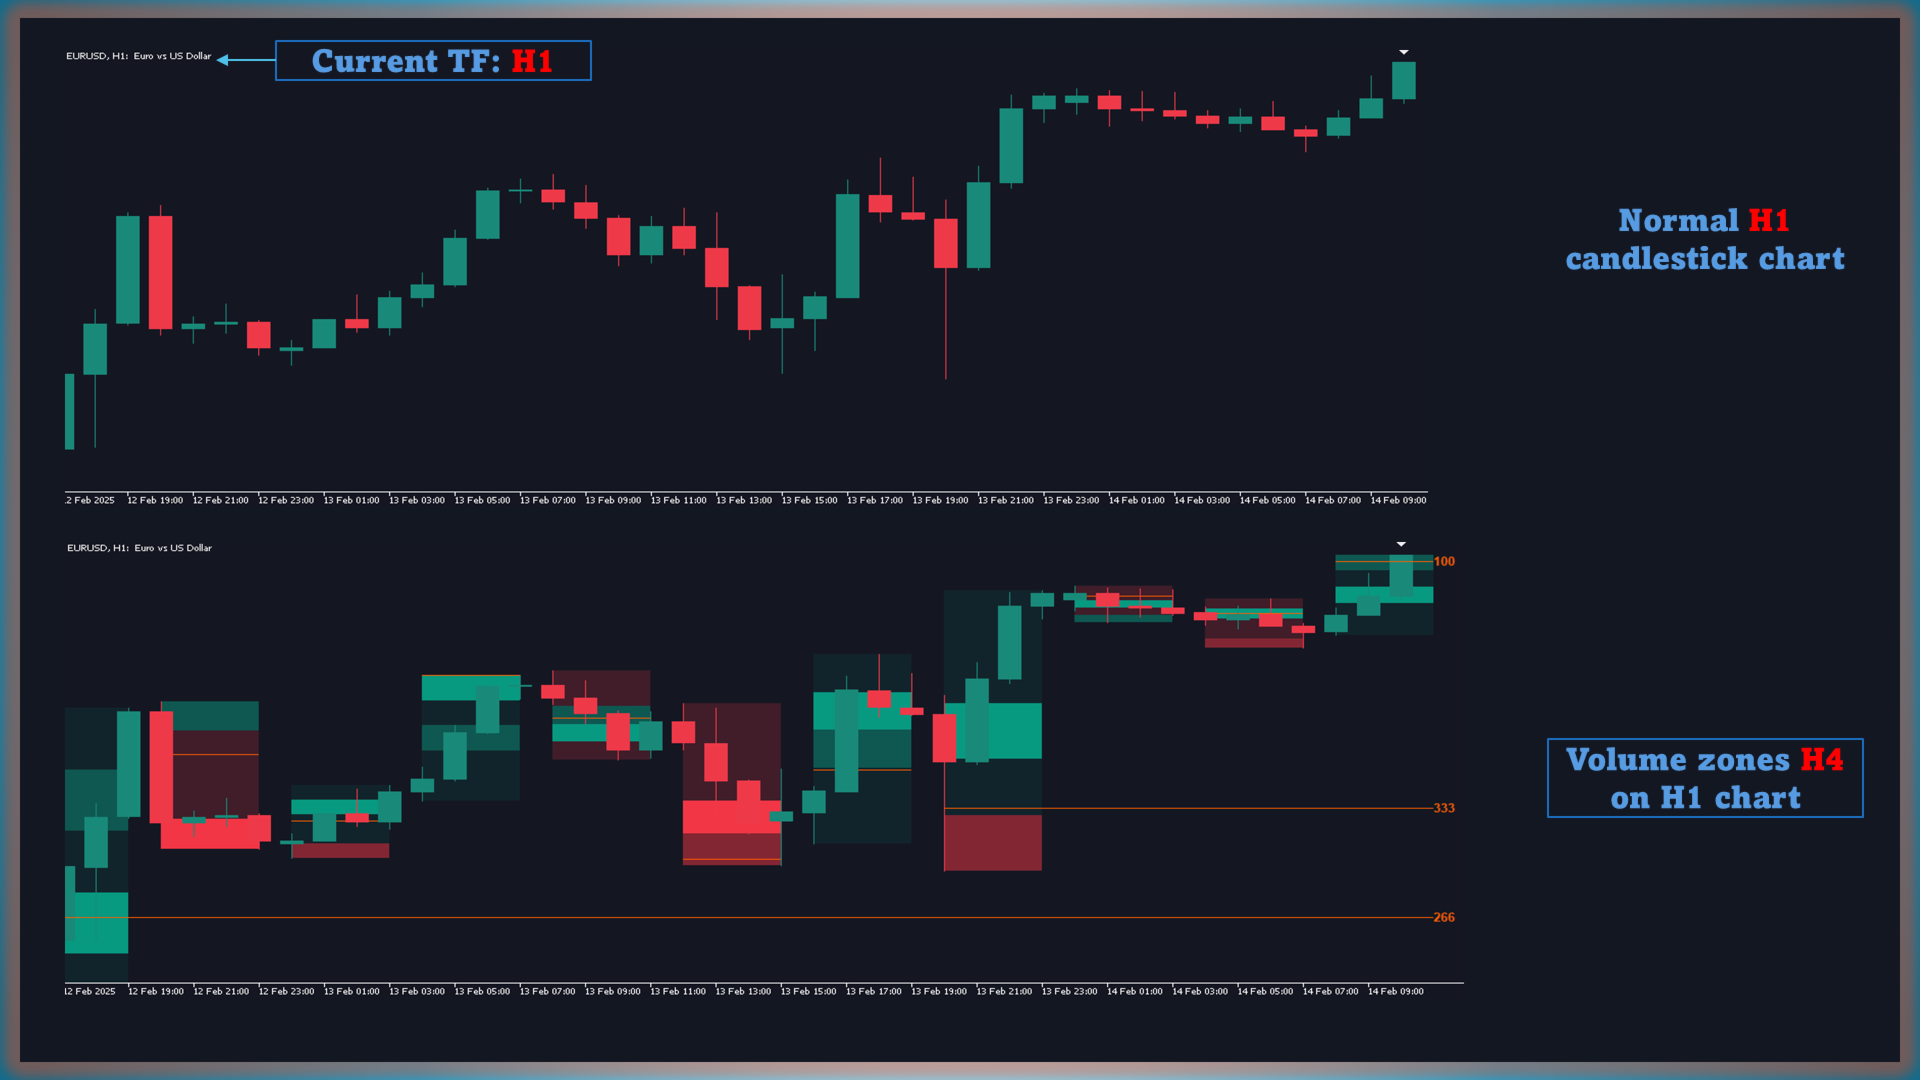
  2. Análise multi-timeframe

    • Com o recurso Intrabar Timeframe, você pode selecionar qual timeframe menor deseja monitorar (M1, M5, M15, etc.). Todos os dados de volume do timeframe menor são agregados e exibidos dentro de cada vela do timeframe maior para uma análise abrangente.
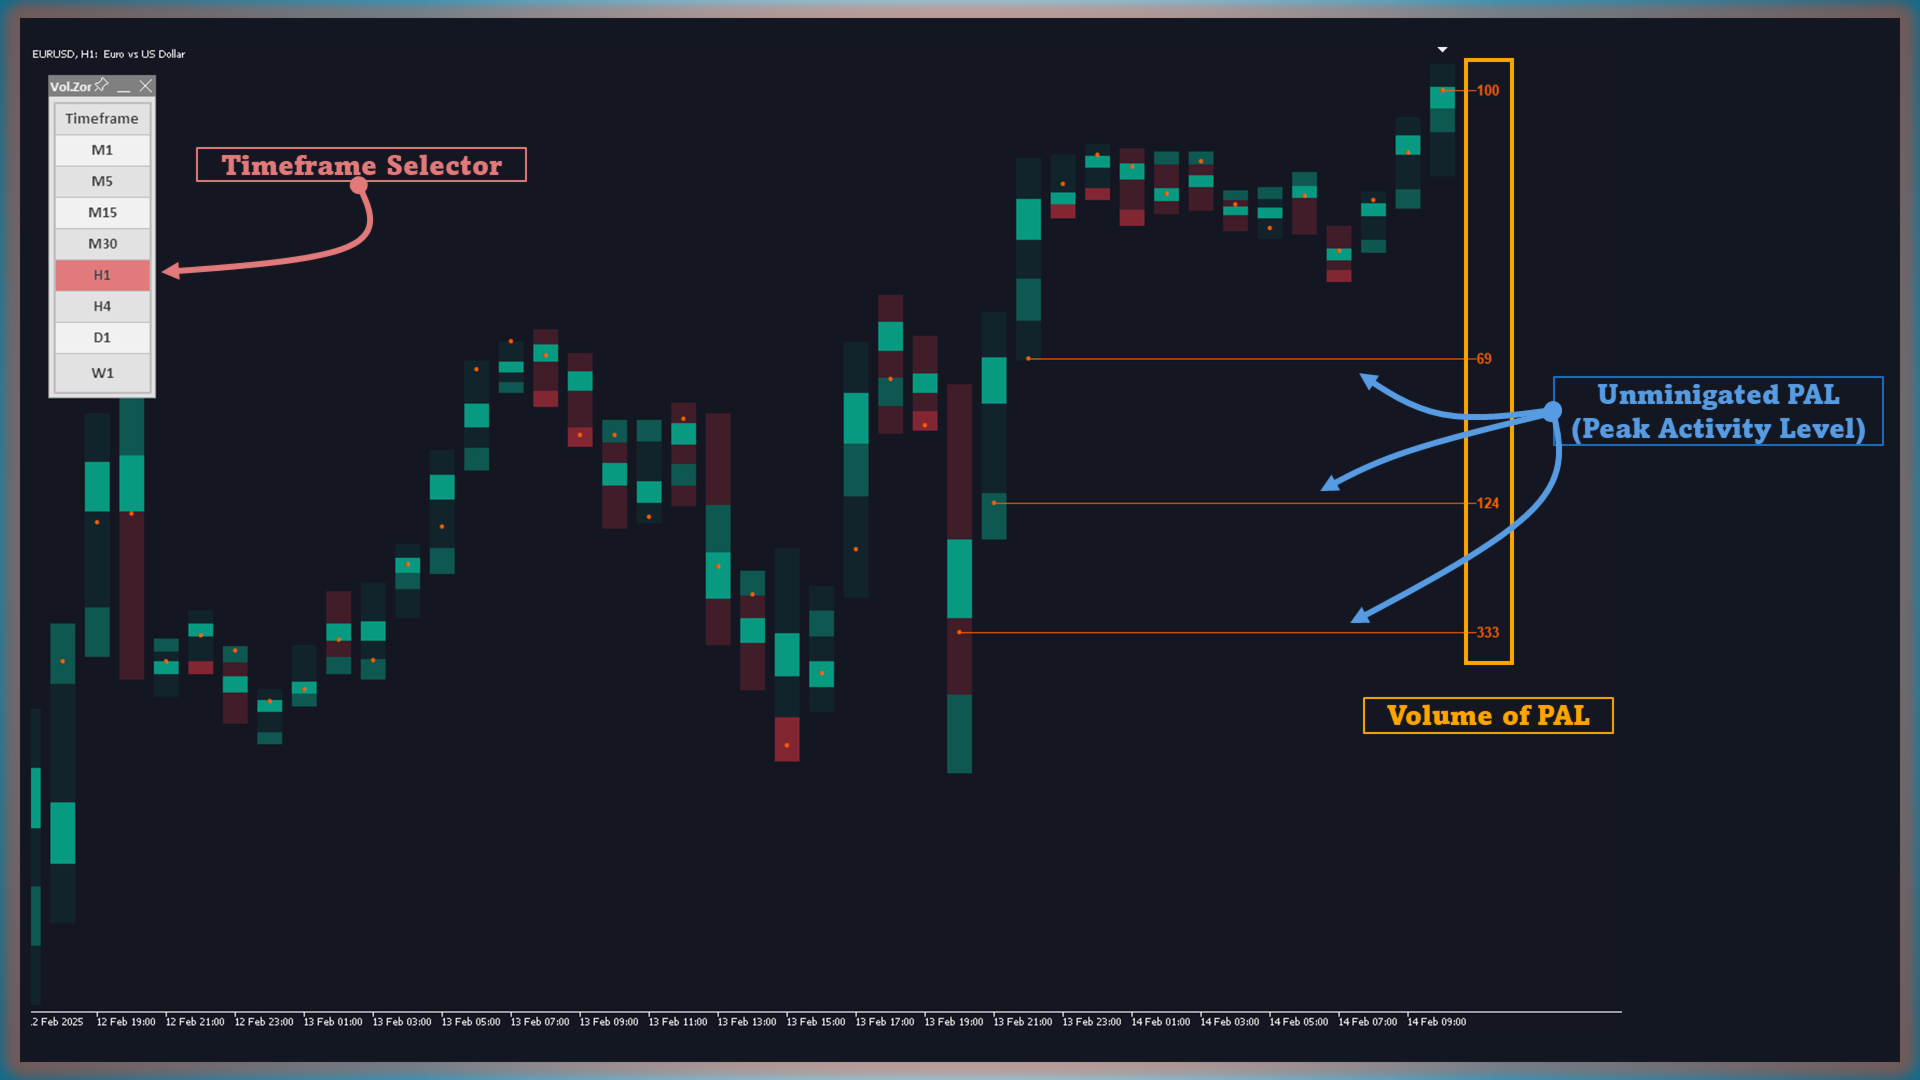
    • Com o recurso Timeframe Selector, você escolhe facilmente quais zonas de volume do timeframe maior deseja exibir em qualquer timeframe, por exemplo, é possível exibir zonas de volume de H4 em M15 com Intrabar M1 (veja a captura de tela para mais detalhes)
  3. Descubra o “Nível de Atividade de Pico” (PAL)

    • O indicador identifica automaticamente a vela do timeframe menor com o maior volume. O fechamento dessa vela é marcado como PAL, um nível crítico que acumulou o maior volume durante a sessão da vela do timeframe maior.
    • Cada PAL se estende para o futuro até ser “cruzado” ou “mitigado”, destacando possíveis oportunidades de entrada ou saída.
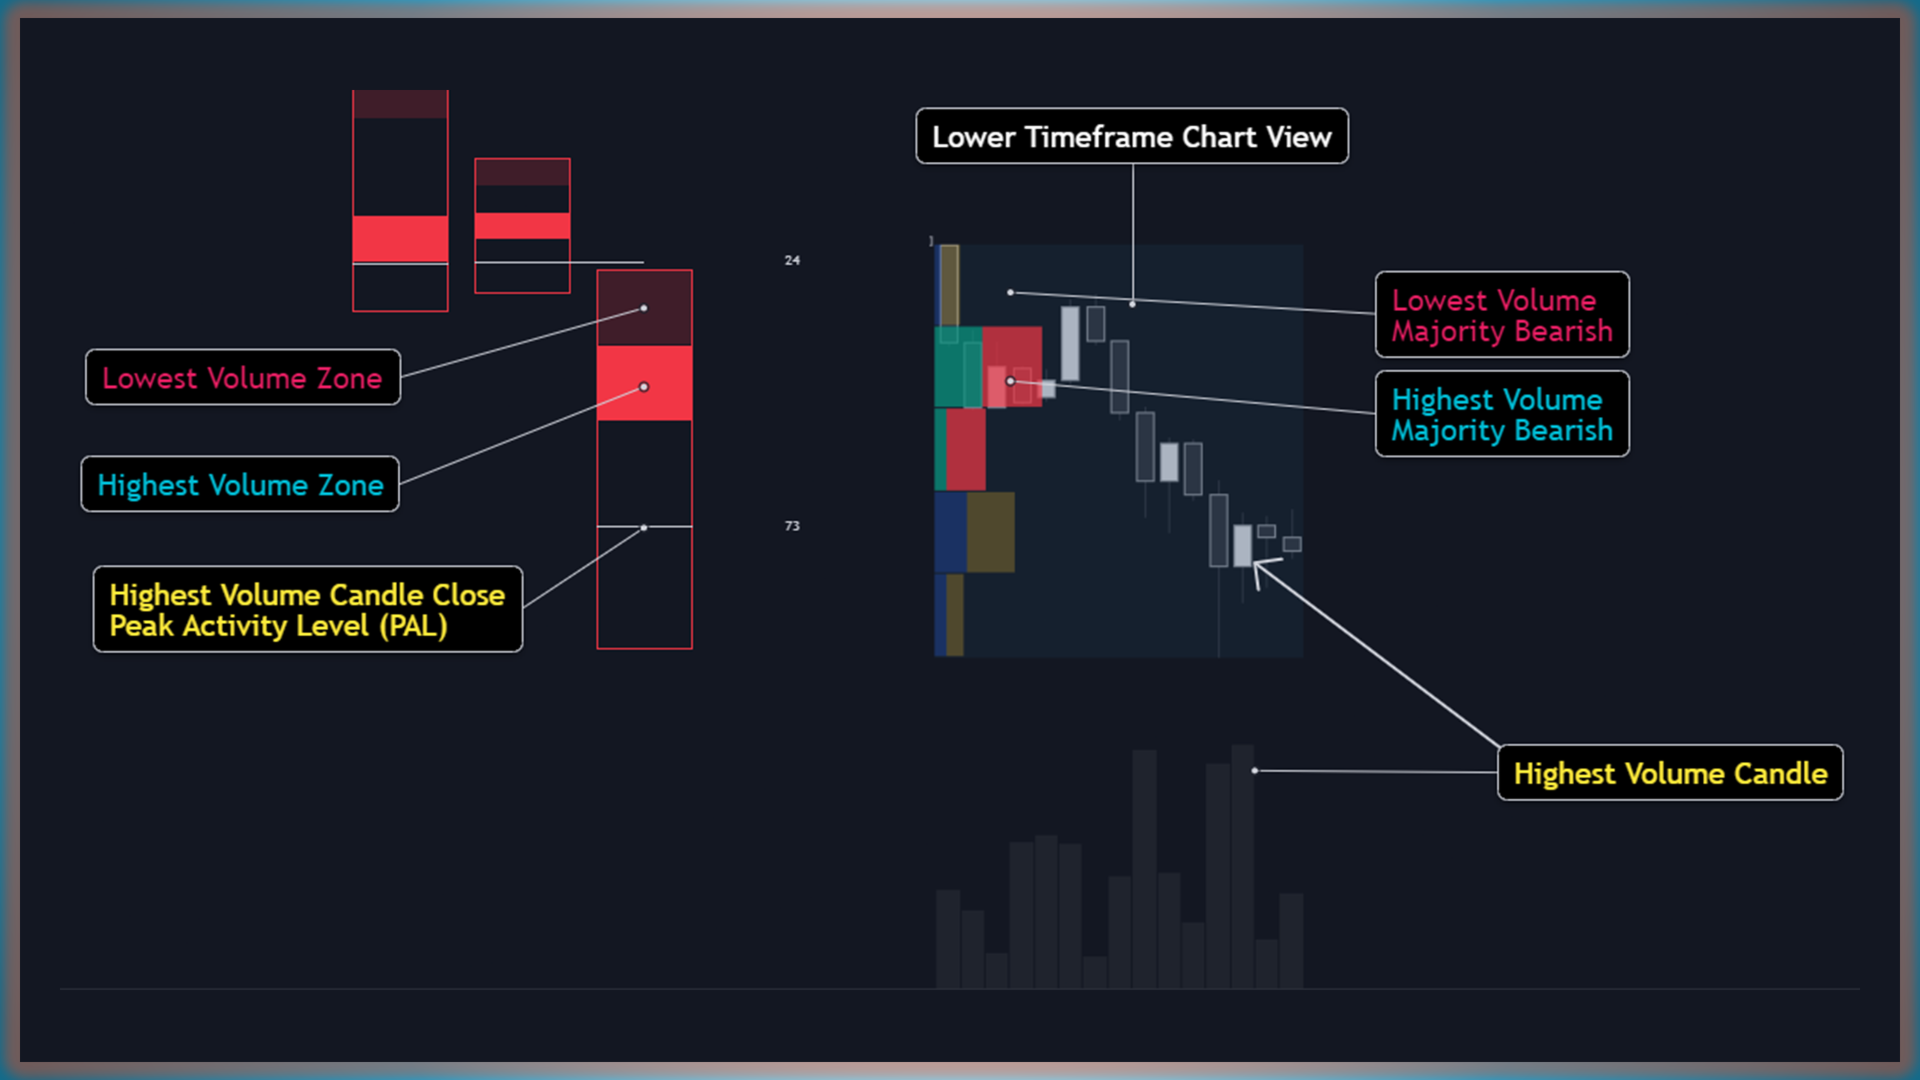
  4. Identifique as Zonas de Maior e Menor Volume

    • Construindo um Volume Profile a partir de dados de timeframes menores, o indicador localiza duas áreas cruciais:
      • Highest Volume Zone: Representa o pico de acumulação de volume.
      • Lowest Volume Zone: Ilustra onde houve volume menor (mas ainda significativo).
How to Use
  1. Configurar o Intrabar Timeframe

    • Escolha qual timeframe menor (M1, M5, M15, etc.) deseja acompanhar, de acordo com seu estilo de negociação.
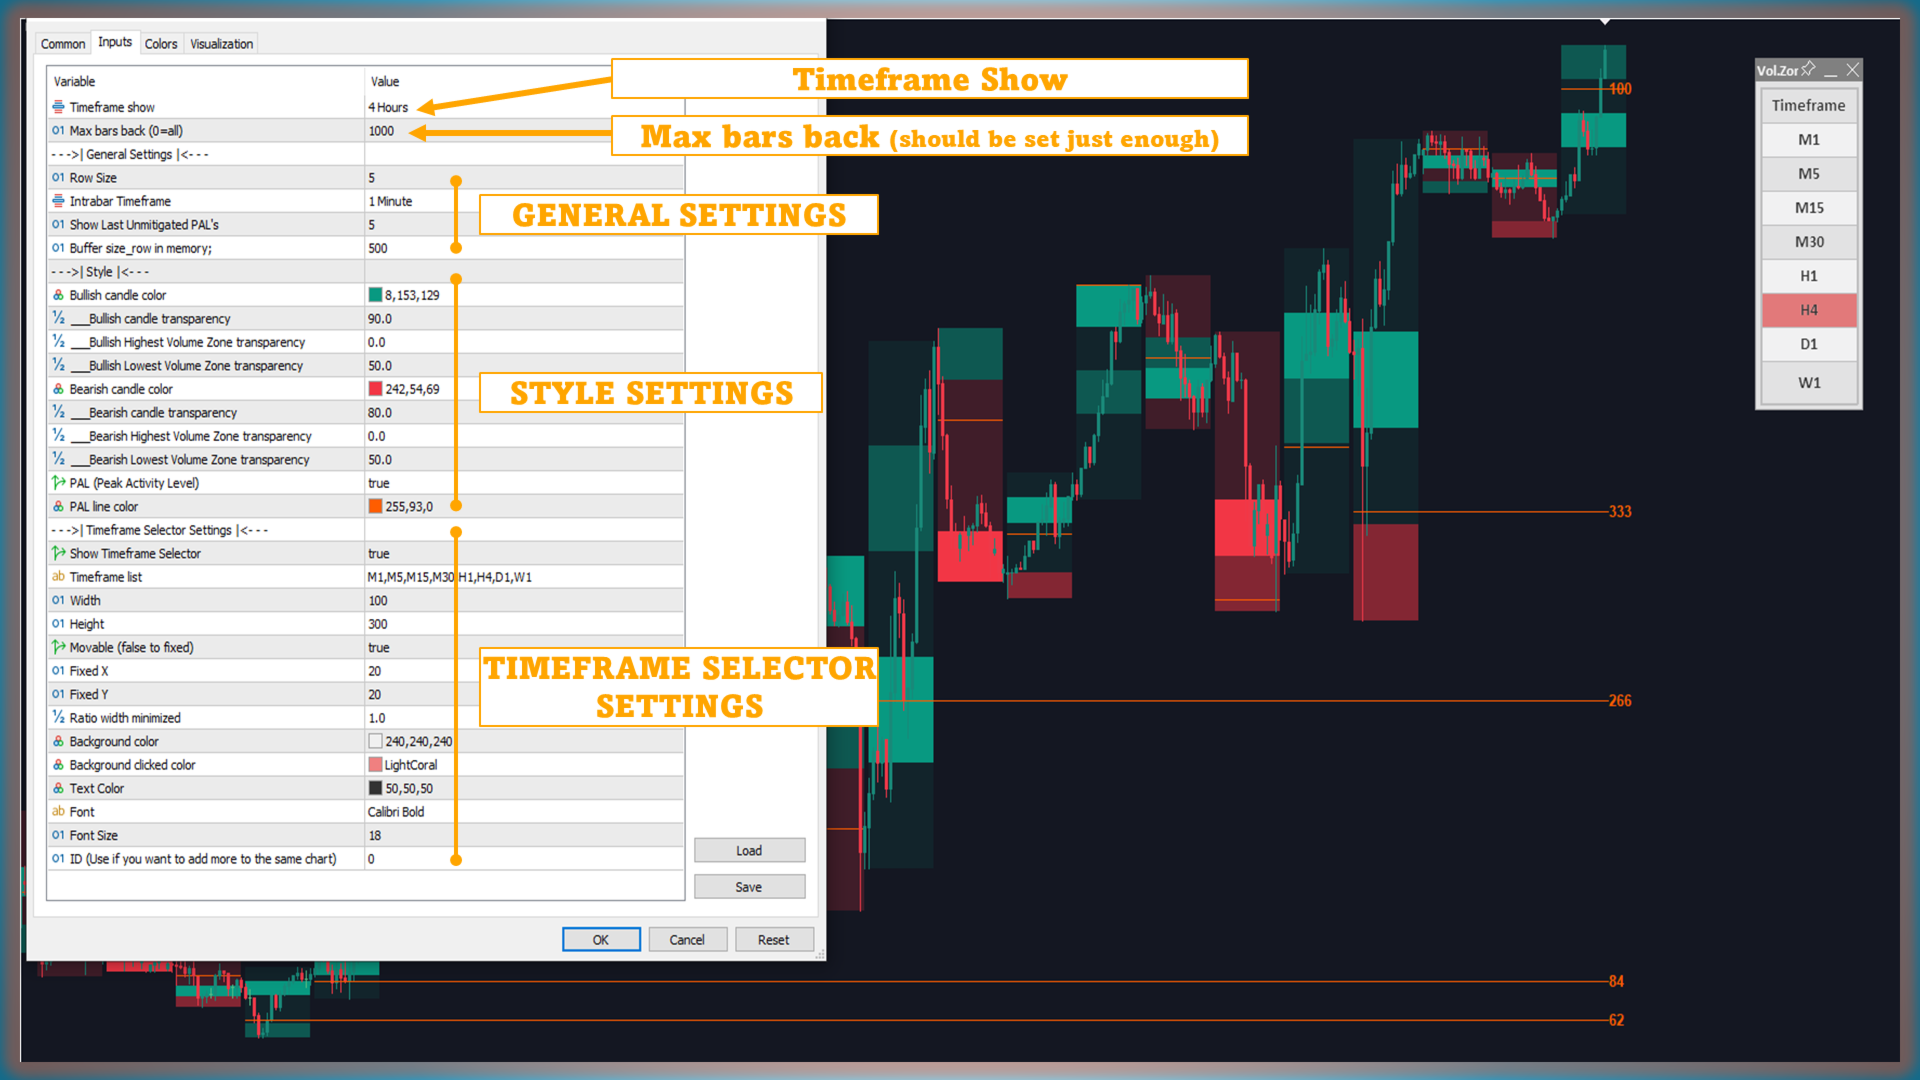
  2. Configurações Multi-Timeframe

    • Você pode especificar o timeframe para exibir zonas de volume através do parâmetro "Timeframe Show", ou usar o Timeframe Selector, e então ocultar/exibir zonas de volume em diferentes timeframes conforme a necessidade.
  3. Interpretando a Exibição

    • Box: Mostra o intervalo total (High a Low) da vela do timeframe maior.
    • Lowest Volume Zone: Destaca a região de menor volume dentro da sessão da vela.
    • Highest Volume Zone: Marca a região de maior volume, essencial para identificar a atividade principal.
    • Line/dot: Representa o preço de fechamento da vela do timeframe menor que continha o maior volume (o PAL).
  4. Acompanhar e Reagir ao PAL

    • As linhas do PAL são projetadas no movimento futuro de preços, muitas vezes atuando como suportes ou resistências dinâmicas.
    • Uma vez que um PAL é “cruzado” ou “resolvido”, a linha desaparece automaticamente, mantendo o seu gráfico limpo.
Technical Details
  • Volume Profile com “Row Size”

    • O volume agregado dos timeframes menores é usado para construir o perfil de volume. Um “Row Size” maior fornece uma visão mais granular da distribuição de volume.
  • Detecção Automática de Zonas de Volume Alto e Baixo

    • Após a construção do perfil de volume, o indicador destaca automaticamente a zona com o maior volume (sólida) e uma zona de volume menor (transparente).
  • Escalável e Personalizável

    • Show Last Unmitigated PALs: Configure quantos PALs ainda não cruzados você deseja ver.
    • Style & Colors: Ajuste a exibição das zonas, a aparência das linhas e o esquema de cores de acordo com sua preferência.
Settings
  1. Row Size

    • Define quantas linhas usar ao criar o perfil de volume a partir dos dados dos timeframes menores.
  2. Intrabar Timeframe

    • Selecione qual timeframe menor (por exemplo, M1, M5, M15) o indicador deve se basear.
  3. Show Last Unmitigated PALs

    • Escolha quantas linhas PAL não rompidas você deseja manter visíveis no gráfico.
  4. Style

    • Habilite/desabilite vários recursos do indicador e personalize cores e níveis de transparência.
  5. Multi-Timeframe
    • Especifique o timeframe maior para exibir
    • Configurações do Timeframe Selector

Conclusion

Com Volume Zones Internal Visualizer Multi-Timeframe, você obtém uma nova perspectiva sobre o volume de mercado, identificando zonas críticas com precisão. A capacidade de incorporar dados de volume de timeframes menores em uma sessão de timeframe maior economiza tempo e aprimora suas decisões de negociação.

Produtos recomendados
Multi-timeframe trend indicator based on the ADX / ADXWilder indicator with Fibonacci levels The indicator shows trend areas using ADX or ADXWilder indicator data from multiple timeframes. The impulse mode of the indicator allows you to catch the beginning of a trend, and several "Screens" with different timeframes allow you to filter out market noise. Fibonacci levels are added to the price chart, which have flexible settings. How the indicator works: if PDI is greater than NDI, then   it`s
FREE
Raymond Cloudy Day Indicator for MT5 – Pivot-Based Reversal and Trend Levels Raymond Cloudy Day Indicator is a pivot-based level indicator for MetaTrader 5 (MT5). It was developed by Ngo The Hung based on Raymond’s original idea and is designed to give a structured view of potential reversal zones, trend extensions and support/resistance levels directly on the chart. The default settings are optimised for XAUUSD on the H1 timeframe, but the indicator can be tested and adjusted for other symbols
FREE
Phoenix Momentum 5 Star
Nigel Nii Darku Narnor Darko
This indicator, "Phoenix Volume Amazing", is a sophisticated Volume Delta and Order Flow Dashboard. Unlike standard volume indicators that only show total activity, this tool dissects the internal "tug-of-war" between buyers and sellers in real-time. Core Functionality The indicator calculates Delta (the difference between buying volume and selling volume) to provide a "under the hood" look at market sentiment. It uses a custom-built GUI (Graphical User Interface) panel to display these metrics
FREE
Swiss VWAPsimple
Terence Gronowski
4.8 (5)
Swiss VWAPsimple Motivation Did not find free VWAP that works, the one that I found craseh. So I created a VWAP which calculates values only for the actual day. So computer resouces are not over stressed. What is VWAP, how is it used?  VWAP stands for Volume Weighed Average Price, it calculates the running sum of tick volume and the runnung sum of price times tickvolume. The division of these sums result in a weighed price (Sum P*V/Sum V). The calculation starts normally at midnight. The values
FREE
Indicator Description 4 Hull MA Color + Envelopes is a powerful trend-following indicator for MetaTrader 5 that combines four Hull Moving Averages (HMA) with Moving Average Envelopes to clearly identify market direction, trend strength, and potential reversal or pullback zones. This indicator is designed to reduce noise, react quickly to price movement, and provide a clean visual structure for professional trading.   Key Features   4 Hull Moving Averages (20, 50, 100, 200) Automatic color change
FREE
Important Lines
Terence Gronowski
4.88 (24)
This indicator displays Pivot-Lines, preday high and low, preday close and the minimum and maximum of the previous hour. You just have to put this single indicator to the chart to have all these important lines, no need to setup many single indicators. Why certain lines are important Preday high and low : These are watched by traders who trade in a daily chart. Very often, if price climbs over or falls under a preday low/high there is an acceleration in buying/selling. It is a breakout out of a
FREE
This is a free version of the indicator, the period between the vertical lines is always 30 bars. In the paid version the period can be set by user, so a configuration with many ThreePointsChannel indicators with different periods is possible. The principle of construction - on top of any number of bars set by the user, a channel is constructed with maximum and minimum lines so that the bars touch the maximum and minimum of the channel at exactly three points. The name of the indicator follows
FREE
Trend indicator based on the ADX / ADXWilder indicator The indicator shows trend areas using ADX or ADXWilder indicator data. How the indicator works: if PDI is greater than NDI, then it`s bullish movement; if PDI is less than NDI, then it`s bearish movement; if ADX is less than or equal to the filter value specified in the parameters, then there is no movement state. Input parameters of the indicator: Calculate Timeframe - timeframe for calculation; ADX Type - type of ADX calculation based
FREE
O indicador identifica quando ocorre uma divergência entre o preço e um indicador ou oscilador. Ele identifica divergências regulares e ocultas. Combinado com suas próprias regras e técnicas, este indicador permitirá que você crie (ou aprimore) seu próprio sistema poderoso. Recursos Pode detectar divergências para os seguintes osciladores / indicadores:       MACD, OsMA, Stochastics, RSI, CCI, RVI, Awesome, ADX, ATR, OBV, Índice composto, MFI e Momentum. Apenas um oscilador / indicador pode ser
FREE
Follow The Line MT5
Oliver Gideon Amofa Appiah
4.6 (35)
This indicator obeys the popular maxim that: "THE TREND IS YOUR FRIEND" It paints a GREEN line for BUY and also paints a RED line for SELL. (you can change the colors). It gives alarms and alerts of all kinds. IT DOES NOT REPAINT and can be used for all currency pairs and timeframes. Yes, as easy and simple as that. Even a newbie can use it to make great and reliable trades. NB: For best results, get my other premium indicators for more powerful and reliable signals. Get them here: https://www.m
FREE
Support Resistance Channels - Trading Guide *** Group support:  https://www.mql5.com/en/channels/vuongphamtrading Overview The Support Resistance Channels indicator automatically identifies and displays the strongest support and resistance zones based on pivot points. Unlike simple horizontal lines, this indicator creates channels (zones) which better represent real market behavior where support and resistance act as areas rather than precise levels. Key Features Automatic Detection : Identifie
FREE
Automatic Trendlines
Pasi Hakamaki
4.69 (49)
O indicador desenha linhas de tendência no gráfico. Este indicador possui seis entradas. O usuário pode especificar rótulos alternativos para ambas as linhas. Se várias instâncias do indicador forem usadas, os rótulos devem ser diferentes. O usuário pode definir a largura e a cor das linhas e a profundidade que especifica quais picos significativos devem ser usados. Por exemplo, Depth = 10 define as linhas de tendência usando os picos e vales atuais que têm pelo menos 10 barras à direita e à esq
FREE
Donchian Channel DC is the indicator of Donchian Channels, that plots maximum and minimum values of a specific period, besides mean value line. It´s possible to configure simple period for analysis and the indicator will plot all three values. You can trade with this indicator as trend or reversal, according to each strategy. Do not let to test others indicators as soon as others expert advisors.
English VWAP Daily (Clean) is a simple and lightweight indicator that plots the classic Daily VWAP (Volume Weighted Average Price) directly on your MT5 chart. Features: Classic Daily VWAP calculation Supports real volume (if available) or tick volume Timezone offset option to match your broker’s server time Weekend merge option (merge Saturday/Sunday data into Friday) Clean version → no arrows, no alerts, only VWAP line VWAP is widely used by institutional traders to identify fair value, su
FREE
Multi-timeframe trend indicator, based on the ADX / ADXWilder indicator The indicator shows trend areas using ADX or ADXWilder indicator data from multiple timeframes. The impulse mode of the indicator allows you to catch the beginning of a trend, and several "Screens" with different timeframes allow you to filter out market noise. How the indicator works: if PDI is greater than NDI, then it`s bullish movement; if PDI is less than NDI, then it`s bearish movement; to determine any trend, it is
FREE
Support and Ressistance
Raphael Lorenz Baumgartner
Suporte e Resistência do Último Dia Plataforma: MetaTrader 5 Tipo: Indicador personalizado Exibição: Janela do gráfico (sobreposição) Funções: Calcula zonas de suporte e resistência com base nos máximos e mínimos do dia anterior. Usa uma janela deslizante ( SampleWindowSize ) para detectar faixas de preço recentes. Detecta suporte quando a faixa de preços atual está abaixo dos extremos anteriores. Detecta resistência quando a faixa de preços está acima. Mostra quatro buffers: LDResistanceHigh –
FREE
Super Trend Strategy
Minh Khoa Nguyen
5 (3)
The SuperTrend Strategy is a widely-used technical indicator based on the Average True Range (ATR), primarily employed as a trailing stop tool to identify prevailing market trends. The indicator is designed for ease of use while providing reliable insights into the current market trend. It operates based on two key parameters: the period and the multiplier . By default, it uses a period of 15  for the ATR calculation and a multiplier of 3 . The Average True Range (ATR) plays a crucial role in th
FREE
Harmonic Pattern Suite Pro Introduction Harmonic Pattern Suite Pro is an indicator designed to identify and display harmonic structures on the chart based on X-A-B-C-D sequences. Its purpose is to present pattern formations that meet geometric and proportional criteria, providing a clear visual representation directly on the chart. The indicator automates the detection process, removing the need for manual measurement of ratios and allowing the user to review the structural configuration withou
FREE
Pivot MT5
Dmitrij Isaenko
O indicador desenha linhas de suporte e resistência diárias no gráfico, bem como o nível de Pivot (nível de pivô). Adaptado para trabalhar em MT5 Parâmetros do indicador: DayBack - o número de dias para marcação de linhas; PPcolor - cor da linha Pivô; Espessura de espessura de linha PP; PPstyle - estilo de linha Pivot; Supp-color de linhas de suporte; Sstyle - estilo de linha de suporte; Swidth - espessura das linhas de suporte; Resistir - cor das linhas de resistência; Rstyle - estilo de lin
FREE
FVG Metrics
Kim Raphael Reitz
5 (1)
FVG Indicator (Current Timeframe Zones and Multi-Timeframe Count Panel) This indicator detects and draws Fair Value Gap zones on the current chart timeframe only. It also includes a multi-timeframe panel that shows how many active (unmitigated)  zones exist on selected timeframes. This indicator detects and draws Fair Value Gap zones on the current chart timeframe . It can also display a panel with the number of active zones on selected timeframes. The indicator shows bullish and bearish zone
FREE
Magic 7 Indicator
Marek Pawel Szczesny
5 (1)
Overview Magic 7 Indicator is a comprehensive MetaTrader 5 (MQL5) indicator that identifies seven different trading scenarios based on candlestick patterns and technical analysis. The indicator combines traditional price action patterns with modern concepts like Fair Value Gaps (FVG) to provide trading signals with precise entry points and stop loss levels. Features 7 Trading Scenarios : Each scenario identifies specific market conditions and trading opportunities Visual Signals : Clear buy/sell
FREE
Bollinger Bands B
Flavio Javier Jarabeck
4.25 (4)
John Bollinger created this indicator in 2010 as a way to read the original indicator (Bollinger Bands) in a more "technical" way, shown as an oscillator. The typical range of the Bollinger Bands %B is 0 - 0.5 - 1.0, where "0" represents the lower band, the "0.5" the middle band, and "1" the upper band. The line on the indicator represents the Closing prices. As simple as that. SETTINGS Bollinger Bands period of analysis Standard Deviation multiplier Shift Price type to be analyzed If you like
FREE
Mitimom
Danil Poletavkin
The indicator is based on Robert Miner's methodology described in his book "High probability trading strategies" and displays signals along with momentum of 2 timeframes. A Stochastic oscillator is used as a momentum indicator. The settings speak for themselves period_1 is the current timeframe, 'current' period_2 is indicated - the senior timeframe is 4 or 5 times larger than the current one. For example, if the current one is 5 minutes, then the older one will be 20 minutes The rest of the s
FREE
HMA Color with Alerts MT5
Pavel Zamoshnikov
4.75 (57)
Hull Moving Average (HMA) is well-deservedly popular among traders because of the effective averaging of market noise and a relatively small delay. The current MetaTrader 5 version changes its color when the movement direction changes. Sound and text signals are available. It also supports sending email and push messages. It is possible to trigger a signal on the current incomplete bar, although such a signal may be canceled before completion if conditions are no longer appropriate. One of the p
FREE
Free automatic Fibonacci is an indicator that automatically plots a Fibonacci retracement based on the number of bars you select on the BarsToScan setting in the indicator. The Fibonacci is automatically updated in real time as new highest and lowest values appears amongst the selected bars. You can select which level values to be displayed in the indicator settings. You can also select the color of the levels thus enabling the trader to be able to attach the indicator several times with differe
FREE
Dynamic Supply and Demand indicator automatically identifies and displays Supply and Demand Zones on your chart based on price action patterns and market structure.  These zones represent areas where institutional buying or selling pressure has historically occurred, making them key levels for potential price reactions. This form of indicator takes inspiration from ICT as well as traditional Support & Resistance formation. **For the first 50 candles (number depends on LookBackCandles) when indic
FREE
This is a regression tree indicator for MT4/MT5. This indicator classificate nodes on the time period so that the deviation becomes smaller, and displays regression line and channel for each node. It's free! Attached CartDemo.ex4 and CartDemo.ex5 is a Demo version and has the following limitations: Can't use HighSpeed method (default method is RandomForest) Maximum number of bars is 260 (increase from 200) There is no expiration date and can be started many times, but it stops after an hour.
FREE
Rainbow MT5
Jamal El Alama
4 (1)
Description : Rainbow MT5 is a technical indicator based on Moving Average with period 34 and very easy to use. When price crosses above MA and MA changes color to green, then this is a signal to buy. When price crosses below MA and MA changes color to red, then this is a signal to sell. The Expert advisor ( Rainbow EA MT5 ) based on Rainbow MT5 indicator is now available here . MT4 version is available here .
FREE
RSI Divergence L
Vasin Chatkittisuk
RSI Divergence Lite (Free) - MT5 Indicator ------------------------------------------------- This is the Lite (free) version of RSI Divergence. - Detects basic Bullish and Bearish divergence between price and RSI - Works only on M15 timeframe - No divergence lines, no alerts - Fixed internal settings (RSI 14, pivot sensitivity, thresholds) - For educational and testing purposes For the full PRO version (multi-timeframe, alerts, divergence lines, advanced UI), please upgrade to RSI Divergence
FREE
This indicator is a zero-lag indicator and displays  strength of trend change . True Trend  Oscillator Pro works best in combination with True Trend Moving Average Pro that displays exact trend as is. Oscillator value is exact price change in given direction of the trend. True Trend Moving Average Pro: https://www.mql5.com/en/market/product/103586 If you set PERIOD input parameter to 1 this indicator becomes a sharpshooter for binary options. Developers can use True Trend Oscillator in Exper
FREE
Os compradores deste produto também adquirem
SuperScalp Pro
Van Minh Nguyen
4.72 (18)
SuperScalp Pro – Sistema avançado de indicador de scalping com múltiplos filtros SuperScalp Pro é um sistema avançado de indicador de scalping que combina o clássico Supertrend com múltiplos filtros inteligentes de confirmação. O indicador opera de forma eficiente em todos os timeframes de M1 a H4 e é especialmente adequado para XAUUSD, BTCUSD e principais pares Forex. Pode ser usado como sistema independente ou integrado de forma flexível a estratégias de trading existentes. O indicador integra
Power Candles MT5
Daniel Stein
4.75 (8)
Power Candles – Sinais de entrada baseados em força para qualquer mercado Power Candles leva a análise de força comprovada da Stein Investments diretamente para o seu gráfico de preços. Em vez de reagir apenas ao preço, cada candle é colorido com base na força real do mercado, permitindo identificar instantaneamente a construção de momentum, aceleração de força e transições limpas de tendência. Uma única lógica para todos os mercados Power Candles funciona automaticamente em todos os símbolos de
Entry In The Zone and SMC Multi Timeframe is a real-time 2-in-1 market analysis tool that combines market structure analysis and a No Repaint BUY / SELL signal system into a single indicator, built on Smart Money Concepts (SMC) — a widely adopted framework used by professional traders to understand market structure. This indicator helps you see the market more clearly, make decisions based on structure rather than guesswork, and focus on high-probability zones where price is more likely to react
Divergence Bomber
Ihor Otkydach
4.9 (86)
Cada comprador deste indicador recebe adicionalmente, e de forma gratuita: A ferramenta exclusiva "Bomber Utility", que acompanha automaticamente cada operação, define os níveis de Stop Loss e Take Profit e fecha operações de acordo com as regras da estratégia; Arquivos de configuração (set files) para ajustar o indicador em diferentes ativos; Set files para configurar o Bomber Utility nos modos: "Risco Mínimo", "Risco Balanceado" e "Estratégia de Espera"; Um vídeo tutorial passo a passo que aju
Azimuth Pro
Ottaviano De Cicco
5 (6)
Azimuth Pro V2: Estrutura Fractal Sintética e Entradas Confirmadas para MT5 Visão geral Azimuth Pro é um indicador de estrutura swing multinível da Merkava Labs . Quatro camadas de swing aninhadas, VWAP ancorado em swings, detecção de padrões ABC, filtragem estrutural de três timeframes e entradas confirmadas em barra fechada — um gráfico, um fluxo de trabalho dos micro-swings aos macro-ciclos. Este não é um produto de sinais cegos. É um fluxo de trabalho baseado em estrutura para traders que v
OmniSync Projection
Antonio-alin Teculescu
5 (1)
Chronos Fractal Engine is an innovative price projection indicator for MetaTrader 5, designed to transform your technical analysis by intelligently identifying and projecting historical price patterns. Built upon an advanced correlation algorithm and the fractal principles of the market, this powerful tool visualizes potential future price movements, giving you a unique edge in your trading decisions. What is Chronos Fractal Engine? At its core, the Chronos Fractal Engine employs a sophisticat
Se você comprar este indicador, receberá meu Gerenciador de Operações Profissional + EA  GRATUITAMENTE. Primeiramente, vale ressaltar que este Sistema de Trading é um Indicador Não Repintado, Não Redesenho e Não Atrasado, o que o torna ideal tanto para o trading manual quanto para o automatizado. Curso online, manual e download de predefinições. O "Sistema de Trading Inteligente MT5" é uma solução completa de trading projetada para traders novos e experientes. Ele combina mais de 10 indicadores
Trend Screener Pro MT5
STE S.S.COMPANY
4.85 (104)
Desbloqueie o poder da negociação de tendências com o indicador Trend Screener: sua solução definitiva de negociação de tendências, alimentada por lógica difusa e sistema de múltiplas moedas! Eleve sua negociação de tendências com o Trend Screener, o revolucionário indicador de tendências alimentado por lógica difusa. É um poderoso indicador de acompanhamento de tendências que combina mais de 13 ferramentas e recursos premium e 3 estratégias de negociação, tornando-o uma escolha versátil para to
Meridian Pro
Ottaviano De Cicco
5 (1)
Meridian Pro: Matriz Profissional de Tendência Multi-Timeframe para MT5 Visão geral Meridian Pro é uma matriz de tendência multi-timeframe da Merkava Labs que comprime estado direcional, força, condição de momentum e concordância da matriz em um painel compacto. Um motor adaptativo, aplicado consistentemente de M1 a W1. Sem ajuste por símbolo. Sem acúmulo de indicadores. Uma leitura estruturada em todos os ativos e todos os timeframes. Oferta de lançamento — Obtenha o Meridian Pro por USD 99 (in
Quantum TrendPulse
Bogdan Ion Puscasu
5 (22)
Apresentando   Quantum TrendPulse   , a ferramenta de negociação definitiva que combina o poder do   SuperTrend   ,   RSI   e   Stochastic   em um indicador abrangente para maximizar seu potencial de negociação. Projetado para traders que buscam precisão e eficiência, este indicador ajuda você a identificar tendências de mercado, mudanças de momentum e pontos de entrada e saída ideais com confiança. Principais características: Integração SuperTrend:   siga facilmente a tendência predominante do
Btmm state engine pro
Garry James Goodchild
5 (3)
BTMM State Engine Pro is a MetaTrader 5 indicator for traders who use the Beat The Market Maker approach: Asian session context, kill zone timing, level progression, peak formation detection, and a multi-pair scanner from a single chart. It combines cycle state logic with a built-in scanner dashboard so you do not need the same tool on many charts at once. What it does Draws the Asian session range; session times can follow broker server offset or be set in inputs. Tracks level progression (L
FX Trend MT5 NG
Daniel Stein
5 (4)
FX Trend NG: A Nova Geração de Inteligência de Tendência Multi-Mercado Visão Geral FX Trend NG é uma ferramenta profissional de análise de tendências e monitoramento de mercado em múltiplos períodos de tempo. Permite compreender a estrutura completa do mercado em segundos. Em vez de alternar entre vários gráficos, você visualiza instantaneamente quais ativos estão em tendência, onde o momentum está enfraquecendo e onde existe alinhamento forte entre diferentes timeframes. Oferta de Lançamento
Gann Made Easy   é um sistema de negociação Forex profissional e fácil de usar, baseado nos melhores princípios de negociação usando a teoria do sr. W. D. Gann. O indicador fornece sinais precisos de COMPRA e VENDA, incluindo níveis de Stop Loss e Take Profit. Você pode negociar mesmo em movimento usando notificações PUSH. Entre em contato comigo após a compra para receber instruções de negociação e ótimos indicadores extras gratuitamente! Provavelmente você já ouviu muitas vezes sobre os método
ARICoins
Temirlan Kdyrkhan
ARICoin is a powerful trading companion designed to generate high-probability entry signals with dynamic TP/SL/DP levels based on volatility. Built-in performance tracking shows win/loss stats, PP1/PP2 hits, and success rates all updated live. Key Features: Buy/Sell signals with adaptive volatility bands Real-time TP/SL/DP levels based on ATR Built-in MA Filter with optional ATR/StdDev volatility Performance stats panel (Success, Profit/Loss, PP1/PP2) Alerts via popup, sound, push, or email Cust
Trend indicator AI mt5
Ramil Minniakhmetov
5 (16)
O indicador Trend Ai é uma ótima ferramenta que irá melhorar a análise de mercado de um trader, combinando a identificação de tendências com pontos de entrada acionáveis e alertas de reversão. Este indicador permite que os usuários naveguem pelas complexidades do mercado forex com confiança e precisão Além dos sinais primários, o indicador Trend Ai identifica pontos de entrada secundários que surgem durante retrações ou retrações, permitindo que os comerciantes capitalizem as correções de preço
Veja qual estrategia realmente funciona no seu simbolo - antes de arriscar dinheiro real. Power Bar detecta barras de preco extremas em qualquer simbolo e qualquer timeframe, e entao faz backtest instantaneo de 3 estrategias de trading diferentes para que voce possa comparar taxas de acerto, fatores de lucro e P&L lado a lado. Tudo em um unico painel interativo. Sem suposicoes. Sem curve-fitting. Apenas dados. O que torna o Power Bar unico? A maioria dos indicadores fornece um sinal e deixa voc
Atomic Analyst MT5
Issam Kassas
3.94 (31)
Primeiramente, vale ressaltar que este Indicador de Negociação não repinta, não redesenha e não apresenta atrasos, tornando-o ideal tanto para negociação manual quanto automatizada. Manual do utilizador: configurações, entradas e estratégia. O Analista Atômico é um Indicador de Ação de Preço PA que utiliza a força e o momentum do preço para encontrar uma vantagem melhor no mercado. Equipado com filtros avançados que ajudam a remover ruídos e sinais falsos, e aumentam o potencial de negociação.
Antes de tudo, vale ressaltar que esta Ferramenta de Negociação é um Indicador Não Repintante, Não Redesenhante e Não Atrasado, o que a torna ideal para negociação profissional. Curso online, manual do utilizador e demonstração. O Indicador de Conceitos de Ação de Preço Inteligente é uma ferramenta muito poderosa tanto para traders novos quanto experientes. Ele combina mais de 20 indicadores úteis em um único, combinando ideias avançadas de negociação como Análise do Trader do Círculo Interno
Crystal Heikin Ashi Signals
Muhammad Jawad Shabir
5 (2)
Crystal Heikin Ashi Signals - Professional Trend & Signal Detection Indicator Advanced Heikin Ashi Visualization with Intelligent Signal System for Manual & Automated Trading Final Price: $149 ---------> Price goes up $10 after every 10 sales . Limited slots available — act fast . Overview Crystal Heikin Ashi Signals is a professional-grade MetaTrader 5 indicator that combines pure Heikin Ashi candle visualization with an advanced momentum-shift detection system. Designed for both manual traders
FX Power MT5 NG
Daniel Stein
5 (31)
FX Power: Analise a Força das Moedas para Decisões de Negociação Mais Inteligentes Visão Geral FX Power é a sua ferramenta essencial para compreender a força real das principais moedas e do ouro em quaisquer condições de mercado. Identificando moedas fortes para comprar e fracas para vender, FX Power simplifica as decisões de negociação e revela oportunidades de alta probabilidade. Quer você prefira seguir tendências ou antecipar reversões usando valores extremos de Delta, esta ferramenta adap
Auto Optimized Parabolic RSI: Avançado Motor de Momentum 3D A maioria dos indicadores de varejo falha porque depende de parâmetros estáticos que quebram no momento em que a volatilidade do mercado muda. O Auto Optimized Parabolic RSI resolve o problema de "obsolescência do indicador" recalculando continuamente a sua própria vantagem matemática, trazendo uma adaptação quantitativa de nível institucional diretamente para o seu terminal MT5. A Vantagem Principal: Otimização 3D em Memória Personaliz
Bill Williams Advanced
Siarhei Vashchylka
5 (11)
Bill Williams Advanced is designed for automatic chart analysis using Bill Williams' "Profitunity" system. The indicator analyzes four timeframes at once. Manual (Be sure to read before purchasing) Advantages 1. Analyzes the chart using Bill Williams' "Profitunity" system. Signals are displayed in a table in the corner of the screen and on the price chart. 2. Finds all known AO and AC signals, as well as zone signals. Equipped with a trend filter based on the Alligator. 3. Finds "Divergence Bar
Weltrade Spike Sentinel
Batsirayi L Marango
5 (1)
Introducing Indicator for PainX and GainX Indices Traders on Weltrade Get ready to experience the power of trading with our indicator, specifically designed for Weltrade   broker's PainX and GainX Indices.  Advanced Strategies for Unbeatable Insights Our indicator employs sophisticated strategies to analyze market trends, pinpointing optimal entry and exit points.  Optimized for Maximum Performance To ensure optimal results, our indicator is carefully calibrated for 5-minute timeframe charts on
RelicusRoad Pro: Sistema Operacional Quantitativo de Mercado 70% DE DESCONTO ACESSO VITALÍCIO (TEMPO LIMITADO) - JUNTE-SE A 2.000+ TRADERS Por que a maioria dos traders falha mesmo com indicadores "perfeitos"? Porque eles operam Conceitos Únicos no vácuo. Um sinal sem contexto é uma aposta. Você precisa de CONFLUÊNCIA . RelicusRoad Pro não é um simples indicador de seta. É um Ecossistema Quantitativo de Mercado completo. Ele mapeia a "Estrada do Valor Justo", distinguindo ruído de rupturas estru
RFI levels PRO MT5
Roman Podpora
3.67 (3)
O indicador mostra com precisão os pontos de reversão e as zonas de retorno de preço onde o   Principais players . Você identifica onde novas tendências estão se formando e toma decisões com máxima precisão, mantendo o controle sobre cada negociação. VERSION MT4     -    Revela seu potencial máximo quando combinado com o indicador   TREND LINES PRO. O que o indicador mostra: Estruturas de reversão e níveis de reversão com ativação no início de uma nova tendência. Exibição dos níveis de   TAKE P
CGE Trading Suite
Carl Gustav Johan Ekstrom
5 (1)
CGE Trading Suite delivers the analytical edge typically reserved for professional trading desks. The platform integrates a full suite of analytical tools into one seamless workflow: dynamic grid mapping, liquidity behavior analysis, ECM, trend lines, MIDAS, trade cycles, and directional channel projections. Together, these provide a unified view of market structure and momentum. Directional clarity is further enhanced by the capital flow index, which measures currency basket strength to identif
Berma Bands
Muhammad Elbermawi
5 (8)
O indicador Berma Bands (BBs) é uma ferramenta valiosa para traders que buscam identificar e capitalizar tendências de mercado. Ao analisar a relação entre o preço e os BBs, os traders podem discernir se um mercado está em uma fase de tendência ou de variação. Visite o [ Blog Berma Home ] para saber mais. As Bandas de Berma são compostas por três linhas distintas: a Banda de Berma Superior, a Banda de Berma Média e a Banda de Berma Inferior. Essas linhas são plotadas em torno do preço, criando u
ARIPoint
Temirlan Kdyrkhan
ARIPoint is a powerful trading companion designed to generate high-probability entry signals with dynamic TP/SL/DP levels based on volatility. Built-in performance tracking shows win/loss stats, PP1/PP2 hits, and success rates all updated live. Key Features: Buy/Sell signals with adaptive volatility bands Real-time TP/SL/DP levels based on ATR Built-in MA Filter with optional ATR/StdDev volatility Performance stats panel (Success, Profit/Loss, PP1/PP2) Alerts via popup, sound, push, or email Cu
Advanced Supply Demand MT5
Bernhard Schweigert
4.53 (15)
Atualmente com 33% de desconto! A melhor solução para qualquer Trader Novato ou especialista! Este indicador é uma ferramenta de negociação exclusiva, de alta qualidade e acessível porque incorporamos uma série de recursos proprietários e uma nova fórmula. Com esta atualização, você poderá mostrar fusos horários duplos. Você não só será capaz de mostrar um TF mais alto, mas também mostrar ambos, o TF do gráfico, MAIS o TF mais alto: MOSTRANDO ZONAS ANINHADAS. Todos os traders de Oferta e Demanda
PZ Trend Trading MT5
PZ TRADING SLU
3.8 (5)
O Trend Trading é um indicador projetado para lucrar o máximo possível com as tendências que ocorrem no mercado, cronometrando retrocessos e rupturas. Ele encontra oportunidades de negociação analisando o que o preço está fazendo durante as tendências estabelecidas. [ Guia de instalação | Guia de atualização | Solução de problemas | FAQ | Todos os produtos ] Negocie mercados financeiros com confiança e eficiência Lucre com as tendências estabelecidas sem ser chicoteado Reconhecer retrocessos
Mais do autor
Special offer : ALL TOOLS , just $35 each! New tools   will be   $30   for the   first week   or the   first 3 purchases !  Trading Tools Channel on MQL5 : Join my MQL5 channel to update the latest news from me Apresentamos o SuperTrend ATR Multiplier with Scanner for MT5 – uma ferramenta versátil e poderosa projetada para ajudar você a se manter à frente das tendências do mercado, com recursos personalizáveis e alertas em tempo real. Seguindo a lógica confiável do SuperTrend de Kivanc Ozbilgic
FREE
Volumatic VIDyA MT4
Duc Hoan Nguyen
4.5 (4)
Special offer : ALL TOOLS , just $35 each! New tools   will be   $30   for the   first week   or the   first 3 purchases !  Trading Tools Channel on MQL5 : Join my MQL5 channel to update the latest news from me Volumatic VIDYA (Variable Index Dynamic Average) é um indicador avançado projetado para rastrear tendências e analisar a pressão de compra e venda em cada fase de uma tendência. Utilizando o Promédio Dinâmico de Índice Variável (Variable Index Dynamic Average) como técnica central de sua
Special offer : ALL TOOLS , just $35 each! New tools   will be   $30   for the   first week   or the   first 3 purchases !  Trading Tools Channel on MQL5 : Join my MQL5 channel to update the latest news from me O indicador Supertrend Fakeout é uma versão aprimorada do clássico indicador Supertrend , projetado para fornecer sinais de tendência mais confiáveis. Ao incorporar recursos avançados como Fakeout Index Limit e Fakeout ATR Mult , este indicador ajuda a filtrar reversões de tendência fals
FREE
Special offer : ALL TOOLS , just $35 each! New tools   will be   $30   for the   first week   or the   first 3 purchases !  Trading Tools Channel on MQL5 : Join my MQL5 channel to update the latest news from me No atual cenário volátil de negociação financeira, identificar com precisão níveis de suporte e resistência é fundamental para que os traders tomem decisões informadas. O Predictive Ranges Scanner Multi-TF é uma ferramenta avançada projetada para ajudar os traders a escanear e prever fut
Special offer : ALL TOOLS , just $35 each! New tools   will be   $30   for the   first week   or the   first 3 purchases !  Trading Tools Channel on MQL5 : Join my MQL5 channel to update the latest news from me Vamos começar pelos excelentes recursos: O EA está equipado com um FILTRO DE NOTÍCIAS e um FILTRO RSI. Baixo risco (alguns pares de moedas têm DrawDown <10%, até 5%). Este EA não utiliza qualquer função de martingale ou grid. O EA pode exibir zonas visuais para negociação manual, se dese
Volumatic VIDyA MT5
Duc Hoan Nguyen
5 (2)
Special offer : ALL TOOLS , just $35 each! New tools   will be   $30   for the   first week   or the   first 3 purchases !  Trading Tools Channel on MQL5 : Join my MQL5 channel to update the latest news from me Volumatic VIDYA (Variable Index Dynamic Average) é um indicador avançado projetado para rastrear tendências e analisar a pressão de compra e venda em cada fase de uma tendência. Utilizando o Promédio Dinâmico de Índice Variável (Variable Index Dynamic Average) como técnica central de sua
Special offer : ALL TOOLS , just $35 each! New tools   will be   $30   for the   first week   or the   first 3 purchases !  Trading Tools Channel on MQL5 : Join my MQL5 channel to update the latest news from me Maximize sua vantagem de negociação com o Follow Line MT5 com Scanner, um indicador avançado baseado em volatilidade, projetado para traders sérios. Esta ferramenta combina o poder das Bandas de Bollinger com configurações personalizáveis, oferecendo insights precisos sobre os movimentos
FREE
Special offer : ALL TOOLS , just $35 each! New tools   will be   $30   for the   first week   or the   first 3 purchases !  Trading Tools Channel on MQL5 : Join my MQL5 channel to update the latest news from me O Fibonacci Confluence Toolkit Multi-Timeframe é uma ferramenta avançada de análise técnica projetada para traders profissionais, ajudando a identificar zonas potenciais de reversão de preços ao combinar sinais e padrões de mercado-chave. Com capacidades de exibição de múltiplos interval
SMC System MT4
Duc Hoan Nguyen
4.5 (2)
Special offer : ALL TOOLS , just $35 each! New tools   will be   $30   for the   first week   or the   first 3 purchases !  Trading Tools Channel on MQL5 : Join my MQL5 channel to update the latest news from me SMC é uma abordagem de trading que ajuda os traders a identificar zonas de liquidez, posições institucionais e pontos de reversão importantes no mercado. Ao aproveitar os princípios do SMC, os traders podem navegar pelo mercado de forma mais eficaz, encontrando entradas e saídas ideais.
OA SnR Power MT5
Duc Hoan Nguyen
5 (3)
Special offer : ALL TOOLS , just $35 each! New tools   will be   $30   for the   first week   or the   first 3 purchases !  Trading Tools Channel on MQL5 : Join my MQL5 channel to update the latest news from me Visão Geral OA SnR Power é uma ferramenta poderosa projetada para ajudar traders a identificar e avaliar a força dos níveis de suporte e resistência. Incorporando fatores-chave como volume de negociação, frequência de rebote e número de testes, este indicador fornece uma visão abrangent
FREE
Special offer : ALL TOOLS , just $35 each! New tools   will be   $30   for the   first week   or the   first 3 purchases !  Trading Tools Channel on MQL5 : Join my MQL5 channel to update the latest news from me SMC é uma abordagem de trading que ajuda os traders a identificar zonas de liquidez, posições institucionais e pontos de reversão importantes no mercado. Ao aproveitar os princípios do SMC, os traders podem navegar pelo mercado de forma mais eficaz, encontrando entradas e saídas ideais.
Special offer : ALL TOOLS , just $35 each! New tools   will be   $30   for the   first week   or the   first 3 purchases !  Trading Tools Channel on MQL5 : Join my MQL5 channel to update the latest news from me O indicador Volumetric Order Blocks Multi Timeframe é uma ferramenta poderosa projetada para traders que buscam insights mais profundos sobre o comportamento do mercado, identificando áreas de preço chave onde participantes significativos do mercado acumulam ordens. Essas áreas, conhecid
Supertrend Fakeout MT4
Duc Hoan Nguyen
4.25 (4)
Special offer : ALL TOOLS , just $35 each! New tools   will be   $30   for the   first week   or the   first 3 purchases !  Trading Tools Channel on MQL5 : Join my MQL5 channel to update the latest news from me O indicador Supertrend Fakeout é uma versão aprimorada do clássico indicador Supertrend , projetado para fornecer sinais de tendência mais confiáveis. Ao incorporar recursos avançados como Fakeout Index Limit e Fakeout ATR Mult , este indicador ajuda a filtrar reversões de tendência fals
FREE
Oferta especial : ALL TOOLS , apenas $35 cada! New tools   will be   $30   for the   first week   or the   first 3 purchases !  Trading Tools Channel on MQL5 : Join my MQL5 channel to update the latest news from me Em um ambiente de negociação volátil, uma ferramenta de análise poderosa e intuitiva pode ajudá-lo a aproveitar rapidamente as oportunidades. O Fibonacci Trend Scanner não apenas integra recursos tradicionais do indicador Fibonacci e do SuperTrend, mas também expande a funcionalidade
AI Channels MT5
Duc Hoan Nguyen
5 (1)
Special offer : ALL TOOLS , just $35 each! New tools   will be   $30   for the   first week   or the   first 3 purchases !  Trading Tools Channel on MQL5 : Join my MQL5 channel to update the latest news from me O indicador AI Channels utiliza clusterização K-means deslizante — uma técnica poderosa de aprendizado de máquina na análise de clusters — para fornecer insights em tempo real sobre tendências de preços subjacentes. Este indicador cria canais adaptativos com base em dados de preços agrup
FREE
Special offer : ALL TOOLS , just $35 each! New tools   will be   $30   for the   first week   or the   first 3 purchases !  Trading Tools Channel on MQL5 : Join my MQL5 channel to update the latest news from me O indicador Volumetric Order Blocks Multi Timeframe é uma ferramenta poderosa projetada para traders que buscam insights mais profundos sobre o comportamento do mercado, identificando áreas de preço chave onde participantes significativos do mercado acumulam ordens. Essas áreas, conhecid
RSI Divergence MT5 Scanner
Duc Hoan Nguyen
3.33 (3)
Special offer : ALL TOOLS , just $35 each! New tools   will be   $30   for the   first week   or the   first 3 purchases !  Trading Tools Channel on MQL5 : Join my MQL5 channel to update the latest news from me Nos mercados financeiros dinâmicos, identificar sinais de reversão de tendência é essencial para uma negociação eficaz. O RSI Divergence Scanner foi projetado para ajudá-lo a detectar sinais de divergência RSI em vários pares de moedas e prazos de forma precisa e eficiente. Veja mais a v
FREE
Special offer : ALL TOOLS , just $35 each! New tools   will be   $30   for the   first week   or the   first 3 purchases !  Trading Tools Channel on MQL5 : Join my MQL5 channel to update the latest news from me Maximize sua vantagem de negociação com o Follow Line com Scanner, um indicador avançado baseado em volatilidade, projetado para traders sérios. Esta ferramenta combina o poder das Bandas de Bollinger com configurações personalizáveis, oferecendo insights precisos sobre os movimentos de
FREE
Special offer : ALL TOOLS , just $35 each! New tools   will be   $30   for the   first week   or the   first 3 purchases !  Trading Tools Channel on MQL5 : Join my MQL5 channel to update the latest news from me Nos mercados financeiros dinâmicos, identificar sinais de reversão de tendência é essencial para uma negociação eficaz. O RSI Divergence Scanner foi projetado para ajudá-lo a detectar sinais de divergência RSI em vários pares de moedas e prazos de forma precisa e eficiente. Veja mais a v
FREE
Special offer : ALL TOOLS , just $35 each! New tools   will be   $30   for the   first week   or the   first 3 purchases !  Trading Tools Channel on MQL5 : Join my MQL5 channel to update the latest news from me Apresentamos o revolucionário RSI Kernel Optimized com Scanner, uma ferramenta inovadora que redefine a análise tradicional do RSI ao integrar o poderoso algoritmo de Estimativa de Densidade Kernel (KDE). Este indicador avançado não apenas fornece informações em tempo real sobre as tendê
Special offer : ALL TOOLS , just $35 each! New tools   will be   $30   for the   first week   or the   first 3 purchases !  Trading Tools Channel on MQL5 : Join my MQL5 channel to update the latest news from me Visão Geral OA SnR Power é uma ferramenta poderosa projetada para ajudar traders a identificar e avaliar a força dos níveis de suporte e resistência. Incorporando fatores-chave como volume de negociação, frequência de rebote e número de testes, este indicador fornece uma visão abrangent
FREE
AI Channels MT4
Duc Hoan Nguyen
5 (1)
Special offer : ALL TOOLS , just $35 each! New tools   will be   $30   for the   first week   or the   first 3 purchases !  Trading Tools Channel on MQL5 : Join my MQL5 channel to update the latest news from me O indicador AI Channels utiliza clusterização K-means deslizante — uma técnica poderosa de aprendizado de máquina na análise de clusters — para fornecer insights em tempo real sobre tendências de preços subjacentes. Este indicador cria canais adaptativos com base em dados de preços agrup
FREE
Special offer : ALL TOOLS , just $35 each! New tools   will be   $30   for the   first week   or the   first 3 purchases !  Trading Tools Channel on MQL5 : Join my MQL5 channel to update the latest news from me Trendlines with Breaks Scanner é uma ferramenta de trading de última geração projetada para ajudar os traders a identificar tendências críticas e detectar rompimentos em tempo real. Com linhas de tendência geradas automaticamente com base em pontos de pivô, este indicador permite que os
Special offer : ALL TOOLS , just $35 each! New tools   will be   $30   for the   first week   or the   first 3 purchases !  Trading Tools Channel on MQL5 : Join my MQL5 channel to update the latest news from me Apresentamos o SuperTrend by Kivanc Ozbilgic with Scanner – uma ferramenta versátil e poderosa projetada para ajudar você a se manter à frente das tendências do mercado, com recursos personalizáveis e alertas em tempo real. Você pode ajustar o método de cálculo do ATR entre RMA (Média Mó
FREE
Liquidity Pools MT4
Duc Hoan Nguyen
5 (1)
Special offer : ALL TOOLS , just $35 each! New tools   will be   $30   for the   first week   or the   first 3 purchases !  Trading Tools Channel on MQL5 : Join my MQL5 channel to update the latest news from me O indicador Liquidity Pools é uma ferramenta avançada que identifica e marca zonas potenciais de liquidez no gráfico ao analisar áreas altas e baixas com frequentes toques de pavio, juntamente com o número de revisitações e o volume negociado em cada zona. Esta ferramenta oferece aos tra
Special offer : ALL TOOLS , just $35 each! New tools   will be   $30   for the   first week   or the   first 3 purchases !  Trading Tools Channel on MQL5 : Join my MQL5 channel to update the latest news from me O Fibonacci Confluence Toolkit Multi-Timeframe é uma ferramenta avançada de análise técnica projetada para traders profissionais, ajudando a identificar zonas potenciais de reversão de preços ao combinar sinais e padrões de mercado-chave. Com capacidades de exibição de múltiplos interval
Special offer : ALL TOOLS , just $35 each! New tools   will be   $30   for the   first week   or the   first 3 purchases !  Trading Tools Channel on MQL5 : Join my MQL5 channel to update the latest news from me No cenário em constante mudança do comércio financeiro, identificar e analisar com precisão os níveis de suporte e resistência é essencial para tomar decisões de investimento informadas. SnR Retest and Break Multi-Timeframe é um indicador de suporte e resistência projetado para aprimorar
Special offer : ALL TOOLS , just $35 each! New tools   will be   $30   for the   first week   or the   first 3 purchases !  Trading Tools Channel on MQL5 : Join my MQL5 channel to update the latest news from me Apresentamos o revolucionário RSI Kernel Optimized com Scanner para MT5, uma ferramenta inovadora que redefine a análise tradicional do RSI ao integrar o poderoso algoritmo de Estimativa de Densidade Kernel (KDE). Este indicador avançado não apenas fornece informações em tempo real sobre
Special offer : ALL TOOLS , just $35 each! New tools   will be   $30   for the   first week   or the   first 3 purchases !  Trading Tools Channel on MQL5 : Join my MQL5 channel to update the latest news from me Desbloqueie o poder do conceito de Inversion Fair Value Gap (IFVG) de ICT com o Inversion Fair Value Gaps Indicator ! Esta ferramenta inovadora eleva os Fair Value Gaps (FVGs) a um novo nível, identificando e exibindo zonas de FVG invertidas — áreas-chave de suporte e resistência formada
Special offer : ALL TOOLS , just $35 each! New tools   will be   $30   for the   first week   or the   first 3 purchases !  Trading Tools Channel on MQL5 : Join my MQL5 channel to update the latest news from me O Indicador de Padrão de Reversão de Três Barras oferece uma ferramenta poderosa para traders, identificando e destacando automaticamente padrões de reversão de três barras diretamente no gráfico de preços. Este indicador é um recurso valioso para detectar reversões potenciais de tendênc
Filtro:
Sem comentários
Responder ao comentário