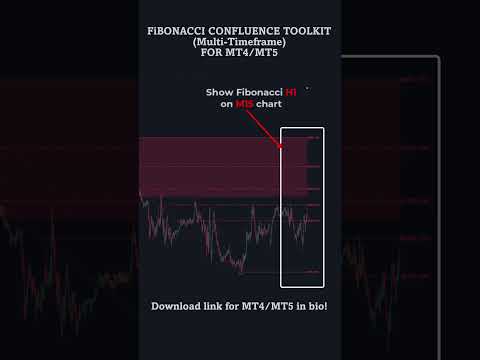
Fibonacci Confluence Toolkit MT4 Multi Timeframe
- 指标
- 版本: 2.10
- 更新: 27 二月 2025
- 激活: 10

New tools will be $30 for the first week or the first 3 purchases!
Trading Tools Channel on MQL5: Join my MQL5 channel to update the latest news from me
Fibonacci Confluence Toolkit Multi-Timeframe 是为专业交易员设计的高级技术分析工具,通过结合关键的市场信号和模式,帮助识别潜在的价格反转区域。通过时间框架选择器仪表板的多时间框架显示功能,该工具包提供了对市场动态的全面和深入的视图,使您能够做出准确和及时的交易决策。
查看更多MT5版本,请访问: Fibonacci Confluence Toolkit MT5 Multi Timeframe
查看更多产品,请访问: 所有P产品
主要特点多时间框架分析
Fibonacci Confluence Toolkit Multi-Timeframe 允许您通过易于使用的仪表板在多个时间框架上监控和分析信号。这有助于您全面了解市场情况,从短期到长期,确保您的交易决策基于全面和准确的数据。
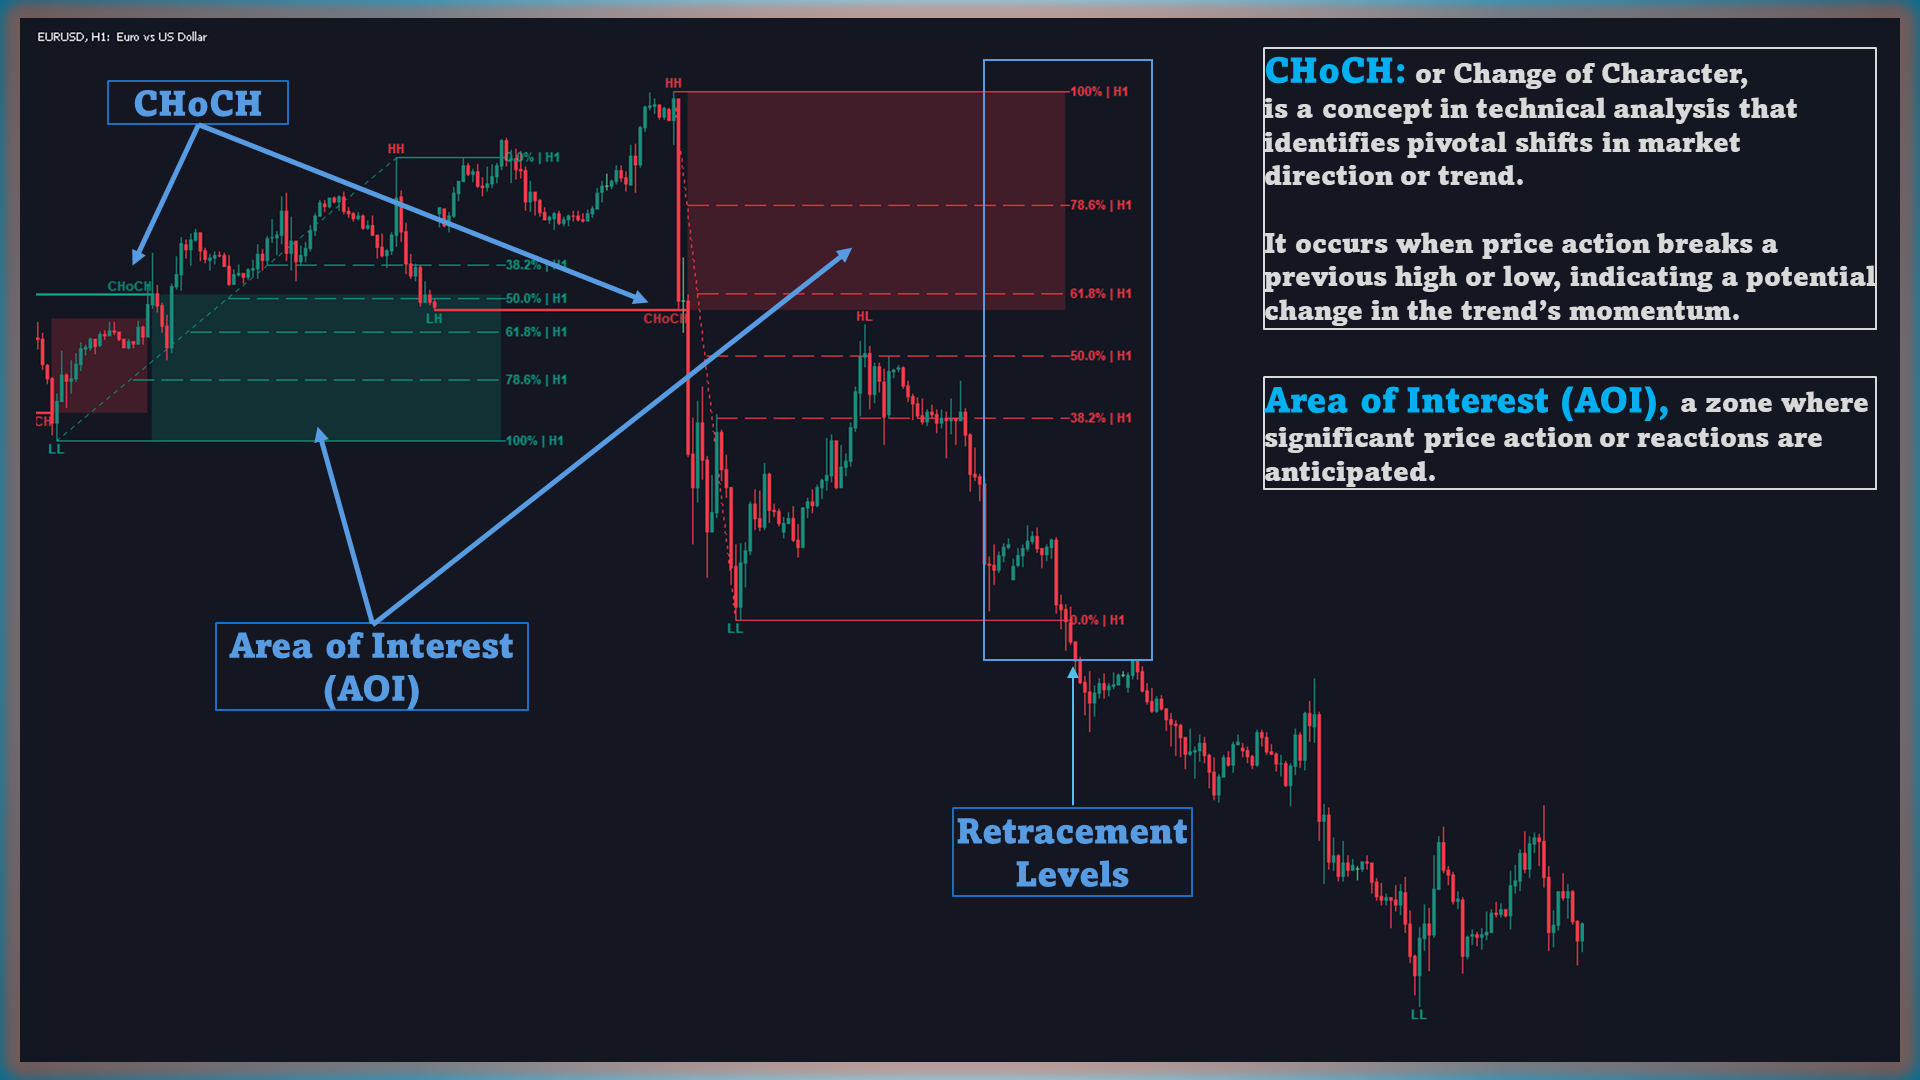
识别价格反转区域
该工具包自动检测 CHoCH(Change of Character)点——市场方向转变的关键指标。这些 CHoCH 点用于定义兴趣区域(AOI),预计会有显著的价格波动或强烈反应。
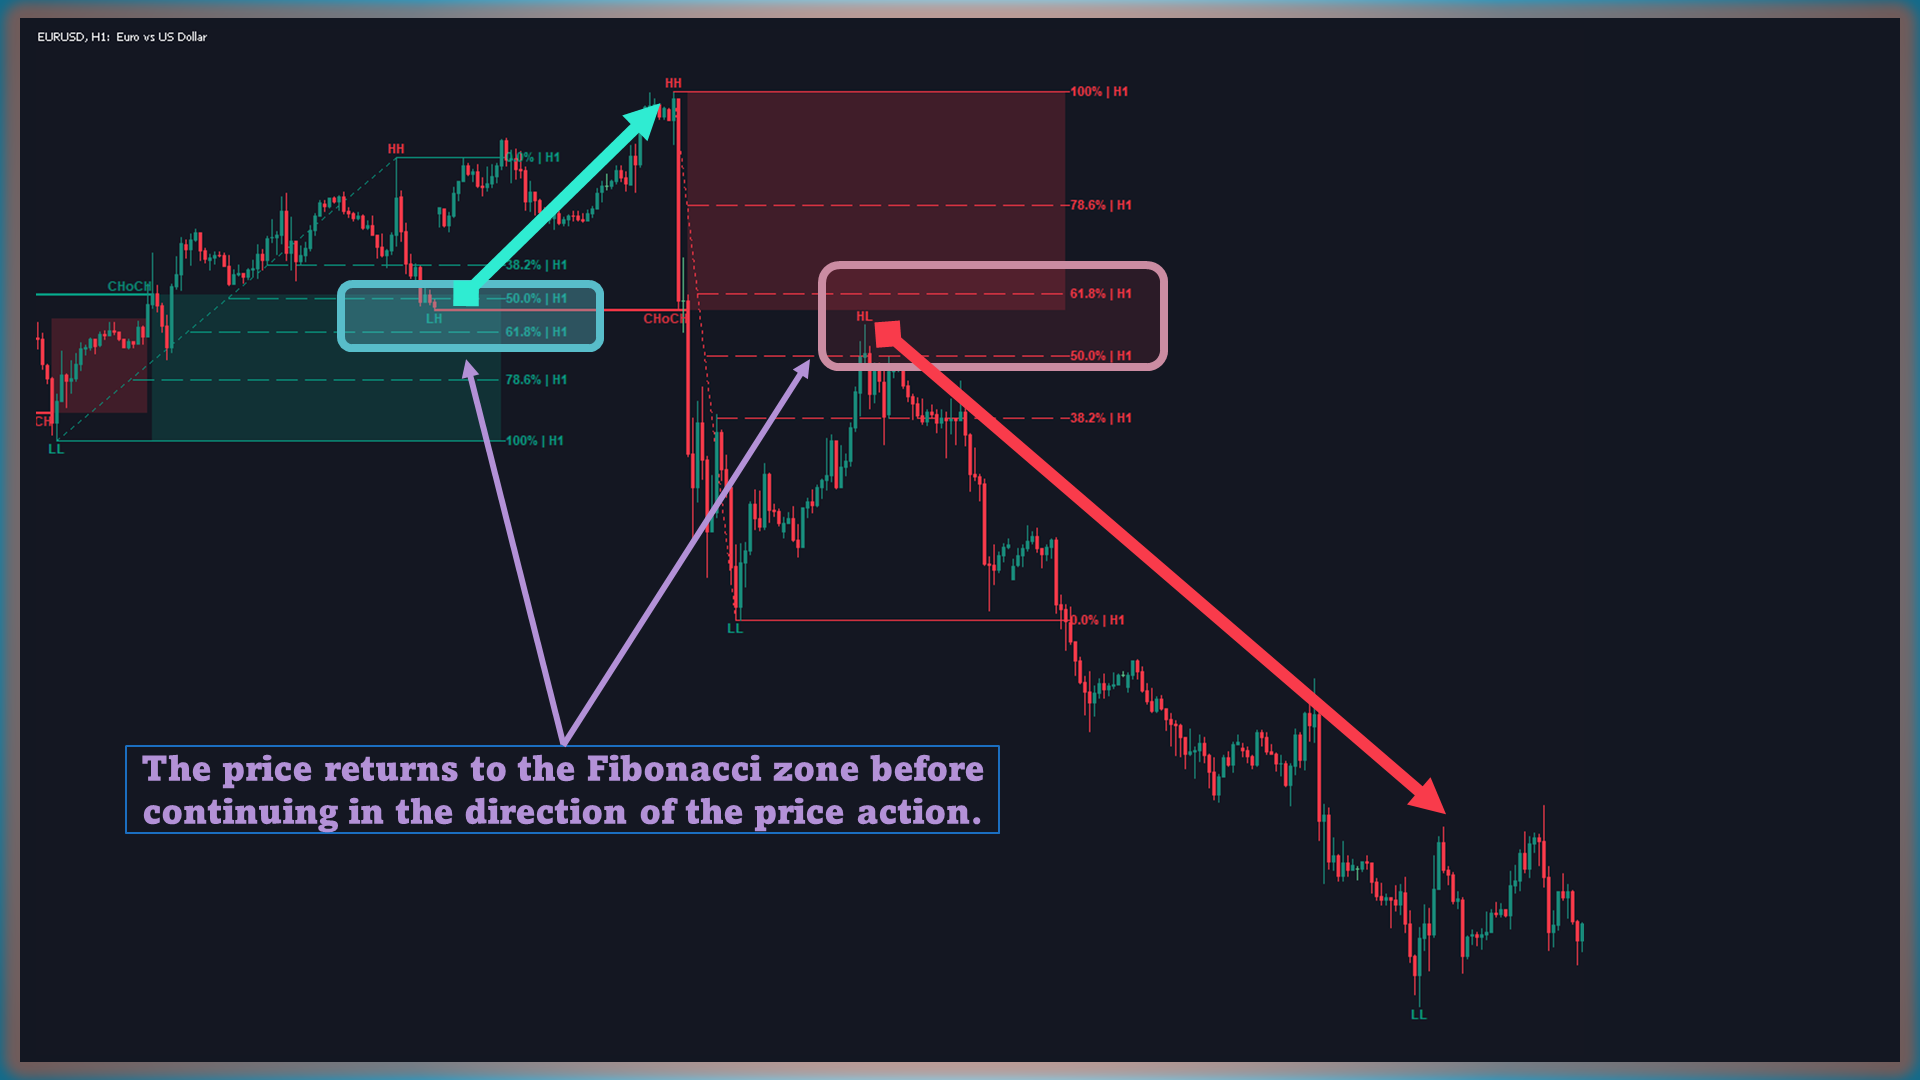
自动应用斐波那契回撤
当 AOI 内出现新的摆动高点或低点时,工具会自动应用斐波那契回撤水平,以勾勒出潜在的回调区域。这帮助交易员轻松识别回调区域,提供可操作的入场点或可能的反转机会。
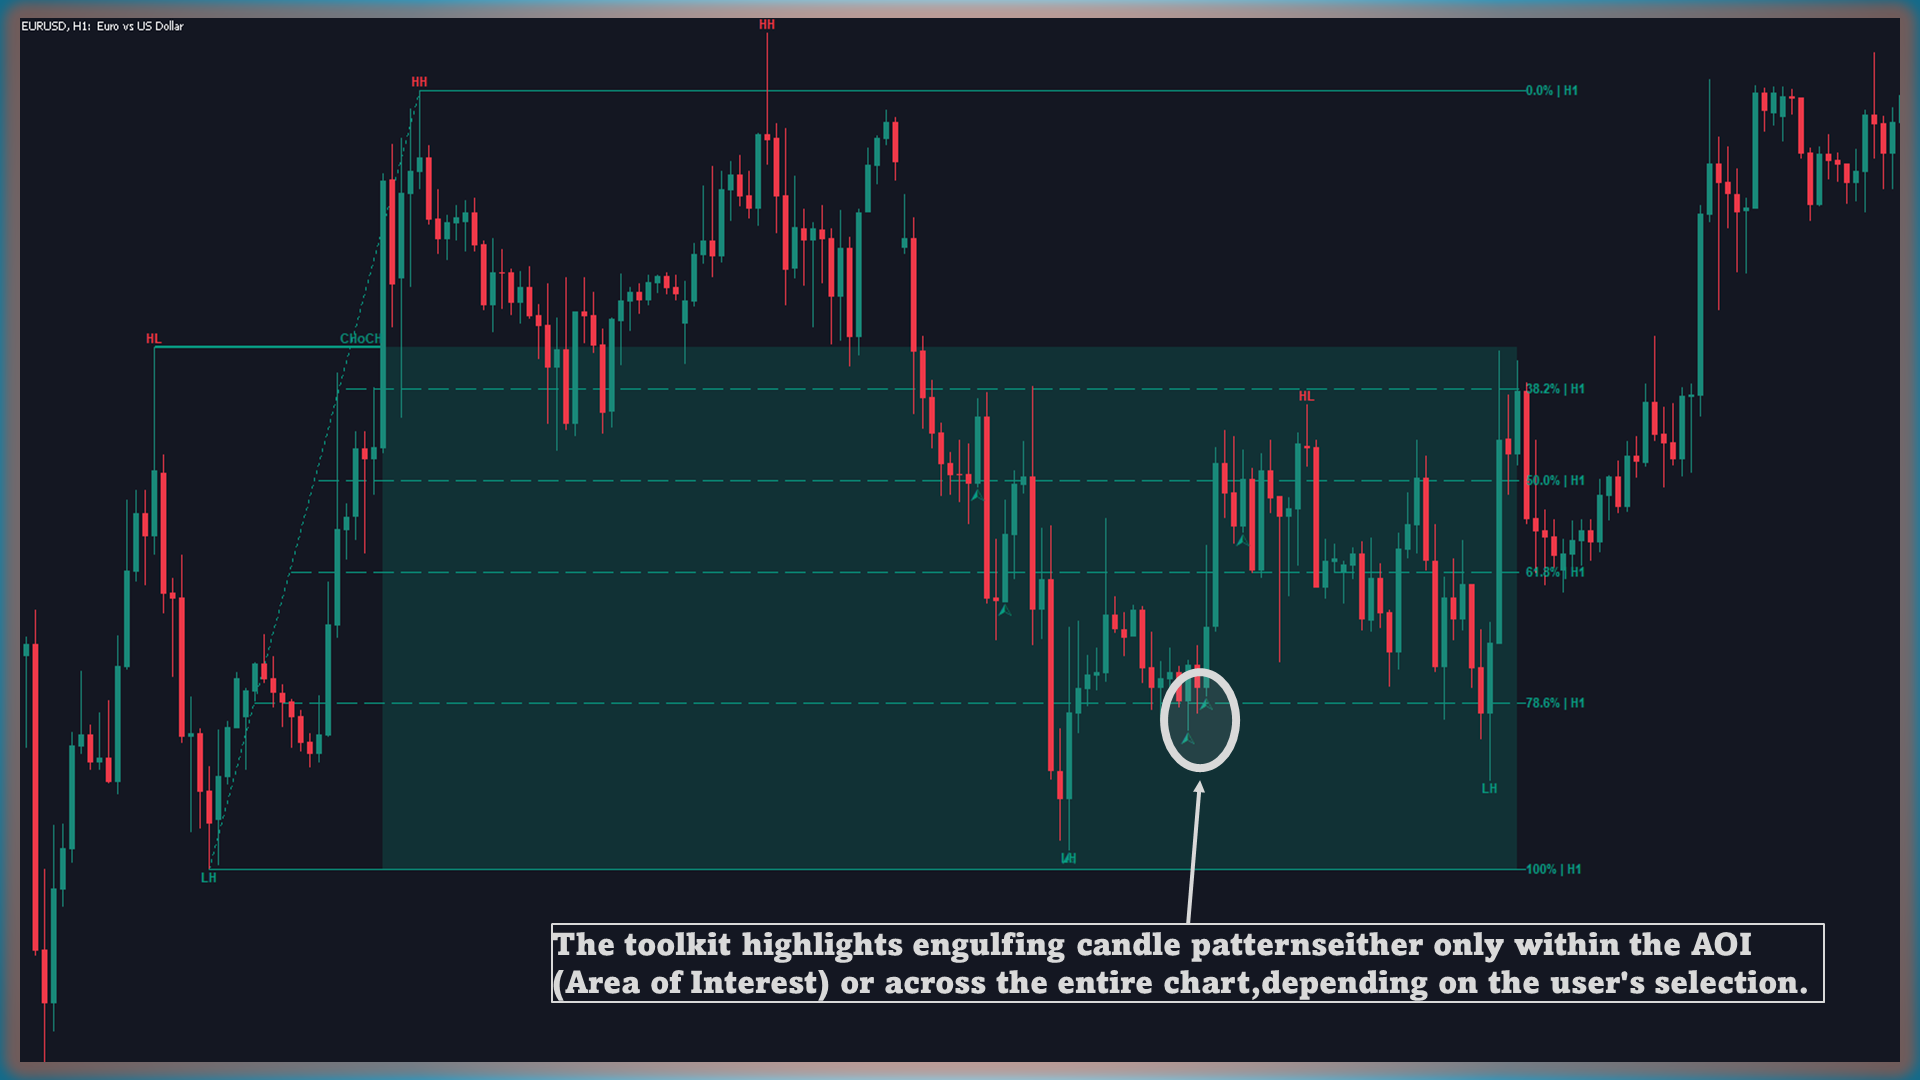
吞没蜡烛形态检测
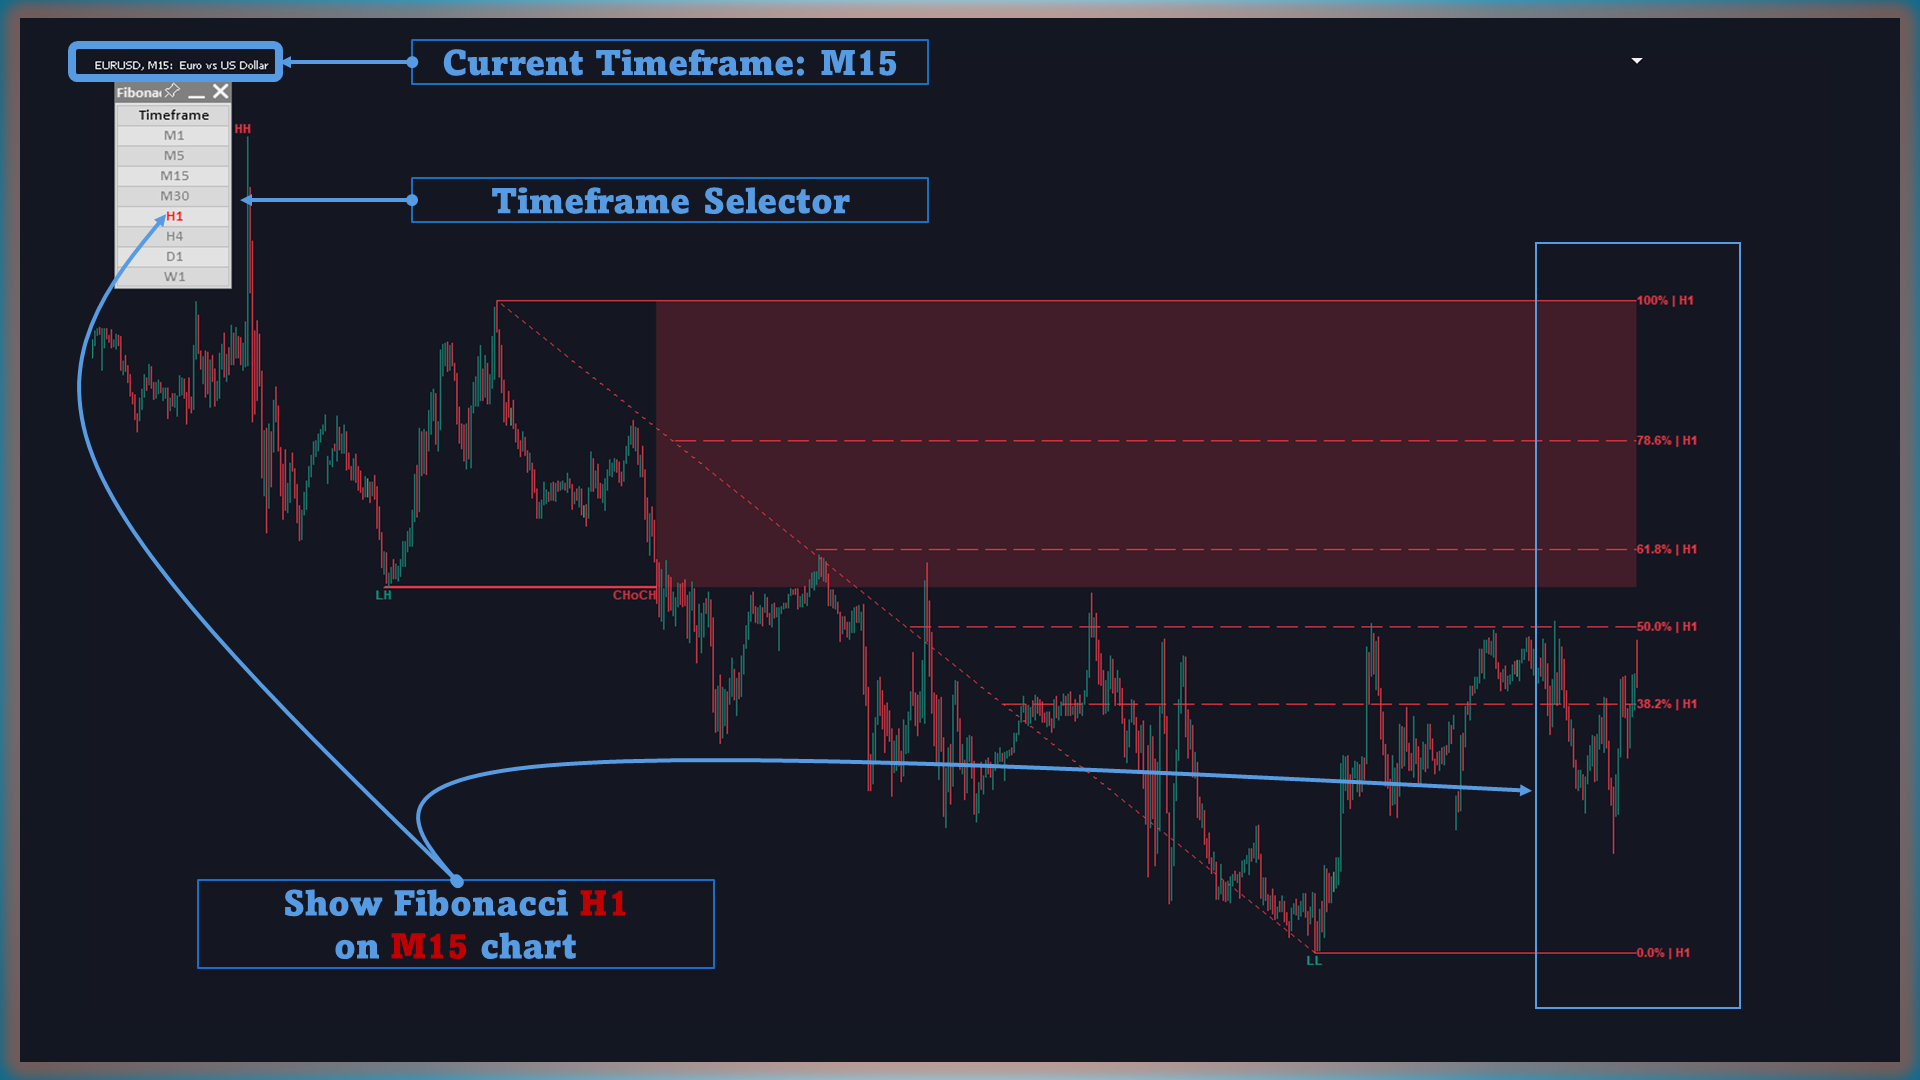
仪表板时间框架选择器该工具包还会自动检测 AOI 内的吞没蜡烛形态,帮助优化入场点并增强汇聚性,从而基于实时趋势动态和价格行为提高交易决策的质量。
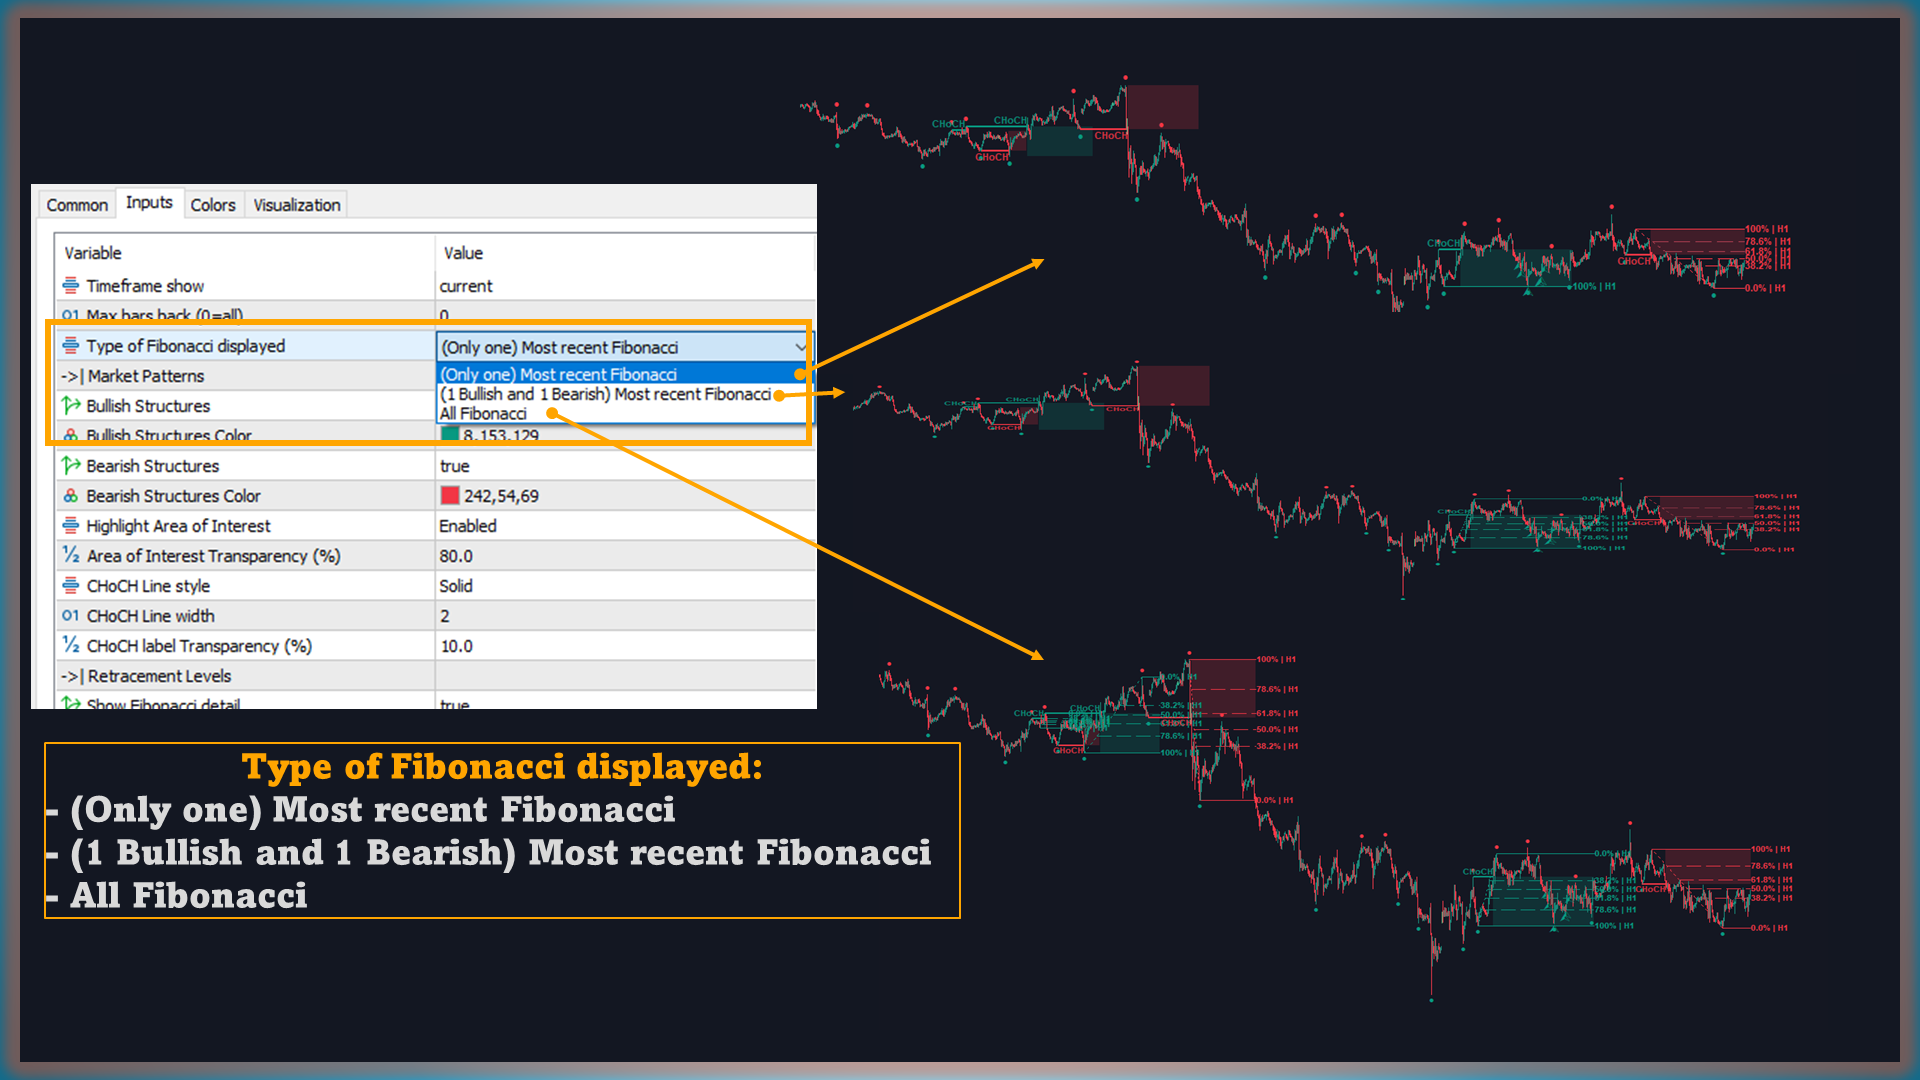
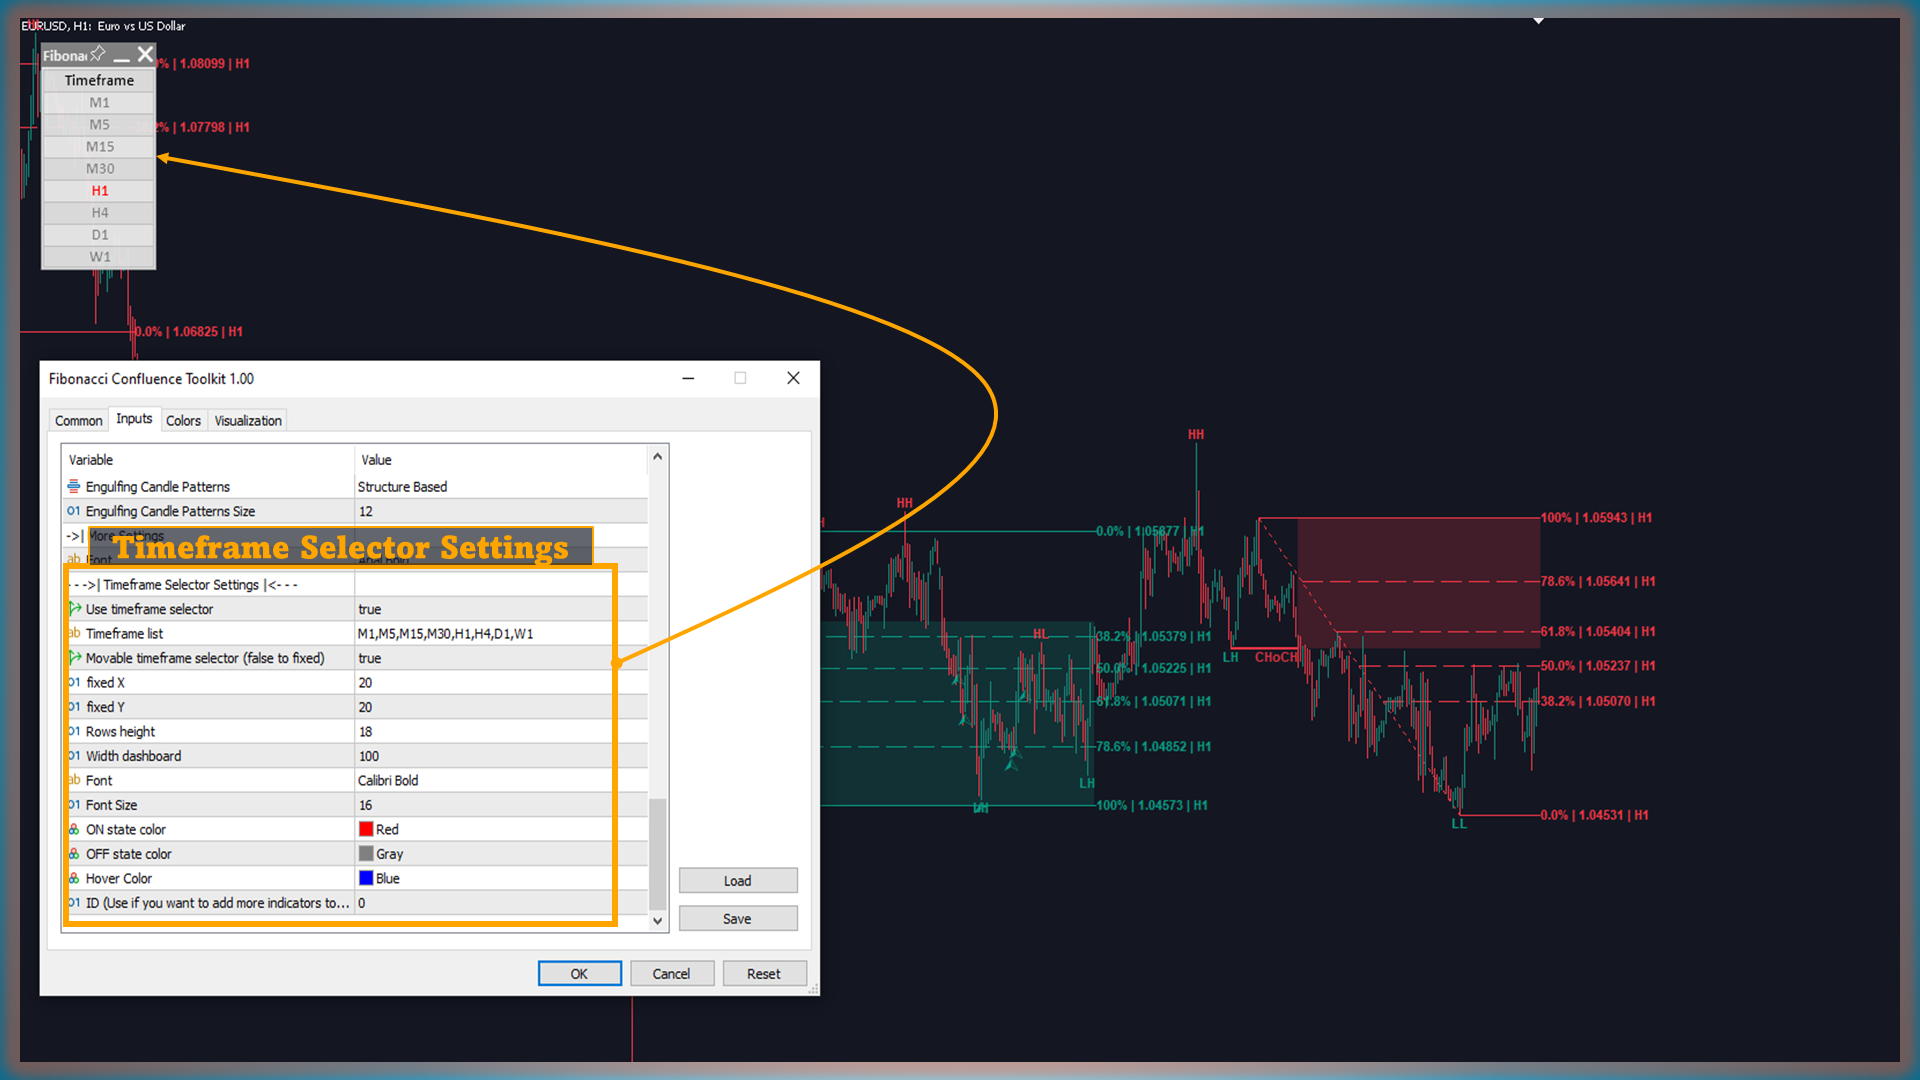
详细设置Multi-Timeframe 版本的一个重要改进是时间框架选择器仪表板,允许您轻松在不同的时间框架之间切换,而无需手动更改设置。此功能不仅节省时间,还帮助您快速识别各个时间框架的交易机会。
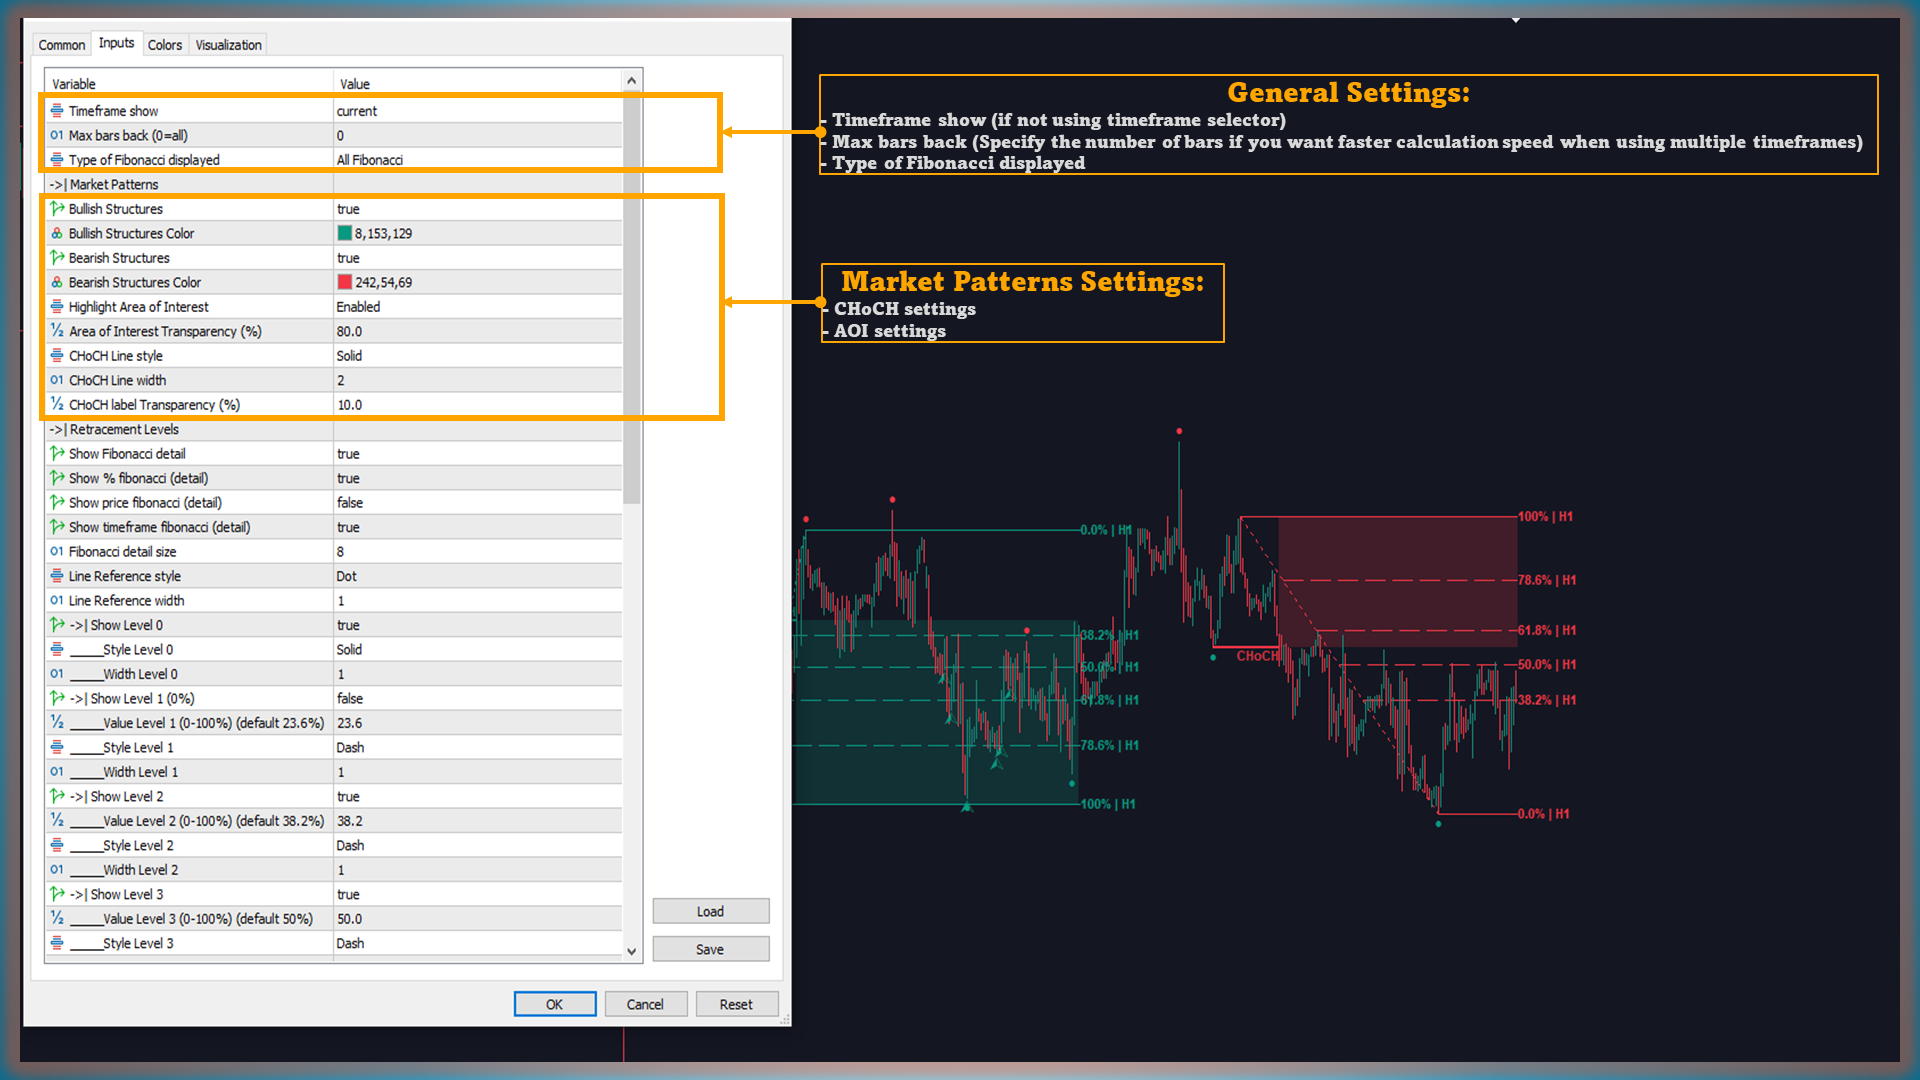
市场模式
- 看涨结构:启用或禁用指标的所有看涨组件。
- 看跌结构:启用或禁用指标的所有看跌组件。
- 高亮兴趣区域:切换高亮显示兴趣区域的选项。
- CHoCH 线:选择 CHoCH 的线条样式(实线、虚线或点线)。
- 宽度:调整 CHoCH 线的宽度。
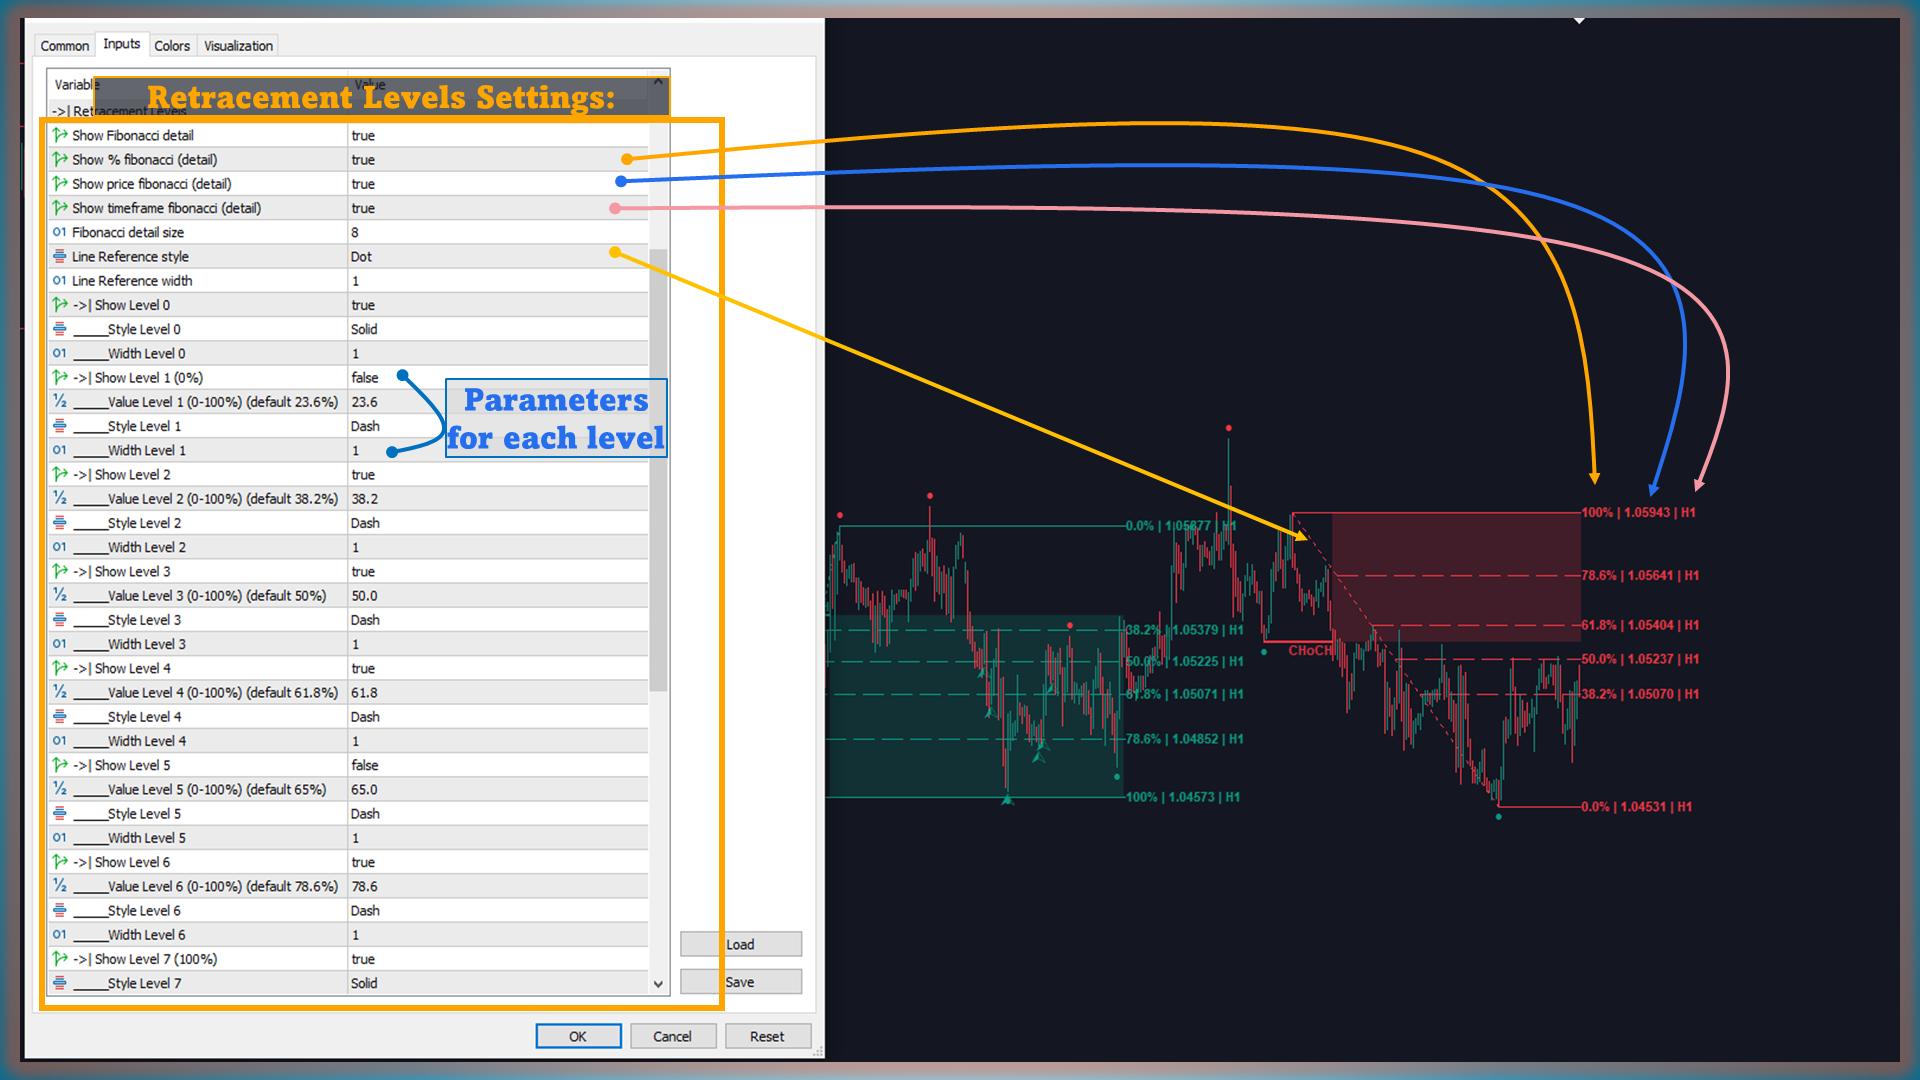
回撤水平
- 选择要显示哪些斐波那契回撤水平(例如,0、23.6、38.2 等)。
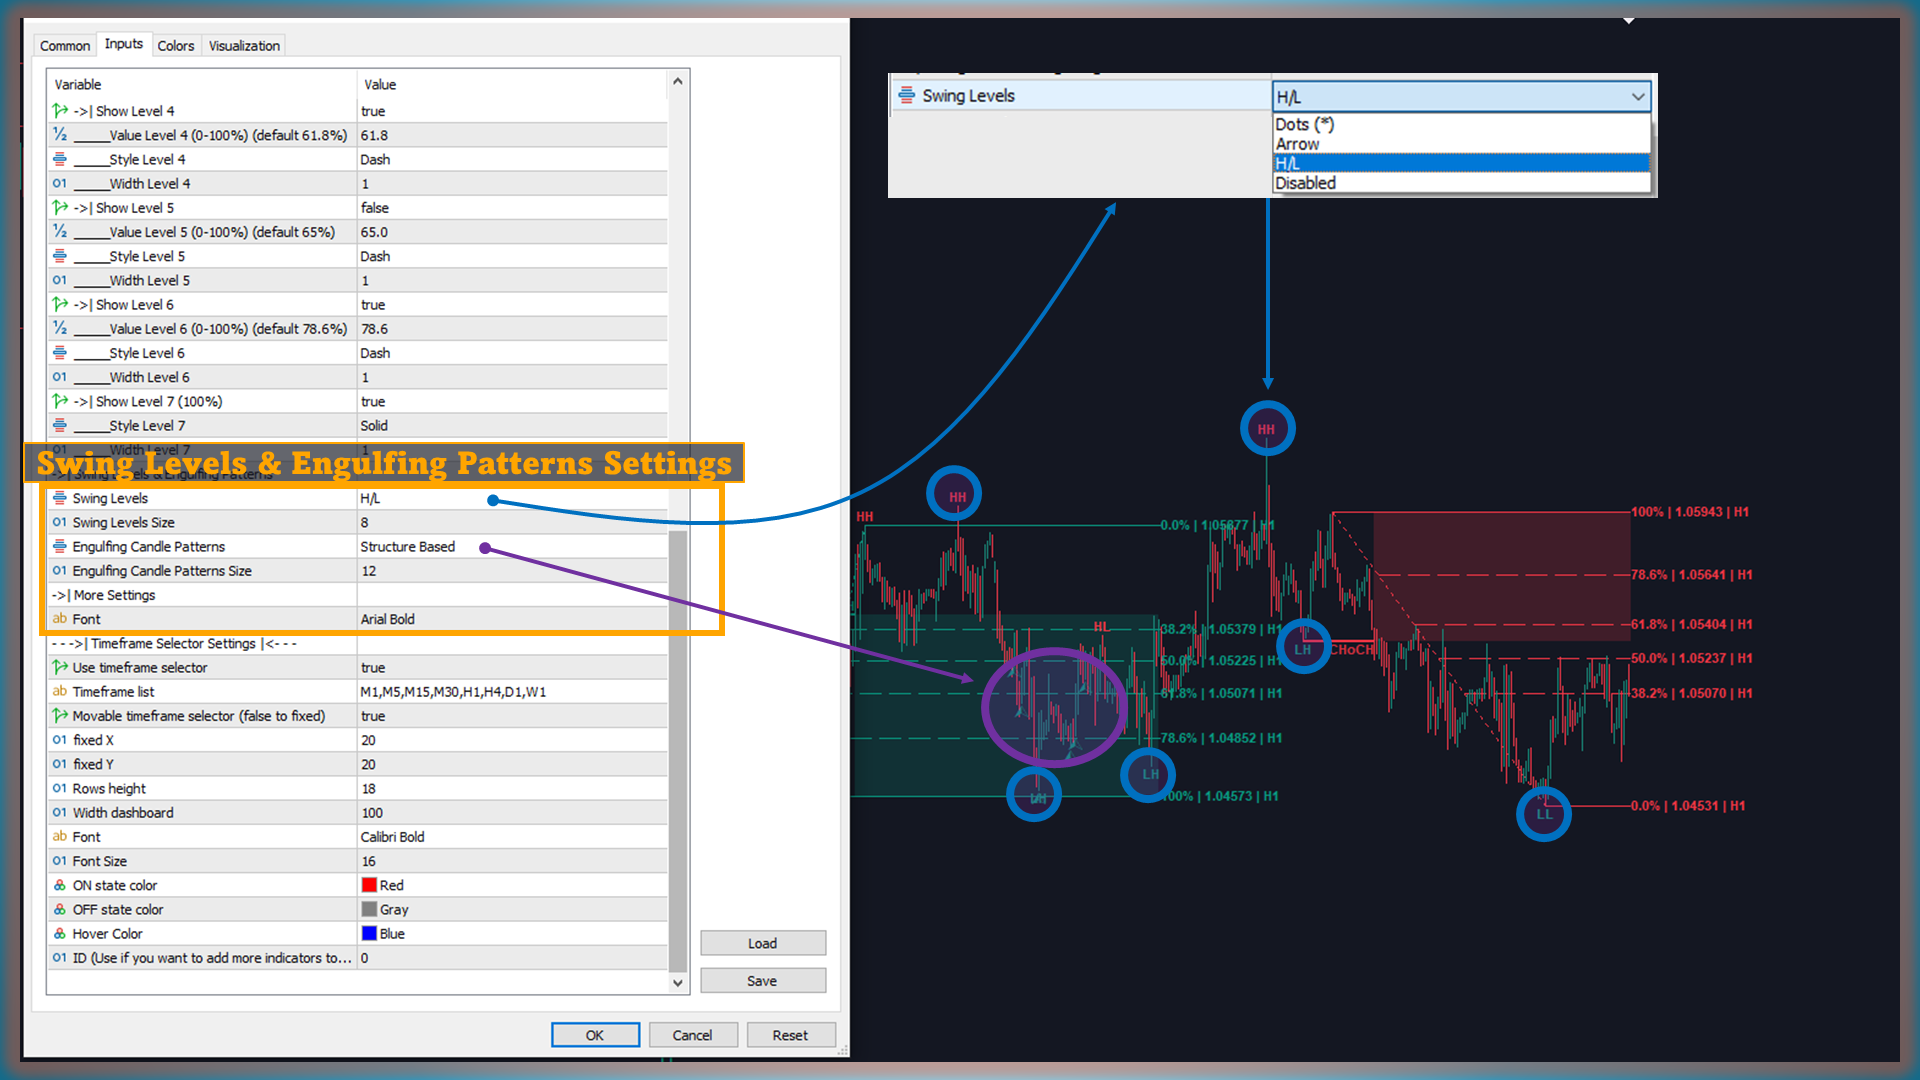
摆动水平和吞没形态
- 摆动水平:选择如何标记摆动水平(符号如点、箭头或高/低)。
- 吞没蜡烛形态:选择要检测哪些吞没蜡烛形态(全部、基于结构或禁用)。
使用 Fibonacci Confluence Toolkit Multi-Timeframe 的优势时间框架选择器设置
- 准确的分析:基于纯粹的价格模式,消除了用户定义输入的需要,确保客观和稳健的市场分析。
- 节省时间:自动化复杂的分析步骤,让您专注于您的主要交易策略。
- 策略多样化:支持多种时间框架和多样化的信号,适用于不同的交易风格。
- 增强的汇聚性:结合斐波那契元素和蜡烛形态,识别更精确的入场点,最小化风险并优化利润。
Fibonacci Confluence Toolkit Multi-Timeframe 是任何希望增强分析能力和优化交易策略的交易员不可或缺的工具。凭借多时间框架分析、自动应用斐波那契回撤和吞没蜡烛形态检测等强大功能,您将在识别和抓住波动市场中的交易机会时始终保持优势。
The Fibonacci Confluence Toolkit is invaluable for pinpointing potential swing points. it effectively identifies key support and resistance areas and guides entry and stop-loss placement. if you're familiar with Fibonacci retracements, you'll appreciate the power of this tool. A big thanks to the developer for bringing this to the MT4 platform!