ARKA Qstick MT5
- 指标
-
Aren Davidian
 Hello, I'm Aren Davidian, the founder and visionary behind ARKA, your go-to source for cutting-edge trading tools and expert insights. With over 14 years of experience in IT security within the Forex market, my journey into this captivating world began nearly four years ago.
 - 版本: 2.80
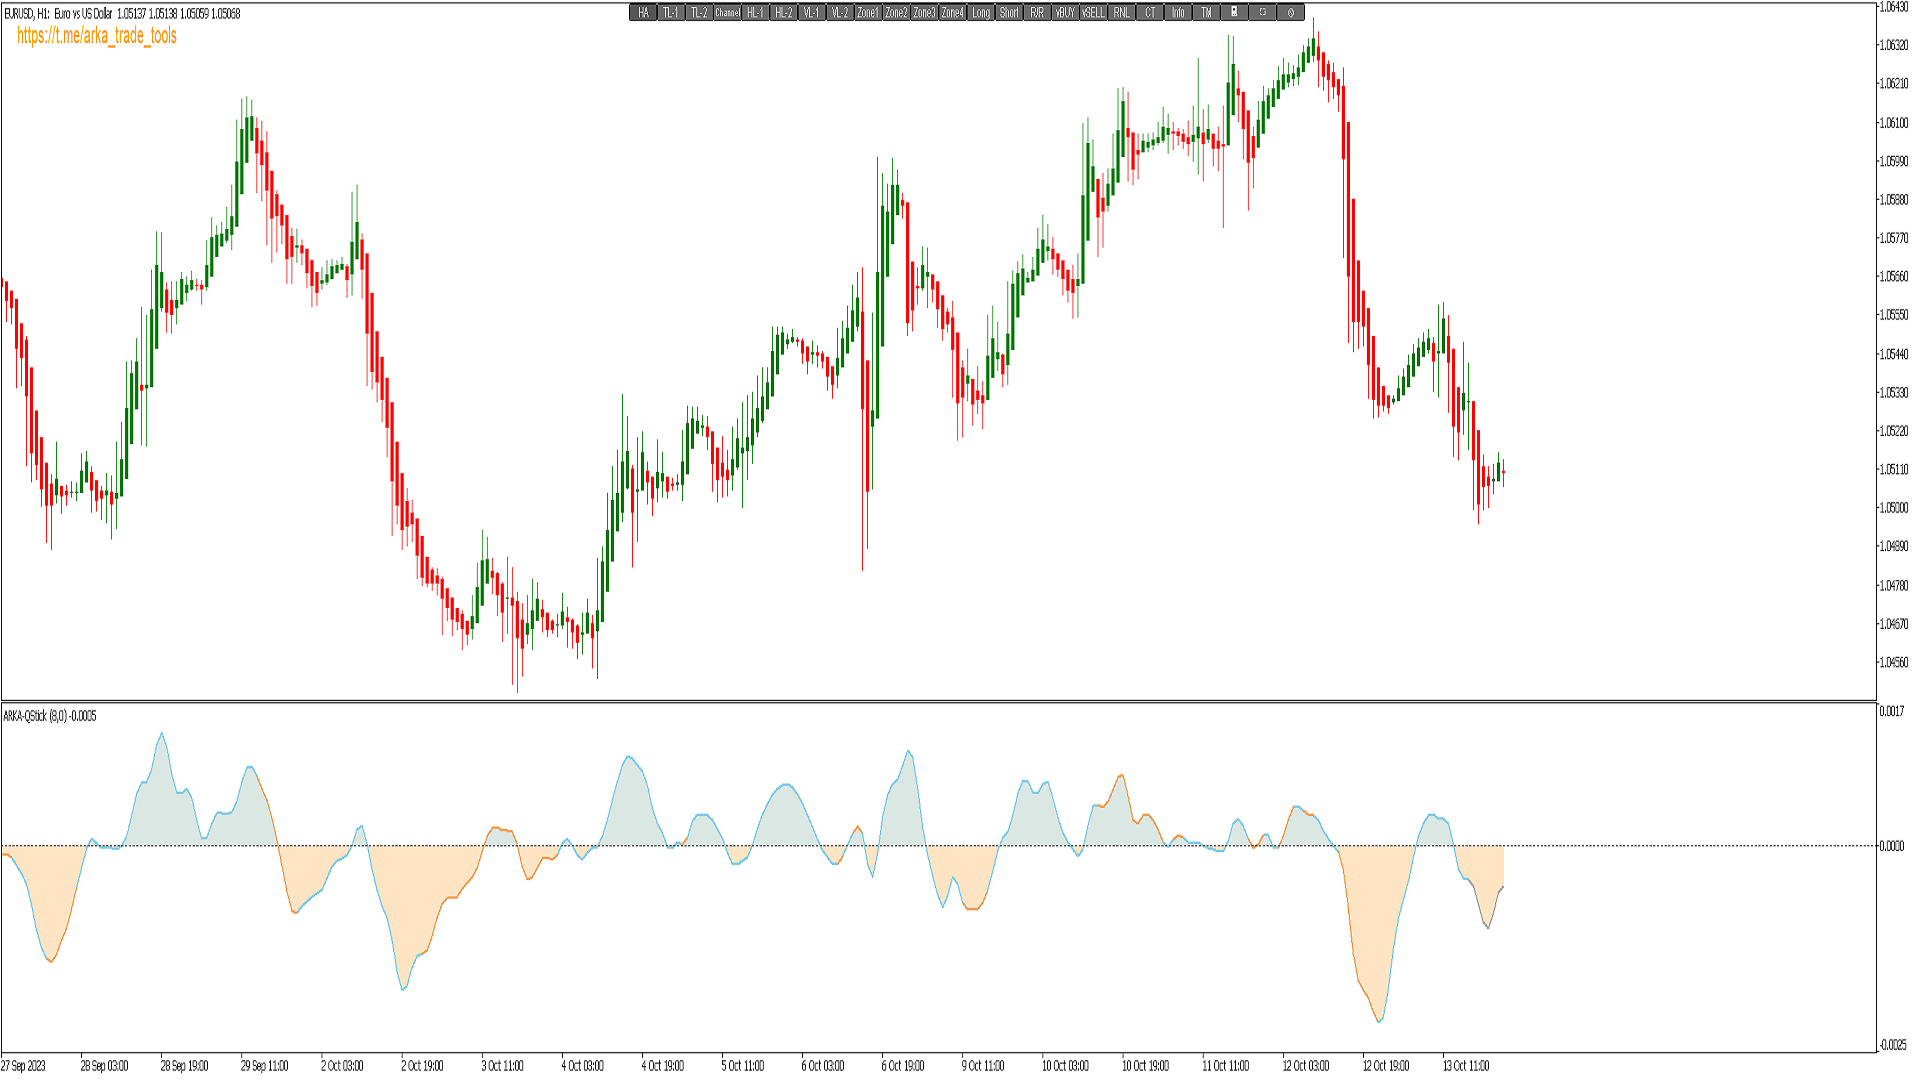
This indicator idea comes from Tushar Chande called Qstick.
Technical indicators quantify trend direction and strength in different ways.
One way is to use the difference between close and open for each bar and to sum it up over a period of time.
The formual is:
Qstick (period ) = Average ((close-open ), period )
In this indicator, we can choose how to calculate body by two famous chart types. The first and default indicator settings are based on Heiken Ashi chart, and the second is based on the Candlesticks chart.
If the resulting value is positive, the trend is considered up and shows with the blue color; otherwise,
the trend is considered down it shows with red color.
When Qstick value is greater than zero means that the majority of the last 'n' days(the default value is 8)
have been up, indicating that buying pressure has been increasing. Vice versa, when Qstick value is lower than zero means that the majority of the last 'n' days have been down, indicating that selling pressure has been increasing.
Crossing Qstick above Level Zero is used as bullish bias (long entry signal) because it is indicating
that buying pressure is increasing, while bearish bias (short entry signal) comes from the indicator
crossing down through zero. This indicator can be part of trading systems and we can use it to confirm our signals.