Williams True Zone Strategy
- 指标
- 版本: 2.63
- 更新: 29 三月 2026
- 激活: 5

Williams Chaos Strategy —— 威廉希尔混沌交易策略
Williams Chaos Strategy 是一款基于比尔·威廉姆斯(Bill Williams)经典指标组合(鳄鱼线 Alligator、分形 Fractals、动量真意指标 AO 和加速震荡指标 AC)协同增强开发的专业交易工具。我们采用了这套传奇交易系统,并针对当今高波动性市场(尤其是黄金 XAUUSD)进行了深度优化。
为什么选择这款指标?
-
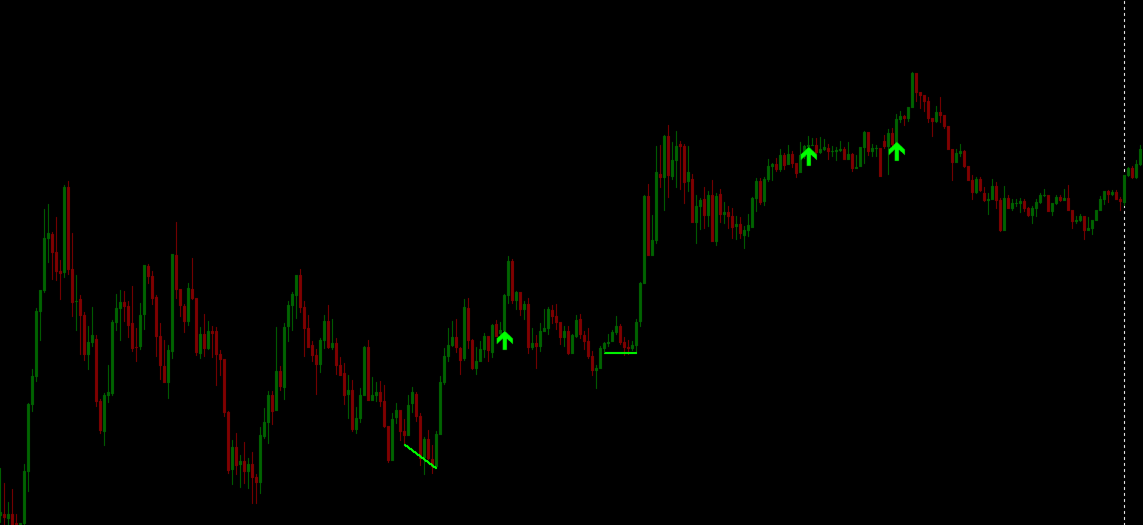
100% 无重绘 (No-Repaint): 信号在蜡烛收盘时固定。一旦箭头出现,它将永久保留,绝不消失或跳动。
-
三重过滤机制: 只有当价格突破分形水平、鳄鱼线“觉醒”且驱动力(AO+AC)确认动能大爆发时,指标才会发出信号。
-
极强的通用性: 算法会自动根据不同的时间周期调整搜索深度——从 M5 的超短线头寸到 H4 和 D1 的趋势持仓交易。
-
简洁直观的图表: 您无需让繁杂的指标占据屏幕,只需关注清晰的入场箭头,助您做出果断决策。
如何交易?
-
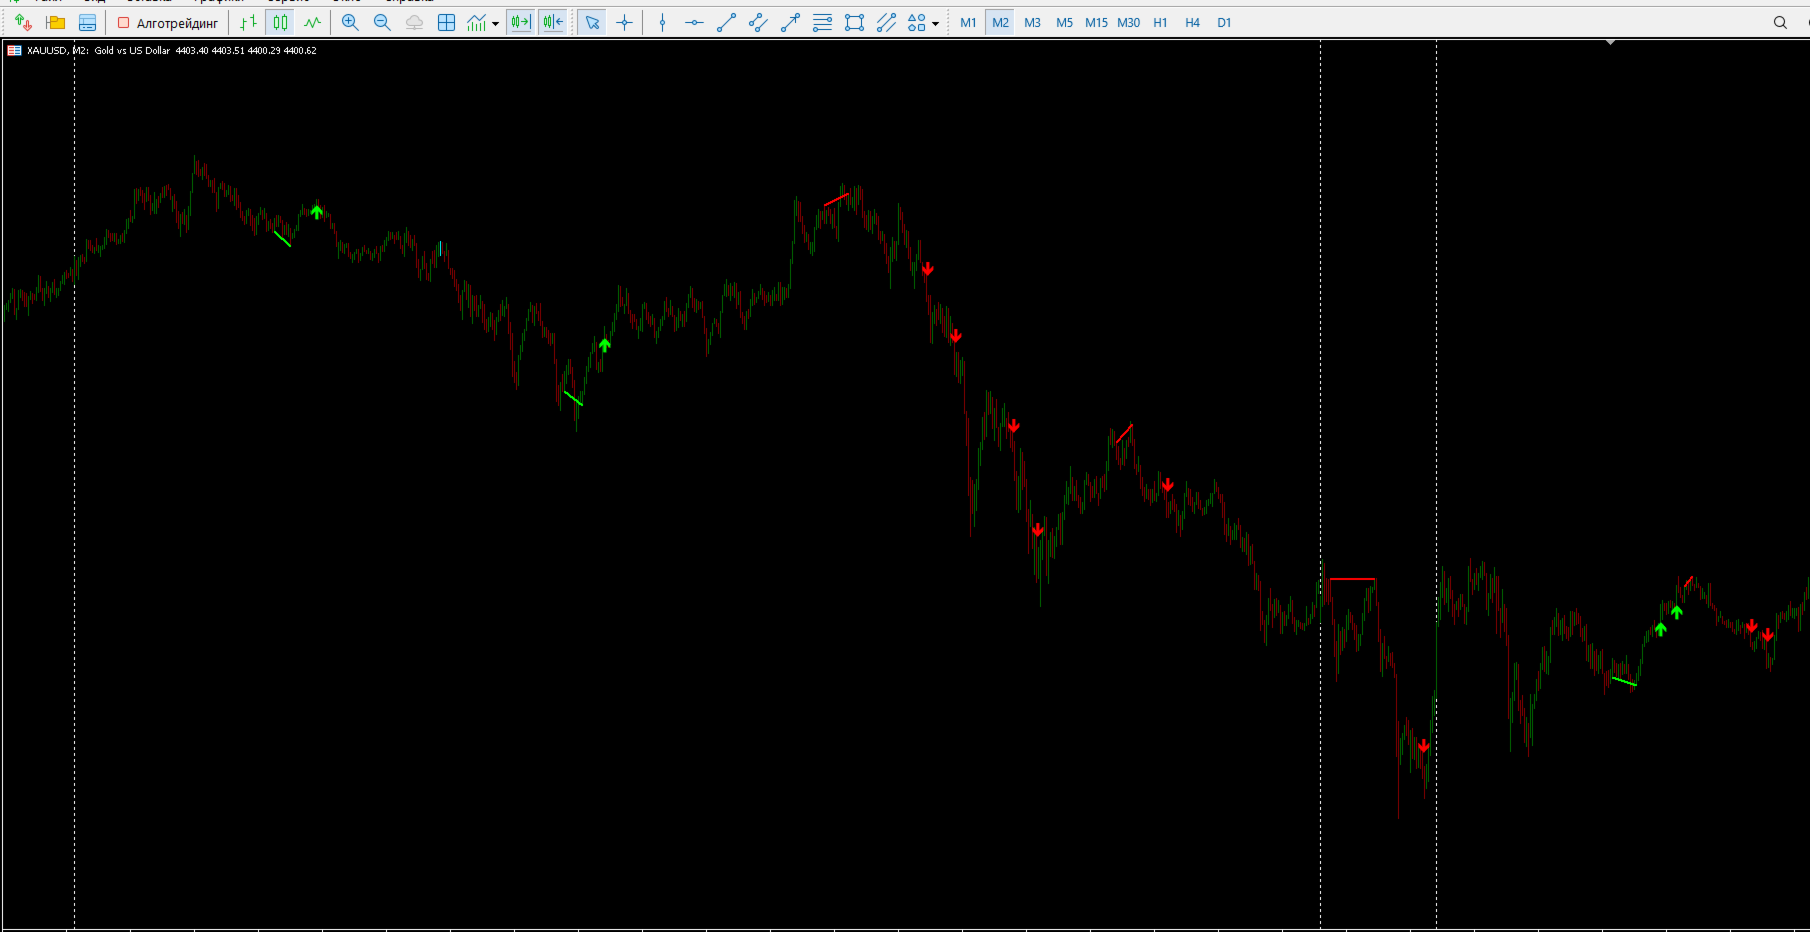
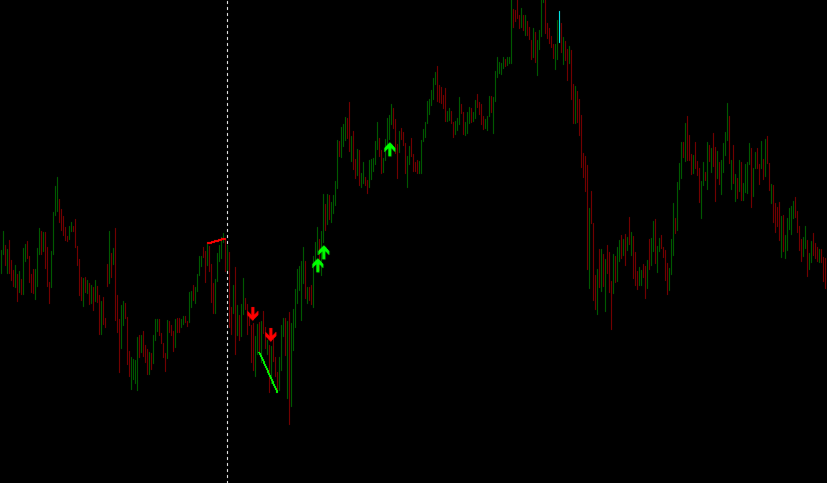
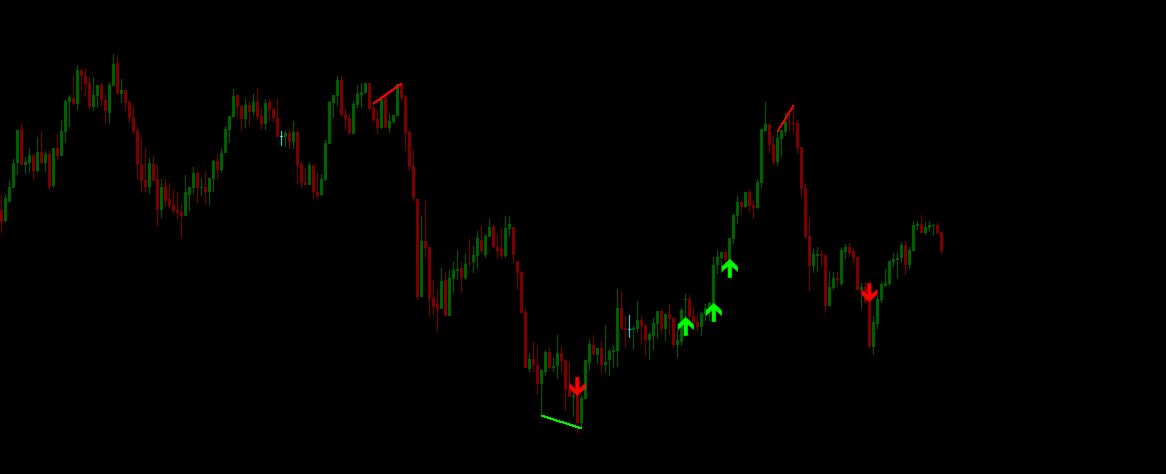
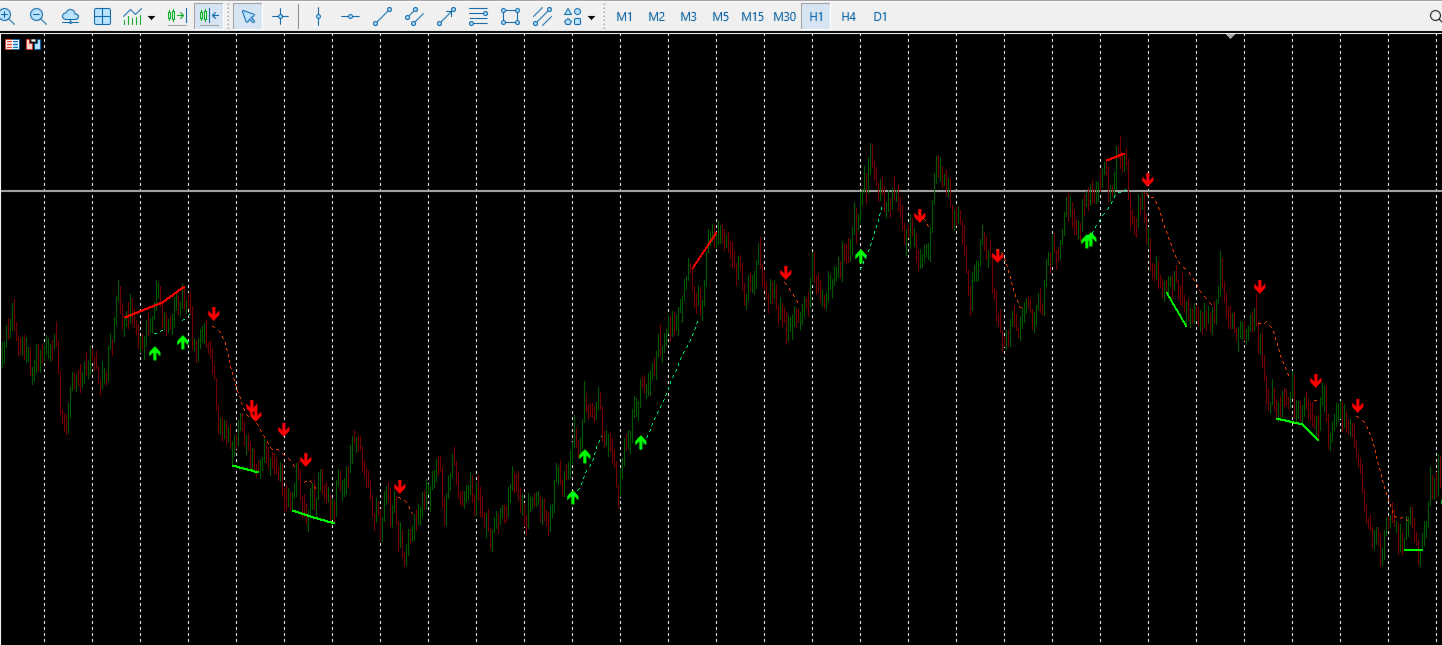
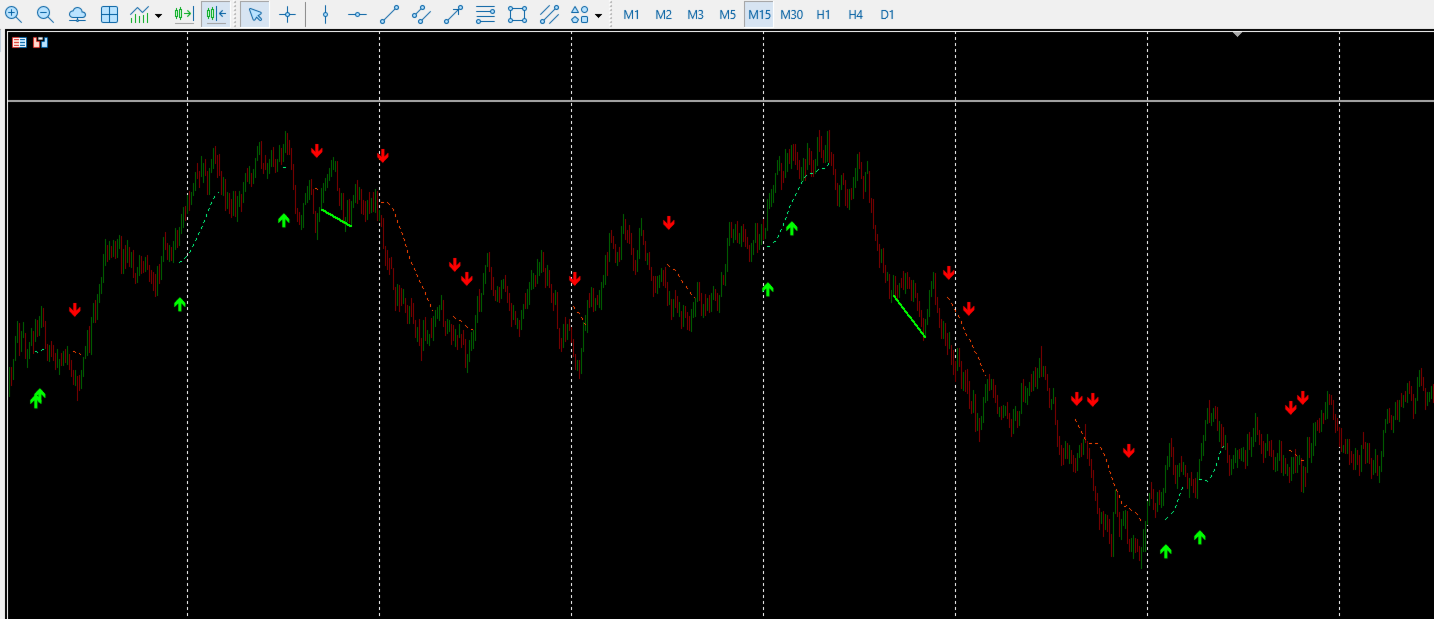
绿色箭头: 当鳄鱼线开启且处于“绿色区域”时,向上突破分形水平。**买入(Buy)**的理想时机。
-
红色箭头: 当鳄鱼线开启且处于“红色区域”时,向下突破分形水平。**卖出(Sell)**的理想时机。
推荐配置:
-
交易品种: XAUUSD (黄金), GBPUSD, EURUSD, BTCUSD。
-
时间周期: 推荐使用 M15、M30 和 H1,以获得最高精准度。
-
技术兼容: 完全支持通过 iCustom 函数与任何 EA 交易机器人无缝集成。


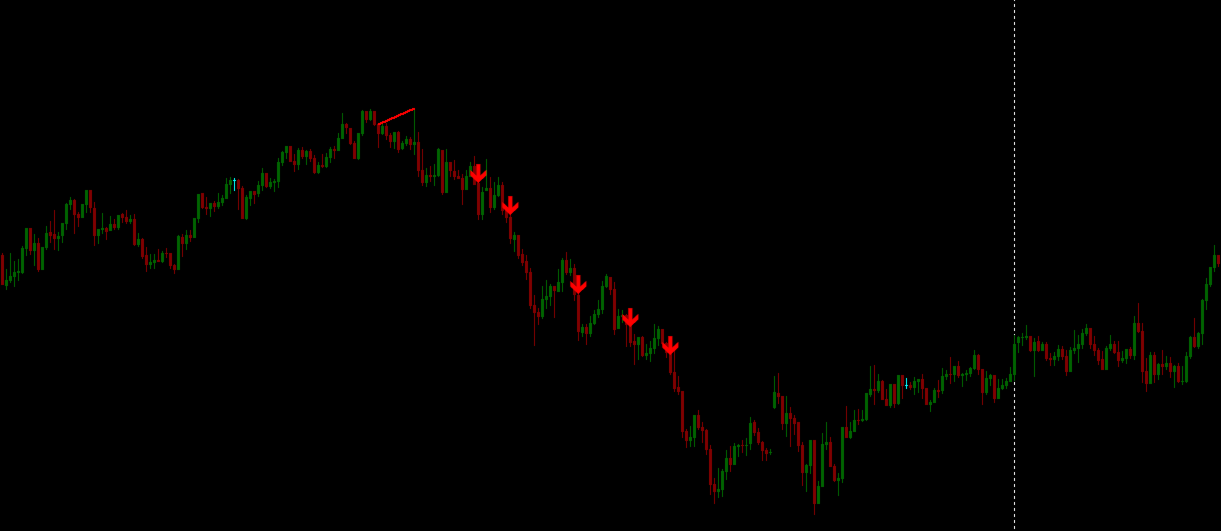

⭐⭐⭐⭐⭐ I’ve been using the Williams True Zone Strategy indicator for some time now and I’m genuinely satisfied with its performance. The signals are clean, non-repainting, and based on closed candles, which makes it much easier to trust the setup logic in live market conditions. The combination of Alligator trend detection, fractal breakout confirmation, and AO/AC momentum alignment provides a structured, rule-based approach that helps eliminate emotional decision-making. Especially on XAUUSD, the indicator does a solid job filtering out false breakouts and highlighting meaningful trend continuation opportunities. It keeps the chart uncluttered while still delivering precise entry signals. Overall, a reliable execution-focused tool for traders who prefer confirmation-based strategies over guesswork.