Swing Scanner MT5
- 指标
- 版本: 1.10
- 更新: 20 二月 2026
- 激活: 20

** All Symbols x All Time frames scan just by pressing scanner button **
Discount: The price is $70$, But now it is just $39, Limited time offer is active.
*** Contact me to send you instruction and add you in "Swing scanner group" for sharing or seeing experiences with other users.
Introduction:
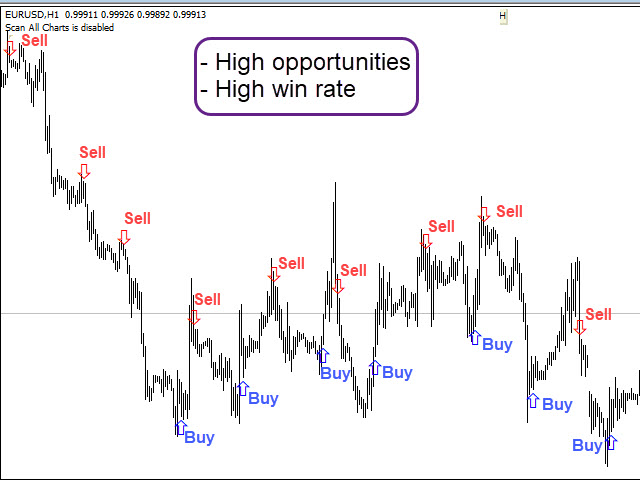
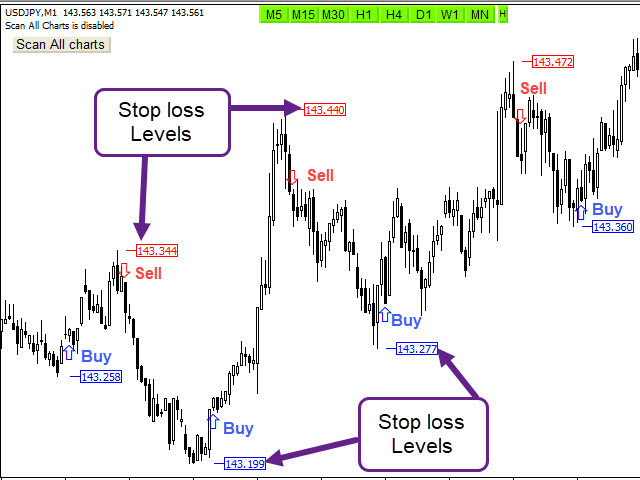
Swing Scanner is the indicator designed to detect swings in the direction of the trend and possible reversal swings. The indicator studies several price and time vectors to track the aggregate trend direction and detects situations in which the market is oversold or overbought and ready to correct.
This indicator shows Swing that is a strong hint for an excellent entry point and finds immediately with alarm and notification and also has stop loss and entry point with candlestick checking for easy trading.
Also it is suitable for scalping in lower time frames.
Main Features:
- Detect the best and most successful point of trend or reversal trend
- Easy-to-use and user-friendly indicator
- NO repaint
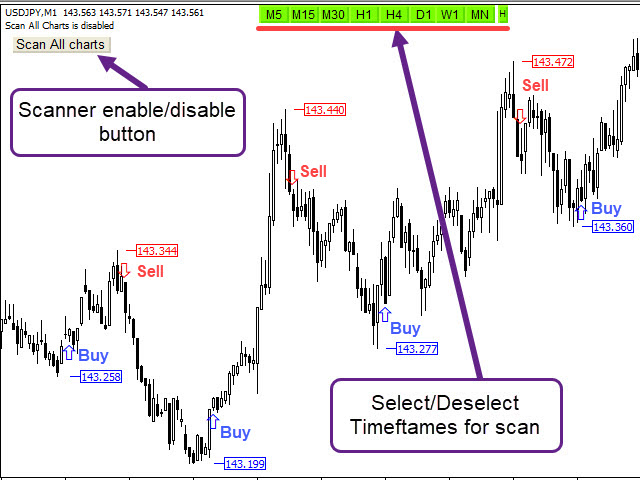
- Scan All charts button ( Forex, Crypto, Indices and commodities )
- Select and deselect time frames button for scan (M1,M5,M15,M30,H1,H4,D1,W1,MN)
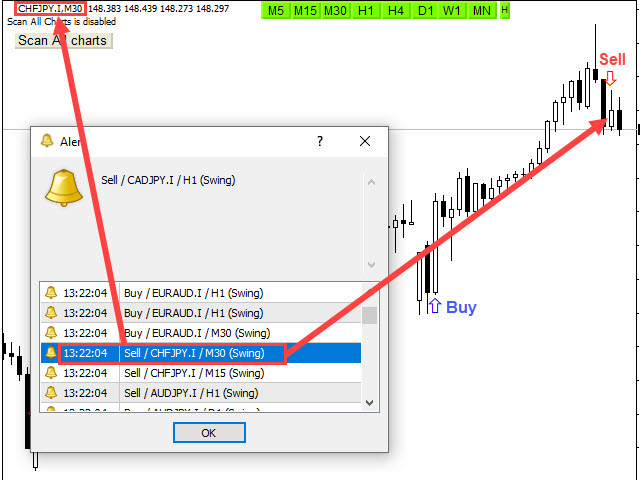
- It displays and pushes notification stop-loss and entry-point
- Candlestick check for the best entry point
- Use Fibonacci levels
- Sending the alert, push and email notification
- Alert enable/disable base on your setting time
- Adjust the pattern setting
Input Parameters :
=========Scanner============
- Scan All Charts – Enable
- Scan the number of candles – Amount of history bars to evaluate
- Re-scan Timer – Re-scan all charts in all time frames after passing time
- Breakout mode - Regular/Medium/Strong breakout /Level breakout
=======Display/style Options============
- Display Options – Display or do not SL levels
- Stop Loss levels and Breakout Style - Set the Fonts and colors of patterns
========ALERT SETTINGS ==========
- Display Alert or Push Notification – Enable or disable Alert or Push Notification
- How many candles are past a pattern – Maximum Number of candles Passed from a pattern to allow alert
- Alert Buffer Size – Maximum save alert to prevent duplicate alerts
- Alert start/end time – Determine trading hours based on the computer clock to activate and deactivate the alarm

Great indicator!!