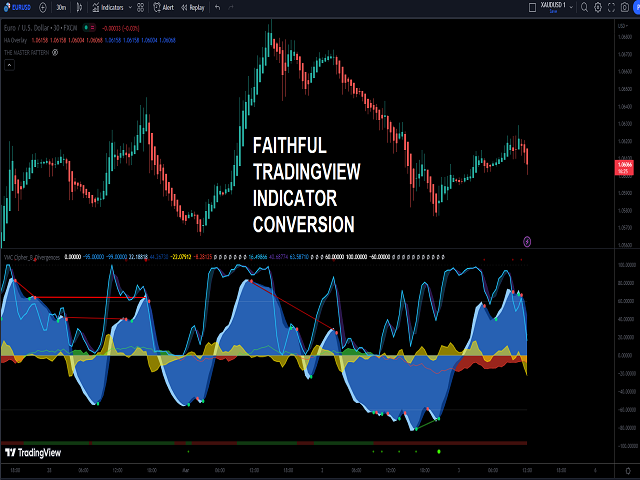
Cipher B Divergences

4.8
Finally a Metatrader version of the very popular (and expensive) Market Cipher B indicator, or the Vumanchu Cipher B + Divergences very popular on Tradingview platform.

This tool is very heavy on calculations, total are 31 plots using 97 buffers from several indicators. On my mid end computer, timeframes below M15 start getting a bit laggy, so it would require a powerful computer to run it properly at very low timeframes. It's still usable here, but somewhat sluggish response in Metatrader (like scrolling the chart back and forth). For that reason a MT4 version is not even possible.

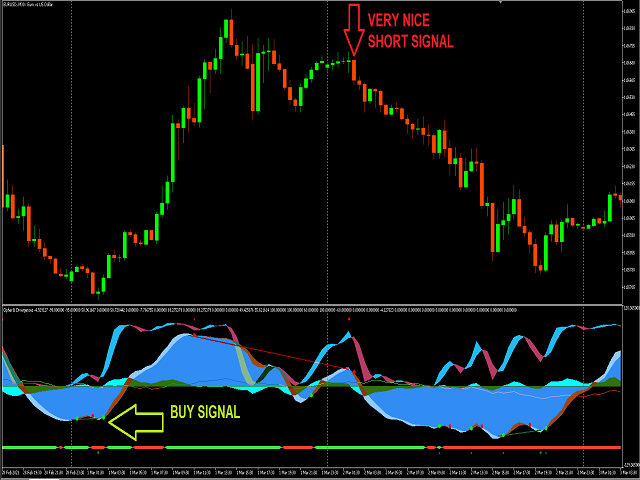
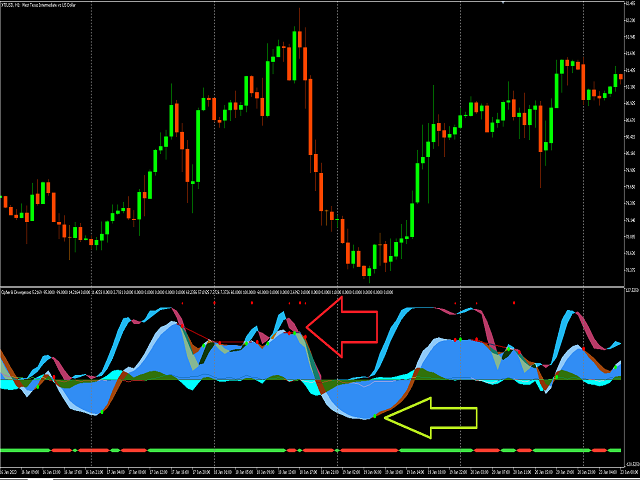
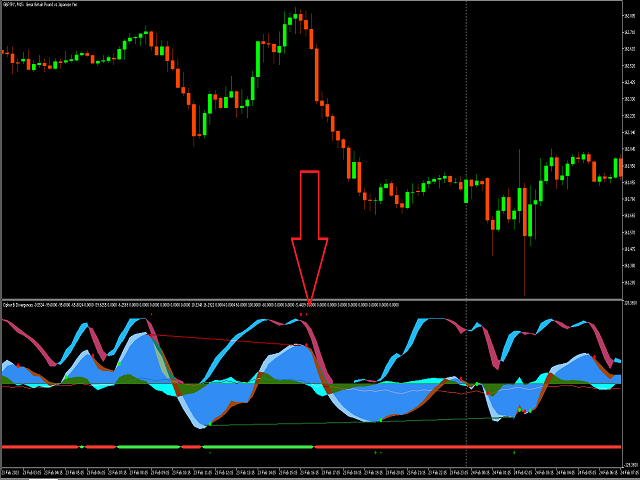
Be reasonable when using the signals: ignore buy signals in a downtrend and favor sell signals (vice versa for an uptrend). On a sideways market it's reasonable to favor both signals.
评分 5
Irusel
704
Irusel 2024.10.29 21:08 
 

Отличный индикатор

Rafal Krzysztof Manuszewski
2387
Rafal Krzysztof Manuszewski 2024.10.06 19:57 
 

super

Van Khiet Tran
142
Van Khiet Tran 2024.03.07 04:31 
 

Excellent!

推荐产品
Valable ZigZag MT5
Sergey Ermolov
4.61 (18)
MT4 版本  | Trend Monitor VZ指標  |   Owl Smart Levels 指標  |  Owl Smart Levels策略  |  FAQ 艾略特波浪理论是对金融市场过程的解释,它依赖于价格图表上波浪的视觉模型。 Valable ZigZag指标显示市场的波浪结构,可用于做出交易决策。 Valable ZigZag指标更稳定,不像经典的ZigZag指标那样经常改变方向,误导交易者。 这是通过在指标波的构造中使用分形来实现的. Telegram 聊天: @it_trader_chat 新的 Expert Advisor Prop Master   - 在您的交易终端中进行测试 https://www.mql5.com/zh/market/product/115375 Valable ZigZag主要是一个趋势指标。 它设定了交易者应该交易的主要方向,但它也可以作为进入市场的指标。 例如。 在H4时间帧图表上安装指标,最后一波的方向将显示趋势的方向。 选择趋势交易方向后,切换到H1时间框架,并在针对所选趋势的最后一个峰值的细分处进入市场(见图2)。 Va
FREE
The   DailyWeeklyMarkers   indicator helps traders visualize trading weeks by clearly marking the start of each day and week on the chart. It draws vertical separator lines for each day (including weekends if enabled) and highlights the beginning of new trading weeks with double lines for better clarity. This makes it easier to analyze price action within daily and weekly contexts. Who Is This Indicator For? Swing Traders   – Helps identify weekly opening gaps and key levels. Day Traders   – Vis
FREE
Hunttern ZigZag MT5
Hassan Gh Fakhraei
5 (1)
Hunt markets with Hunttern ZigZag . Easy to use with one parameter    You can use it for the following:       -Classic patterns       -Heads and shoulders       -Harmonic patterns       -Elliott Wave       -Support and resistance       -Supply and Demand Single parameter:      -Period (1-120) Features:        -Candle time        -Single parameter        -Light mode template This is version 1 of Hunttern ZigZag. We are very happy to receive feedback from you.
FREE
Pivots Lines
Abakou Nazaire Ayelenou
5 (1)
FREE
Asia Dealing Range with STDV
Jacobus Nicolaas Van Staden
Asia Range STDV  I ndicator This Indicator is designed not only to identify the Asia session trading range and Standard Deviation levels but also to assist traders in creating a systematic entry and exit strategy based on the higher timeframe daily trend . The indicator supports both bullish and bearish scenarios, allowing traders to focus on key moments when the Asia range's high or low is "swept" (broken) in line with the confirmed trend. Strategy Overview: 1. Confirming the Daily Trend (Bul
FREE
Midas VWAP
Paulo Henrique Faquineli Garcia
4 (2)
Volume Weighted Average Price (VWAP) is a trading benchmark commonly used by Big Players that gives the average price a Symbol has traded throughout the day. It is based on both Volume and price. This indicator contains Daily VWAP and MIDAS' VWAP, which means you are able to anchor the beggining of MIDAS' calculations and, therefore you will be able to use this methodology to study price versus volume moves after anchor point. You will be able to anchor up to 3 HIGH MIDAS VWAP's and 3 LOW. Wish
FREE
MultiSymbolsWpr Indice x IBOV
Israel Goncalves Moraes De Souza
O Indicador identifica relação do Índice com a soma dos principais ativos, funciona para qualquer mercado do mund o, possui um oscilador WPR com a soma dos principais ativos escolhidos, indicando a antecipação do movimento em relação ao Índice. Características WPR com a soma dos papéis escolhidos - branco WPR do papel atual - vermelho Canal de Tendência O indicador pode indicar movimento de entradas, sendo: cruzamento das linhas cruzamento da linha Multi Symbols no -50 cruzamento entre os canai
FREE
Novato
Juan Manuel Rojas Perez
5 (1)
Descubre el poderoso aliado que te guiará en el laberinto de los mercados financieros. Este indicador revolucionario te llevará de la incertidumbre a la claridad, permitiéndote identificar con precisión los puntos de inflexión del mercado. Mejora tus decisiones de entrada y salida, optimiza tus operaciones y ¡multiplica tus ganancias con confianza. ¡Para más información, te invitamos a unirte a nuestro canal de Telegram en https://t.me/Profit_Evolution  ¡Allí encontrarás contenido exclusivo, an
FREE
Novato alertas
Juan Manuel Rojas Perez
4.75 (4)
Descubre el poderoso aliado que te guiará en el laberinto de los mercados financieros. Este indicador revolucionario te llevará de la incertidumbre a la claridad, permitiéndote identificar con precisión los puntos de inflexión del mercado. Mejora tus decisiones de entrada y salida, optimiza tus operaciones y ¡multiplica tus ganancias con confianza. Ahora con alertas en tu pc o móvil ¡Para más información, te invitamos a unirte a nuestro canal de Telegram en   https://t.me/Profit_Evolution  ¡Al
FREE
Fibo scalping strategy
Komila Safarova
5 (2)
这款 EA 基于斐波那契回撤和斐波那契水平。如果有基于斐波那契水平的信号,它可以同时开立多个买入和卖出仓位。此外,如果账户净值高于账户余额,它还可以根据可用保证金水平跟随趋势开立多个仓位。 我建议您使用美分账户进行对冲。如果您存入 1000 美元,它将相当于 10 万美分。我在 Exness 标准美分账户中验证了这一点,我可能也会向您推荐这家经纪商。我强烈建议您使用美分账户类型,因为我的 EA 风险很高,所以值得冒险尝试。 我建议您使用默认设置,因为我已经多次测试过此设置。 这款 EA 可以交易任何货币对,但我建议您只使用 XAUUSD(黄金),因为该工具在市场波动性较大,而这款 EA 在最高波动性下也能表现良好。 仅适用于 XAUUSD(黄金)工具。 如果你承受不起失去它的风险,就不要冒险。
FREE
Stackable VWAP
Flavio Javier Jarabeck
3.5 (4)
Volume Weighted Average Price (VWAP) is a trading benchmark commonly used by Big Players that gives the average price a Symbol has traded throughout the day. It is based on both Volume and price. Additionally we put in this indicator the MVWAP (Moving Volume Weighted Average Price). For those who do not know the usage and the importance od this indicator I recommend a great article about this subject at Investopedia ( https://www.investopedia.com/articles/trading/11/trading-with-vwap-mvwap.asp
FREE
关于 Range Explosion Range Explosion 是一款功能强大且免费的交易工具,用于检测市场震荡区间、绘制精确的支撑和阻力,并以高精度和精美的视觉效果识别突破机会。 它是 Break Out Explosion 项目的一部分,为初学者和专业交易者提供可靠且先进的解决方案。 如果您对突破交易概念感兴趣,请查看这款用于检测趋势线突破的高级工具: https://www.mql5.com/en/market/product/152676 您想要一个根据此指标箭头进行交易的智能交易系统(EA)吗?您只需通过以下链接以 $30 创建一个直接任务,我将为您制作: https://www.mql5.com/en/job/new?prefered=eeecad 加入此频道以获取   Break Out Explosion 项目   的最新更新和新闻: https://www.mql5.com/en/channels/breakout_explosion_tradingsystem 主要功能 自动区间检测 – 实时识别市场震荡区。 智能突破信号 – 等待价格突破支撑或阻力并标记买
FREE
MultiMA Ichimoku Stochastic Color
Danton Dos Santos Sardinha Junior
精准可视化市场动能 MultiMA_ICHIMOKU_STO_Color 是一款全面的技术分析工具,旨在通过将三个强大的指标结合到一个智能系统中,提供清晰的市场信号。 该指标集成了三条可自定义的移动平均线、一目均衡表(Ichimoku Cloud)的关键组件以及随机震荡指标(Stochastic)。其独特之处在于智能 K 线着色系统,能够即时揭示市场状况:     看涨 (蓝色): 价格位于所有三条均线之上 且 随机指标高于 50,表明强劲的上涨动能。     看跌 (红色): 价格位于所有三条均线之下 且 随机指标高于 50,预示强劲的下跌动能。     中性 (灰色): 混合状况或动能微弱(随机指标低于 50)。 优势:     消除图表杂乱,无需在多个指标之间频繁切换。     一眼识别高概率交易机会。     节省宝贵的分析时间,更快做出更明智的决策。 完全可调的参数允许您根据特定的交易策略和风格定制该指标。利用这个集趋势和动能确认为一体的解决方案,彻底改变您的技术分析。
White Weis Volume Ticks
Ricardo Almeida Branco
5 (4)
White Weis Volume This indicator shows the sum of the volume in each wave, bulish or bearish, as idealized by David Weis , but it brings an important addition , which is the marking of the bar with the highest volume of the wave (White Bar)! In coding the indicator, it was sought to optimize the code to require minimal processing during use and not to overload mt5. The indicator can be used for pre-trading analysis and study, where the trader analyzes possible points of support and resistance
Non Lag Ma
Juan Manuel Rojas Perez
El indicador técnico Non Lag MA (Non-Lagged Moving Average) es una variante de la media móvil que busca reducir el retraso inherente a las medias móviles tradicionales. Pros: - Menos retraso: Al estar diseñado para reducir el retraso, el Non Lag MA puede proporcionar señales más rápidas que las medias móviles tradicionales. - Tendencias claras: Las líneas del Non Lag MA muestran claramente las tendencias alcistas y bajistas, lo que facilita la interpretación de la dirección del mercado. - Pers
FREE
Velas MTF
Juan Manuel Rojas Perez
5 (3)
Velas Multi Time Frame Las velas multi time frame, también conocidas como "MTF candles" en inglés, son un indicador técnico que permite visualizar velas japonesas de un marco temporal diferente al marco temporal principal en el que estás operando. Este enfoque ofrece una perspectiva más amplia del comportamiento del precio, lo que resulta especialmente útil para los traders que emplean estrategias de acción del precio. A continuación, se detallan los conceptos clave relacionados con este indic
FREE
Weis Wave Double Side
Eduardo Da Costa Custodio Santos
The Weis Wave Bouble Side Indicator for MT5 is part of the toolkit (Wyckoff Academy Wave Market) The Weis Wave Bouble side Indicator for MT5 was created based on the already established Weis Wave created by David Weis. The Weis Wave Double Side indicator reads the market in waves as it was done by R. Wyckoff in 1900. It helps in the identification of effort x result, cause and effect, and Supply and demand Its differential is that it can be used below the zero axis, further improving plus operat
前一版本指标的发展 ZigZag WaveSize MT4 ZigZag WaveSize - 修改后的标准锯齿指标,增加了波浪长度、水平和不同警报逻辑的信息 一般改进: 为MetaTrader 5适配代码 优化了图形对象的操作 新特性: 极值处的水平线 选择水平类型:水平线/射线/线段 液性水平滤波器(未被价格突破) 突破缓冲区:设置对错误突破的敏感度 标签设置和功能:数量、外观、删除旧标签 结构突破警报(BoS) 移动性质变化警报(ChoCH) 优化: 修正更新极值的逻辑 动态更新新对象 减少新柱出现时的负载 集中的标签系统 修复: 修复了数组越界问题 正确的标签定位 删除了重复的参数 将ZigZag WaveSize指标作为您交易系统的补充使用   也可以尝试我在市场上的其他产品  https://www.mql5.com/ru/users/capitalplus/seller 如果您喜欢该指标,请对其进行评分并留下评论,这对我来说非常重要! 祝您交易获利丰厚!
FREE
VWAP and MVWAP
Flavio Javier Jarabeck
4.29 (7)
Volume Weighted Average Price (VWAP) is a trading benchmark commonly used by Big Players that gives the average price a Symbol has traded throughout the day. It is based on both Volume and price. Additionally we put in this indicator the MVWAP (Moving Volume Weighted Average Price). For those who do not know the usage and the importance od this indicator I recommend a great article about this subject at Investopedia ( https://www.investopedia.com/articles/trading/11/trading-with-vwap-mvwap.asp )
FREE
Weis Waves(魏斯波浪) 是由大卫·魏斯 (David Weis) 开发的技术指标,灵感来源于理查德·威科夫 (Richard Wyckoff) 的原理。 与传统逐根显示的成交量不同,Weis Waves 将成交量累积为连续的上涨或下跌“波浪”,当价格方向反转时重新开始计算。 这种方法使交易者能够清晰地看到市场运动的 真实力度 ,因为每一波浪都反映了支撑一系列K线的成交量强度。 主要特点: 将成交量分组为买入波浪和卖出波浪。 突出显示市场的主导力量(买方或卖方)。 有助于识别 趋势延续 或 潜在反转 。 基于威科夫方法论,被广泛应用于成交量与资金流分析。 Weis Waves 被众多专业交易者使用,用于分析价格与成交量之间的平衡,提供更深入的市场动态视角。
FREE
Reversal Oscillator — Advanced Momentum Shift Detector Reversal Oscillator is a free indicator designed to highlight price zones that are statistically outside their normal movement patterns, helping traders anticipate potential turning points before they occur. Unlike traditional oscillators that react mainly to overbought/oversold conditions, this indicator applies third derivative analysis (the "acceleration of the acceleration" of price) calculated using two independent methods within a n
FREE
Weis Waves
Flavio Javier Jarabeck
2.83 (18)
The original author is David Weis, an expert in the Wyckoff Method. The Weis Wave is a modern adaptation of the 1930's Wyckoff Method, another expert in Tape Reading techniques and Chart Analysis. Weis Waves takes market volume and stacks it into waves according to price conditions giving the trader valuable insights about the market conditions. If you want to learn more about this subject you can find tons of videos in YouTube. Just look for "The Wickoff Method", "Weis Wave" and "Volume Spread
FREE
This indicator will show you the average entry price for positions, pending orders and both, every side and every type has an different color; It will also show you actual risk, pending risk, both sum and for both sides and the sum of both; you can configure Day, Week, Month and Year Financial Risk to show you if you are close to it; it shows the risk return of each side and both sides too, based on risk and profit for actual position and pending orders
FREE
FVG Concept and Market Structure (MS) Indicator – Comprehensive Analysis with Interactive Control This is not just an indicator. It is a useful tool for market analysis. This indicator combines several analytical functions, making it one of the more complete solutions in its field. This tool represents a comprehensive solution for analyzing market behavior with the goal of forecasting the direction of price movement. The indicator is designed to assist the trader and not distract them with unnec
FREE
Value Chart Candlesticks
Flavio Javier Jarabeck
4.69 (13)
The idea of a Value Chart indicator was presented in the very good book I read back in 2020 , " Dynamic Trading Indicators: Winning with Value Charts and Price Action Profile ", from the authors Mark Helweg and David Stendahl. The idea is simple and the result is pure genius: Present candlestick Price analysis in a detrended way! HOW TO READ THIS INDICATOR Look for Overbought and Oversold levels. Of course, you will need to test the settings a lot to find the "correct" one for your approach. It
FREE
Nameless Stochastic
Flavio Javier Jarabeck
5 (2)
It is the very same classic Stochastic indicator, but with a little twist: NO NAME and data is shown in the sub window. It could be stupid, BUT, if you are running out of space in Micro windows like Mini Charts, where the indicator's name is totally useless, you came to the right place. And that's it! I know it seems stupid but I needed the classical version of Stochastic indicator without that annoying name on my Mini Chart, so I did it that way... The original formula is right from Metaquote's
FREE
VWAP Indicator
LUC JACOBUS A VERHEECKE
4.2 (25)
Volume Weighted Average Price (VWAP) The volume weighted average price (VWAP) is a  trading   benchmark  used by traders that gives the average price a security has traded at throughout the day, based on both volume and price. It is important because it provides traders with insight into both the trend and value of a security. This indicator VWAP V2 is free and is the manual version of the extended Easy VWAP indicator (30 Euro), where the date and time properties are automatically entered. With
FREE
Auto Fibonacci MT5
Teerathad Booranawisedkul
Overview Auto Fibonacci EA is a professional trading tool designed to automatically detect swing points and draw Fibonacci retracement levels on your charts. This indicator helps traders identify potential support and resistance zones based on the golden ratio principles. Key Features Automatic Swing Detection Intelligent algorithm identifies swing high and swing low points automatically Customizable swing detection sensitivity (SwingBars parameter) Works on all timeframes: M1, M5, M15, M30, H1
FREE
LT Agression Indicator
Thiago Duarte
5 (3)
This is a buyer and seller aggression indicator that analyzes the shape of each candle and project this data in a histogram form. There are 4 histograms in one. On the front we have two: Upper - Buyer force. Lower - Seller force. At the background we also have two histogram, both with same color. They measure the combined strenght of buyers and sellers. This histograms can be turned off in Input Parameters. It is also possible to have the real or tick volume to help on this force measurement. IN
FREE
Weis Wave Double Side Alert
Eduardo Da Costa Custodio Santos
The Weis Wave Bouble Side Indicator for MT5 is part of the toolkit (Wyckoff Academy Wave Market) The Weis Wave Bouble side Indicator for MT5 was created based on the already established Weis Wave created by David Weis. The Weis Wave Double Side indicator reads the market in waves as R. Wyckoff did in 1900. It helps in the identification of effort x result, cause and effect, and Supply and demand Its differential is that it can be used below the zero axis and has a breakout alert showing Who is s
该产品的买家也购买
购买此指标即可免费获得我的专业交易管理器。 首先,值得强调的是,这个交易系统是一个非重绘、非重画和非滞后的指标,这使得它非常适合手动和机器人交易。 在线课程,手册和下载预设。 “智能趋势交易系统 MT5”是专为新手和经验丰富的交易者量身定制的综合交易解决方案。它结合了超过 10 个优质指标,具有 7 多个强大的交易策略,使其成为适用于各种市场条件的多功能选择。 趋势跟随策略:提供精确的入场和止损管理,以有效地跟随趋势。 反转策略:识别潜在的趋势反转,使交易者能够利用区域市场的机会。 剃头策略:专为快速准确的日内交易和短期交易而设计。 稳定性:所有指标都不会重绘、不会重画和不会滞后,确保可靠的信号。 定制:支持自定义策略,以满足个人交易偏好。超过 7 种策略和组合可帮助您找到最佳策略。 信号清晰度:提供箭头信号,以指示清晰的入场和退出点。 实时警报:通过交易进出警报使交易者保持了解。 深入分析:提供更高时间框架的趋势分析和实时交易监控。 自适应颜色编码:利用蜡烛颜色编码来显示成交量、趋势和反转蜡烛信号。通过蜡烛颜色分析市场方向。 “智能趋势交易系统 MT5”赋予交易者必要的工具,以便在
SuperScalp Pro
Van Minh Nguyen
5 (2)
SuperScalp Pro – 高级多重过滤剥头皮指标系统 SuperScalp Pro 是一款高级剥头皮指标系统,将经典 Supertrend 与多重智能确认过滤器相结合。该指标在 M1 到 H4 的所有时间框架上均运行良好,尤其适用于 XAUUSD、BTCUSD 及主要外汇货币对。可作为独立系统使用,也可灵活整合到现有交易策略中。 指标集成超过 11 个过滤器,包括快慢 EMA、用于趋势判断的三条 EMA、EMA 斜率 (EMA slope)、RSI、ADX、成交量、VWAP、布林带突破(Bollinger Bands Breakout)以及 MACD 背离过滤器。智能蜡烛过滤器用于确认蜡烛收盘并剔除弱信号,而以三条 EMA 结合 MACD 背离的趋势识别机制则有助于筛选出更高胜率的交易信号。 SuperScalp Pro 基于 ATR 自动计算进场(Entry)、止损(Stop Loss)和止盈(Take Profit)水平。所有重要价格水平均直接显示在图表上,方便用户管理风险并做出更精准的交易决策。 系统在超过 5,000 根蜡烛上进行模拟与性能分析,展示完整指标如胜率、总交
ARIPoint
Temirlan Kdyrkhan
ARIPoint is a powerful trading companion designed to generate high-probability entry signals with dynamic TP/SL/DP levels based on volatility. Built-in performance tracking shows win/loss stats, PP1/PP2 hits, and success rates all updated live. Key Features: Buy/Sell signals with adaptive volatility bands Real-time TP/SL/DP levels based on ATR Built-in MA Filter with optional ATR/StdDev volatility Performance stats panel (Success, Profit/Loss, PP1/PP2) Alerts via popup, sound, push, or email Cu
Entry In The Zone and SMC Multi Timeframe is a real-time market analysis tool developed based on Smart Money Concepts (SMC). It is designed to analyze market structure, price direction, reversal points, and key zones across multiple timeframes in a systematic way. The system displays Points of Interest (POI) and real-time No Repaint signals, with instant alerts when price reaches key zones or when signals occur within those zones. It functions as both an Indicator and a Signal System (2-in-1), c
Azimuth Pro
Ottaviano De Cicco
5 (3)
上市促销 Azimuth Pro 前100位买家特惠价 299 美元。最终价格为 499 美元。 散户与机构入场的区别不在于指标,而在于位置。 大多数交易者在任意价格水平入场,追逐动量或对滞后信号做出反应。机构投资者等待价格到达供需真正转换的结构性水平。 Azimuth Pro 自动映射这些水平:波段锚定VWAP、多时间框架结构线,以及仅在高概率位置出现的ABC形态。 Azimuth Pro 专为需要结构分析和智能自动化的专业交易者打造。 Azimuth 以外科手术般的精度映射市场结构,而Azimuth Pro增加了智能层:自动检测您的交易风格、智能配置的移动平均线,以及经过20年数据回测优化的参数。结果是专业级分析自动适应您的交易品种和时间框架。 这是我们Merkava Labs每天为自己和客户使用的指标。 PRO版本的独特之处 智能配置 Pro版本理解您的交易环境。将它放在EURUSD M15上,它知道您在做日内交易。放在BTCUSD H4上,它会调整为波段交易。无需手动调整。 自适应移动平均线 标准EMA有效。但ATR自适应StepMA(响应波动率)和动
Divergence Bomber
Ihor Otkydach
4.89 (81)
购买该指标的每位用户将额外免费获得以下内容: 原创工具“Bomber Utility”,该工具会自动跟踪每一笔交易,设置止损和止盈点,并根据策略规则自动平仓; 适用于不同交易品种的指标设置文件(Set 文件); 三种不同风险模式下的 Bomber Utility 设置文件:“最低风险”、“平衡风险” 和 “观望策略”; 一套详细的 视频操作手册,帮助您快速完成安装、配置并开始使用本交易系统。 注意: 要获取以上所有赠品,请通过 MQL5 的私人消息系统联系卖家。 我为您介绍原创的自定义指标 “Divergence Bomber”(背离轰炸机),它是一套基于 MACD 背离交易策略 的“全功能”交易系统。 该技术指标的主要任务是识别 价格与 MACD 指标之间的背离,并发出交易信号(包括推送通知),指示未来价格可能的运动方向。平均而言,这些信号的准确率超过 98%。有关该指标如何工作的详细说明,请观看本页面上的视频演示。 该系统使用 止损订单 和 动态回撤平仓机制 来管理交易。 Divergence Bomber 指标的主要特点: 支持交易的品种: AUDCAD、AUDCHF、AUDSG
Power Candles MT5
Daniel Stein
5 (6)
Power Candles – 适用于所有市场的基于强度的入场信号 Power Candles 将 Stein Investments 经过验证的强度分析直接带入价格图表。与仅对价格作出反应不同,每一根蜡烛都基于真实的市场强度进行着色,使交易者能够立即识别动能累积、强度加速以及清晰的趋势转换。 一套逻辑,适用于所有市场 Power Candles 可自动适用于 所有交易品种 。该指标会检测当前品种是否为外汇货币对或非外汇市场,并在内部自动应用相应的强度模型。 外汇与黄金 使用 FX Power Delta 数值(绝对范围最高至 100) 指数、加密货币和 CFD 使用 IX Power 强度数值(绝对范围最高至 50) 所需的强度计算已直接嵌入 Power Candles。本指标在蜡烛着色和信号逻辑方面无需额外安装任何其他指标。 以强度状态替代价格噪音 每根蜡烛都会被归类为九种清晰定义的强度状态之一: 中性 轻度、中度、强烈、极端空头 轻度、中度、强烈、极端多头 这种基于状态的方法能够过滤随机的价格波动,专注于有意义的市场参与行为。它帮助交易者识别新的方向性阶段正在形成,而不是对单根蜡
Game Changer Indicator mt5
Vasiliy Strukov
5 (15)
Game Changer 是一款革命性的趋势指标,适用于任何金融工具,可将您的 Metatrader 平台升级为强大的趋势分析工具。它适用于任何时间框架,能够帮助您识别趋势、发出潜在反转信号、作为追踪止损机制,并提供实时警报,以便您及时响应市场反应。无论您是经验丰富的专业人士,还是寻求优势的初学者,这款工具都能让您充满信心、纪律严明地进行交易,并清晰地理解潜在的趋势动态。该指标支持重绘功能。 购买后请立即联系我,即可获得专属赠品。您可以免费获得我们的“强支撑”和“趋势扫描器”指标,请私信联系我。 请注意,我不会在 Telegram 上出售我的 EA 或特殊设置,它们仅通过 Mql5 提供,我的设置文件也仅发布在我的博客上。谨防诈骗,切勿从其他任何人处购买任何设置。 设置 启用趋势变化提醒 - 真/假 - 趋势变化时在图表上显示提醒 发送推送通知 - 真/假 - 启用向手机推送提醒通知 发送邮件通知 - 真/假 - 趋势变化时向邮箱发送邮件通知
Atomic Analyst MT5
Issam Kassas
4.07 (28)
首先值得强调的是,该交易指标是非重绘、非延迟的指标,这使其成为手动和机器人交易的理想选择。 用户手册:设置、输入和策略。 Atomic Analyst是一种PA价格行动指标,利用价格的力量和动量来寻找市场上更好的机会。配备了高级过滤器,可帮助去除噪音和假信号,并提高交易潜力。使用多层复杂的指标,Atomic Analyst扫描图表,并将复杂的数学计算转化为任何初学者都能理解并用来做出一致交易决策的简单信号和颜色。 “Atomic Analyst”是专为新手和经验丰富的交易者量身定制的综合交易解决方案。它将高级指标和一流功能融合为一体的交易策略,使其成为所有类型交易者的多功能选择。 日内交易和剥头皮策略:专为快速准确的日内交易和短期交易而设计。 日内和摆动交易策略:可用作追求价格大幅波动的日内和摆动交易者的可靠工具。 多货币和市场:凭借其可靠的精度,在不同的工具和市场上运作。 多个时间框架:可在多个时间框架上使用,性能良好。 稳定性:所有指标均不重绘、不重绘和不滞后,确保可靠的信号。 信号清晰度:提供箭头信号,用于清晰的入场和出场点。 实时警报:通过交易入场、SL和TP警报通知交易者
FX Trend NG:新一代多市场趋势智能分析工具 概述 FX Trend NG 是一款专业的多时间周期趋势分析与市场监控工具,帮助您在几秒钟内全面了解市场结构。 无需在多个图表之间来回切换,您可以立即看到哪些品种处于趋势中、哪里动能正在减弱,以及哪些时间周期之间存在强烈共振。 限时发布优惠 – 仅需 $30(6个月) 或 $80 终身授权 即可拥有 FX Trend NG 。 已经是 Stein Investments 客户? -> 发送消息 以获取专属客户群访问权限。 需要帮助或安装指导? -> 请访问 Stein Investments 官方页面 。 1. FX Trend NG 的核心优势 三状态趋势逻辑 —— 不只是 Buy 或 Sell • 大多数指标仅显示两种状态:Buy 或 Sell。 • FX Trend NG 增加第三种状态: Fade 。 • Fade 表示趋势强度正在减弱,在完全反转之前提前发出信号。 这种结构化逻辑让您看到趋势变化过程,而不仅仅是简单方向信号。 多时间周期分析(M1 至 MN1) • 从短线交易到中长线交易全面覆盖。 • 快速识别趋势
每天,许多交易者都会遇到一个常见的挑战:价格似乎突破了关键水平,他们进场交易,然后市场反转,触发止损。这被称为假突破——价格短暂突破支撑或阻力水平后反转的走势。这些走势可能导致在实际价格方向明确之前就触发止损。 在技术分析中,这种现象通常被称为"流动性扫荡"(liquidity sweep)或"猎杀止损"(stop hunt)。 Mirage Trading System 是一款专为检测假突破形态而设计的指标。"Mirage"意为幻象——指的是市场中频繁出现的假突破形态。 虽然假突破可能让许多交易者措手不及,但 Mirage Trading System 旨在识别这些形态何时形成,并指示随后价格走势的潜在方向。 上市期间套餐 在上市期间,购买 Mirage Trading System 包含三款附加产品:Smart Trend Consensus MT5($39)、Price Volume Distribution MT5($69)和 EA Signal Template($100)。这些产品在此期间免费提供。购买后请联系我以获取它们。 附带指标和EA的安装指南   —   EA Si
FX Power MT5 NG
Daniel Stein
5 (31)
FX Power:分析货币强度,助您做出更明智的交易决策 概述 FX Power 是一款专业工具,帮助您全面了解主要货币和黄金在任何市场条件下的真实强度。通过识别强势货币用于买入,弱势货币用于卖出, FX Power 简化了交易决策,并帮助您发现高概率的交易机会。不论您是想跟随趋势还是通过极端的 Delta 值预测反转,这款工具都能完美适应您的交易风格。别再盲目交易——用 FX Power 让您的交易更加智慧。 1. 为什么 FX Power 对交易者极具价值 实时货币和黄金强度分析 • FX Power 实时计算并显示主要货币和黄金的相对强度,助您全面了解市场动态。 • 监控领先或落后资产,轻松识别值得交易的货币对。 全面的多时间框架视图 • 跟踪短期、中期和长期时间框架的货币和黄金强度,以便将您的交易策略与市场趋势保持一致。 • 无论是快进快出的短线交易还是更长期的投资策略, FX Power 都能为您提供所需的信息。 Delta 动态分析用于趋势和反转 • 极端 Delta 值常常预示反转机会,而平缓的 Delta 变化则确认趋势延续。 • 使用 Delta 分析,轻
Entry Points Pro for MT5
Yury Orlov
4.48 (138)
这款指标用于 MT5,可提供准确的入场交易信号,且无重绘。 它可应用在任何金融资产:外汇、加密货币、贵金属、股票、指数。 它将提供极其精准的评估,并告诉您何时开仓和平仓的最佳时机。 观看 视频 (6:22),其中包含一个仅处理单一信号的示例,该信号即可值回指标购价! 大多数交易者在 Entry Points Pro 指标的帮助下,在第一个交易周内即改善了他们的交易结果。 订阅我们的 Telegram 群 ! Entry Points Pro 指标的益处。 入场信号无重绘 如果信号出现,并得到确认,则它不会再消失;不像是重绘指标,它会导致重大的财产损失,因为它们可以在显示信号后再将其删除。 无差错开仓 指标算法可令您找到入场交易(买入或卖出资产)的理想时机,从而提高每位交易者的成功率。 Entry Points Pro 可操作任何资产 它允许您在 MT5 平台上交易任何经纪商的加密货币、股票、贵金属、指数、大宗商品和货币。 提供任何方向的信号 Entry Points Pro 指标提供针对任意价格走势的入场交易信号 - 上涨、下跌或横盘(横向)。 最大盈利潜力 离场信号
“ Dynamic Scalper System MT5 ”指标专为在趋势波内进行剥头皮交易而设计。 已在主要货币对和黄金上进行测试,并可与其他交易工具兼容。 提供顺势短线建仓信号,并提供额外的价格变动支持。 指标原理: 大箭头决定趋势方向。 在趋势波内,我们采用一种生成小箭头形式的剥头皮交易信号的算法。 红色箭头代表看涨方向,蓝色箭头代表看跌方向。 敏感的价格变动线会沿着趋势方向绘制,并与小箭头信号协同作用。 信号运作方式如下:当线在适当时刻出现时,将形成入场信号;在出现线时,持仓;线完成后,平仓。 建议的操作时间范围为M1 - H4。 箭头在当前K线上方形成,如果下一根K线已开仓,则不会重新绘制上一根K线上方的箭头。 输入参数 Trend Wave Period - 趋势方向(大箭头)的周期,改变趋势波的时间间隔。值 1 表示趋势方向的最长持续时间,参数值越大,持续时间越短。 Scalper Arrows Period - 信号箭头(小箭头)的计算周期,改变入场信号的生成频率。值 3 表示最频繁的生成频率,参数值越大,箭头频率越低,准确度越高。 这些参数可以根据不同
Grabber System MT5
Ihor Otkydach
4.82 (22)
向您介绍一款优秀的技术指标——Grabber,它是一套即开即用的“全包式”交易策略。 在一个代码中集成了强大的市场技术分析工具、交易信号(箭头)、提醒功能和推送通知。 每位购买该指标的用户还可免费获得以下内容: Grabber辅助工具:用于自动管理已开仓位 视频操作指南:逐步教学如何安装、设置和使用该指标进行交易 原创Set文件:可快速自动配置,帮助实现最佳交易效果 忘掉其他策略吧!只有Grabber能够真正激励你在交易中攀登新高峰! Grabber策略的主要特点: 交易周期:从M5到H4 适用资产:任意,但我推荐我亲自测试过的品种(GBPUSD、GBPCAD、GBPCHF、AUDCAD、AUDUSD、AUDSGD、AUDCHF、NZDUSD、NZDCAD、EURCAD、EURUSD、EURAUD、EURGBP、EURCHF、USDCAD、USDSGD) 交易时间:全天候 24/7 交易效果:我分享自己的真实交易结果,并在此教学如何操作: https://www.mql5.com/ru/market/product/134563?source=Site+Market+MT5+Indic
Trend Screener Pro MT5
STE S.S.COMPANY
4.84 (100)
使用趋势筛选指标释放趋势交易的力量:由模糊逻辑和多货币系统提供支持的终极趋势交易解决方案! 使用趋势筛选器(由模糊逻辑提供支持的革命性趋势指标)提升您的趋势交易。 它是一个强大的趋势跟踪指标,结合了超过 13 种高级工具和功能以及 3 种交易策略,使其成为使您的 Metatrader 成为趋势分析器的多功能选择。 限时优惠:趋势筛选指标终身仅需 50 美元。 ( 原价 250$ ) (优惠延长) 体验趋势筛选器 100% 无需重新绘制的准确性,确保您的交易决策不受过去价格变化的影响。 释放多时间框架和多货币功能的多功能性,使您能够以无与伦比的信心在外汇、商品、加密货币和指数领域进行交易。 利用 Trend Screener 的综合策略套件增强您的交易: - 趋势跟踪策略和趋势延续策略 :趋势筛选器的趋势跟踪策略提供清晰的趋势延续信号,让您有效捕捉趋势走势并管理风险。 - 反转策略和早期入场点策略 :趋势筛选器的反转策略可检测市场方向的潜在变化,使您能够预测趋势反转并利用疲弱的市场趋势。通过早期入场点,您可以在潜在的趋势变化之前定位自己 获取可观的利润。 - 倒卖策略: 趋势筛选器的倒卖
Transaction Speed MT5
Ivan Stefanov
5 (2)
当然,以下是翻译成中文(简体)的版本: 该指标标出市场中显现出 交易兴趣 的区域,并随后显示 订单积累区域 。它的工作方式类似于大规模的订单簿。 这是为 大资金 打造的指标,性能卓越。市场中有任何兴趣,你都能通过它清晰看到。 (这是一个 完全重写的自动化版本 —— 不再需要手动分析。) 交易速度 是一个全新的概念指标,它显示了市场上大订单 何时 、 何地 聚集,并揭示了其背后的意义。它可以在 非常早期 就检测到趋势的变化。 在外汇市场,所谓的“交易量”实际上是误导性的,因为那指的是价格在单位时间内的变化,因此真正的名称应是“交易速度”。 一切都取决于我们如何思考、如何行动、如何分析。 改变分析范式至关重要。 该指标完全重构了外汇市场上“交易量”的概念,用逻辑方式重新定义并应用,从而成为一个 独特而精准的工具 。 使用方法: 默认情况下,指标处于 自动模式 ,可独立用于任何时间周期。如果你希望切换到手动模式,只需点击 Auto / Manual Mode 按钮即可。 在 手动模式 下,所有计算从 2025年1月1日 开始。你可以根据需要更改该日期,以查看不同的分析结果。 最优数据周期
Smart Stop Indicator – 智能化止损逻辑,直接呈现在您的图表上 概述 Smart Stop Indicator 是为希望以清晰、系统、非情绪化方式设置止损的交易者量身打造的工具。它将经典的价格结构逻辑(更高的高点、更低的低点)与现代突破识别技术相结合,精准标记真正合理的止损位置。无论是趋势、盘整还是快速突破行情,指标都会在图表上直接显示最佳 SL 区域及其状态(“new”、“broken”、“valid”)并且现在新增 SL 与 %ADR 的距离显示。 亮点 基于市场结构的自动止损识别 • 根据市场结构与实时价格行为自动识别关键止损位置。 智能突破适应能力 • 能适应突破与快速方向变化,不会强迫过早调整止损。 SL %ADR 显示 • 显示止损距离占平均日波动范围 ADR 的百分比与 Smart Stop Scanner 完全一致帮助交易者即时识别紧密机会或已延伸的行情。 内置警报逻辑 • 当止损水平变为“new”、“valid”或“broken”时触发警报包含准确的状态切换与冷却逻辑。 破损级别的淡化显示 • 对于“broken”状态的方向、价格、S
Gold Entry Sniper
Tahir Mehmood
5 (3)
Gold Entry Sniper – 专业多周期ATR黄金交易仪表盘,适合黄金剥头皮与波段交易 Gold Entry Sniper 是一款先进的 MetaTrader 5 指标,旨在为 XAUUSD 及其他品种提供精准的 买/卖信号 。基于 ATR 移动止损逻辑 和 多周期分析仪表盘 ,适合剥头皮交易者与波段交易者,帮助识别 高概率黄金入场点 。 主要功能与优势 多周期信号分析 – 同时显示 M1、M5、M15 趋势方向。 基于ATR的动态止损 – 根据波动性自动调整。 专业图表仪表盘 – 展示信号状态、ATR水平、线性回归中线和交易方向。 清晰买卖标记 – 自动箭头与文字标签提示。 离场提示与交易管理 – 自动检测离场信号锁定利润。 全面自定义 – 调整仪表盘位置、颜色、字体及参数。 专为黄金优化 – 适用于 M1至M15 黄金剥头皮 ,也适合外汇、指数与加密货币。 为什么选择 Gold Entry Sniper? 为追求 快速、精准、可视化交易决策 的交易者打造,ATR 与多周期确认结合,帮助你抓住 最佳黄金入场点
RelicusRoad Pro MT5
Relicus LLC
5 (24)
RelicusRoad Pro: 量化市场操作系统 终身访问限时 70% 折扣 - 加入 2,000+ 交易员社区 为什么大多数交易者即使拥有“完美”指标也会失败? 因为他们在真空中交易 单一概念 。没有背景的信号是赌博。要持续获胜,您需要 共振 (CONFLUENCE) 。 RelicusRoad Pro 不是一个简单的箭头指标。它是一个完整的 量化市场生态系统 。它描绘价格运行的“公允价值之路”,区分市场噪音和真实的结构性突破。 停止猜测。开始用机构级“路”逻辑进行交易。 核心引擎:“Road” (路) 算法 系统的核心是 Road Algo ,一个实时适应市场条件的动态波动率通道。它投射出 安全线 (平衡) 和价格可能反转的 扩展水平 。 Simple Road: 典型市场的标准结构映射。 Smooth Road: 针对震荡盘整的降噪计算。 Breakout Road: 专为识别波动率扩张和爆发性走势而调整。 1. 算法动量与确认 我们的“剥头皮箭头”不只是简单的交叉。它们利用 高阶多项式逻辑 过滤噪音,确保信号与主周期一致。我们检测动量、价格行为和 Road 结构汇聚的精确入场
Quantum TrendPulse
Bogdan Ion Puscasu
5 (20)
介绍 Quantum TrendPulse   ,这是一款终极交易工具,它将 SuperTrend   、   RSI 和 Stochastic 的强大功能整合到一个综合指标中,以最大限度地发挥您的交易潜力。该指标专为追求精准和效率的交易者而设计,可帮助您自信地识别市场趋势、动量变化以及最佳进入和退出点。 主要特点: 超级趋势整合: 轻松跟随当前的市场趋势并乘上盈利浪潮。 RSI 精度: 检测超买和超卖水平,非常适合把握市场逆转时机,可用作 SuperTrend 的过滤器 随机精度: 利用随机振荡在波动的市场中寻找隐藏的机会, 用作超级趋势的过滤器 多时间范围分析: 从 M5 到 H1 或 H4,在不同时间范围内关注市场动态。 可定制的警报: 当您的自定义交易条件得到满足时收到通知,这样您就不会错过任何交易。 无论您是新手还是经验丰富的交易员,   Quantum TrendPulse 都能为您提供所需的优势,帮助您增强策略并自信地进行交易。借助这一强大的指标,将洞察力转化为利润 — 掌控您的交易! ***购买 Quantum TrendPulse,即可免费获得 Quantum Tr
Super Signal – Skyblade Edition 專業級無重繪 / 無延遲趨勢信號系統,擁有卓越勝率 | 適用於 MT4 / MT5 在較低的時間週期上效果最佳,例如 1 分鐘、5 分鐘與 15 分鐘圖表 核心特色: Super Signal – Skyblade Edition 是一套專為趨勢交易設計的智能信號系統。 其採用多重濾波邏輯,僅篩選出具有明確方向性、動能強勁且波動結構健康的走勢進場點。 本系統 不預測高點或低點 ,只有在同時滿足以下三項條件時才會觸發交易信號: 趨勢方向明確 動能持續增強 波動率結構穩定 此外,系統還結合市場流動性分析,以進一步提升信號的準確性與觸發時機。 信號特性: 所有箭頭信號皆為 100% 無重繪,無延遲 信號一旦出現即固定於圖表,不會閃爍或消失 提供圖表箭頭、資訊面板、彈出通知、聲音提示及推播訊息 支援 EA 呼叫(Buffer 輸出),可整合至自動化交易或信號跟單系統 提供預設參數模板,免調整即可使用,適合新手快速上手 所有數據皆採用「嚴格回測標準」——每筆交易訊號在觸發後的 60 根 K 線內, EURUSD 與 USDJPY
Bill Williams Advanced
Siarhei Vashchylka
5 (10)
Bill Williams Advanced is designed for automatic chart analysis using Bill Williams' "Profitunity" system. The indicator analyzes four timeframes at once. Manual (Be sure to read before purchasing) Advantages 1. Analyzes the chart using Bill Williams' "Profitunity" system. Signals are displayed in a table in the corner of the screen and on the price chart. 2. Finds all known AO and AC signals, as well as zone signals. Equipped with a trend filter based on the Alligator. 3. Finds "Divergence Bar
TPSproTREND PrO MT5
Roman Podpora
4.74 (19)
TPSproTrend PRO 能够识别市场真正改变方向的时刻,并在行情开始时形成入场点。 你应该在价格刚刚开始波动时入场,而不是在波动已经发生之后。 指标   它不会重新绘制信号,并自动显示入场点、止损点和止盈点,使交易清晰、直观、有条理。 俄语说明 -   MT4 版本 主要优势 信号不重绘。 所有信号均为固定值。 如果出现箭头 -     它不会再改变也不会消失了。 您可以基于稳定的数据做出交易决策,而无需承担虚假信号的风险。 现成的买卖入场点 该指标会自动确定最佳交易时机,并在图表上用箭头显示出来。 无需猜测或主观分析——只有清晰的信号。 自动止损和止盈区域 信号发出后,您立即会看到: 入口点 风险限制区(止损) 止盈区 这允许   在达成交易前评估交易条款   并遵守风险管理规定。 自适应止损(移动止损) 该指标采用智能交易支持逻辑,随着时间的推移……     降低止损规模,从而降低初始风险。 支持更高时间框架(MTF) TPSproTrend PRO 显示: 来自更高时间框架的关键 MIN/MAX 修正 实际趋势变化 修正编号显示了运动的结构 交易很有帮助   顺应大
支撑和阻力筛选器是 MetaTrader 的一个级别指标,它在一个指标内提供多种工具。 可用的工具有: 1. 市场结构筛选器。 2. 看涨回调区。 3. 看跌回调区。 4.每日枢轴点 5.每周枢轴点 6. 每月枢轴点 7. 基于谐波形态和成交量的强大支撑和阻力。 8. 银行级区域。 限时优惠:HV 支撑和阻力指示器仅售 50 美元且终生可用。 (原价 125$) 通过访问我们的 MQL5 博客,您可以找到我们所有带有分析示例的高级指标: 单击此处 主要特点 基于谐波和音量算法的强大支撑和阻力区域。 基于谐波和成交量算法的看涨和看跌回调区域。 市场结构筛选器 每日、每周和每月的枢轴点。 文档 所有支持和阻力筛选器文档(说明)和策略详细信息均可在我们 MQL5 博客的这篇文章中找到: 单击此处。 接触 如果您有任何问题或需要帮助,请通过私信联系我。 作者 SAYADI ACHREF,金融科技软件工程师,Finansya 创始人。
IX Power MT5
Daniel Stein
4.92 (12)
IX Power:解锁指数、大宗商品、加密货币和外汇市场洞察 概述 IX Power 是一款多功能工具,可分析指数、大宗商品、加密货币和外汇市场的强弱表现。 FX Power 提供针对货币对的最高精度,利用所有可用货币对数据进行分析,而 IX Power 专注于基础资产的市场数据。这使得 IX Power 成为非外汇市场的理想选择,同时在需要简单外汇分析时也非常可靠。它可以无缝适用于任何图表,提供清晰的、有行动价值的洞察,帮助提升您的交易决策。 1. 为什么 IX Power 对交易者非常有价值 多市场强弱分析 • IX Power 分析指数、大宗商品、加密货币和外汇市场的强弱表现,为每个市场提供量身定制的洞察。 • 监控 US30、WTI、黄金、比特币等资产的表现,发现交易机会。 适用于更广泛的市场 • 对于外汇交易, FX Power 提供无与伦比的精度,通过分析所有相关货币对。 • IX Power 专注于基础资产的市场数据,非常适合非外汇市场及简化的外汇分析。 实时适应性 • 借助自适应算法, IX Power 实时响应市场数据变化,保持分析的最新性。 • 实时更新
FX Levels MT5
Daniel Stein
5 (13)
FX Levels:适用于所有市场的高精度支撑与阻力 快速概览 想要精准确定适用于任何市场(外汇、指数、股票或大宗商品)的支撑与阻力吗? FX Levels 将传统的“Lighthouse”方法与前沿的动态分析相结合,实现近乎通用的准确性。依托真实经纪商经验和自动化的每日与实时更新, FX Levels 帮助您捕捉价格反转点、设置合理的盈利目标,并自信地管理交易。立即使用,体验更准确的支撑/阻力分析如何助力您的交易更上层楼! 1. 为什么 FX Levels 对交易者非常有利 极度精准的支撑 & 阻力区 • FX Levels 专为不同经纪商提供的行情源和时间设置而设计,可生成几乎相同的价位区,解决数据不一致的常见问题。 • 这意味着无论您在哪里交易,都能获得稳定一致的水平线,为策略打下更加牢固的基础。 结合传统与先进技术 • 通过将久经考验的“Lighthouse”方法与动态分析相融合, FX Levels 不仅限于每日刷新,还可针对新的价格波动进行即时更新。 • 您可以选择经典的静态方式,或实时捕捉新出现的水平,以贴近最新的市场行为。 识别清晰的反转点 • FX Lev
趋势线专业版 -     有助于了解市场真正转变的方向。该指标显示了真正的趋势反转点以及主要参与者重新入场的点位。 你看     BOS线路   无需复杂设置或不必要的干扰,即可在高时间框架内显示趋势变化和关键水平。信号不会重绘,并在K线收盘后仍保留在图表上。 MT4 版本 该指标显示的内容: 真正的转变   趋势线(BOS线) 一旦信号出现,它就始终有效!这与会重绘的指标有着重要的区别,后者可能会发出信号后又改变信号,从而导致资金损失。现在,您可以更精准、更准确地进入市场。此外,还有一个功能:在箭头出现后,K线会着色,直到达到目标价位(止盈)或出现反转信号为止。 重复条目   以及主要玩家的充值 为了提高寻找入场点时的视觉清晰度,我们创建了一个模块,该模块首先显示买入/卖出区域,并在该区域内寻找最佳入场点。此外,我们还加入了智能逻辑来管理止损位,该逻辑会随着时间的推移逐步降低止损位的大小,从而降低入场时的初始风险( 移动止损位 )。 信号强度水平     (BOS) 该指标采用三个显著性等级来衡量趋势变化: SL     标准趋势变化 ChoCH SL—— 信号放大,结构破坏,且
Basic Harmonic Patterns Dashboard MT5
Mehran Sepah Mansoor
4.36 (11)
该仪表盘显示所选符号的最新可用谐波形态,因此您可以节省时间并提高效率 /  MT4 版本 。 免费指标:  Basic Harmonic Pattern 指标列 Symbol:   显示所选符号 Trend:     看涨或看跌 Pattern:    形态类型(Gartley、蝴蝶、蝙蝠、螃蟹、鲨鱼、Cypher 或 ABCD) Entry:     入口价格 SL: 止损价 TP1: 第一止盈价 TP2: 第二次获利价格 TP3: 第三次获利价格 Current price:    当前价格 Age (in bars):   最后绘制的模式的年龄 主要输入 Symbols :   从 "28 种主要货币对 "或 "选定符号 "中选择。 Selected Symbols :   希望监控的符号,用逗号分隔("EURUSD,GBPUSD,XAUUSD")。如果您的经纪商为货币对设置了后缀或前缀,您必须在以下两个参数中添加(货币对前缀或货币对后缀)。 Max Iteration:   调整模式的最大迭代次数(如果该值越小,则模式越少,性能越快;如果该值越大,则模式越多,性能越慢)
Weis Wave with Alert MT5
Trade The Volume Waves Single Member P.C.
4.94 (17)
Rental/Lifetime Package Options and Privileges  Rent Monthly Six Months   Yearly/Lifetime Weis Wave with Speed with Alert+Speed Index x x x Manual  x x x Quick Set up Video x x x Blog x x x Lifetime Updates x x x Setup and Training Material x x Discord Access Channel "The SI traders"          x Rectangle Break Alert Tool      x How to trade with it:    http://www.tradethevolumewaves.com   ** If you purchase please contact me to setup your  : Training Room and  complete manual access.  Wei
作者的更多信息
Forex Master Pattern MT4
Alberto Gauer Borrego
4.75 (20)
The Forex Master Pattern  is an alternative form of technical analysis that provides a framework which will help you to find and follow the hidden price pattern that reveals the true intentions of financial markets. This algorithm here does a good job detecting the Phase 1 of the Forex Master Pattern cycle, which is the contraction point (or Value).  On Phase 2 we get higher timeframe activation (also called Expansion), which is where price oscillates above and below the average price defined
Tick and Range Bars Generator
Alberto Gauer Borrego
5 (1)
This utility here gives you a lot of bang for your buck by being a 2 in 1 custom candles generator. For the price of 1 utility, you get 2 !! It creates offline charts that will behave like a live chart. It has 2 modes of operation: Tick and Range These are not time based charts. They will enhance your analysis giving you an edge by filtering a lot of useless and confusing price noise, leaving behind the most important price levels/market structure. When set to "Tick" mode, it will generate
ICT Power of 3
Alberto Gauer Borrego
One of the most powerful and important ICT concepts is the Power of 3. It explains the IPDA (Interbank Price Delivery Algorithm) phases. PO3 simply means there are 3 things that the market maker's algorithm do with price: Accumulation, Manipulation and Distribution ICT tells us how its important to identify the weekly candle expansion and then try to enter above or below the daily open, in the direction of the weekly expansion. This handy indicator here helps you keep track of the weekly and
Relative Volume RVOL
Alberto Gauer Borrego
4.67 (3)
Relative Volume or RVOL   is an indicator that averages the volume of X amount of days, making it easy to compare sessions volumes. The histogram only has 3 colors: Green - Above average volume Yellow - Average volume Red - Below average volume The default setting is 20 days, which corresponds more or less to a month of trading. In this version is possible to choose between tick and real volumes (if you are using a broker which offers future contracts) With the data obtained from this in
FREE
Forex Master Pattern
Alberto Gauer Borrego
4.92 (12)
The Forex Master Pattern  is an alternative form of technical analysis that provides a framework which will help you to find and follow the hidden price pattern that reveals the true intentions of financial markets. This algorithm here does a good job detecting the Phase 1 of the Forex Master Pattern cycle, which is the contraction point (or Value).  On Phase 2 we get higher timeframe activation (also called Expansion), which is where price oscillates above and below the average price defined
This utility solves the problem of Metatrader not having the capacity to create custom session times, all markets are displayed forcefully in a 24h format. Lots of traders prefer to ignore the overnight action and focus only on NY session and use the overnight gaps as part of their trading strategy. ICT teaches this as "opening range gap", it's the gap between NY session end (16:15) and NY session start (09:30). The default setting in this utility reflects the RTH (Regular Trading Hours) opti
ICT Power of 3 MT5
Alberto Gauer Borrego
5 (1)
One of the most powerful and important ICT concepts is the Power of 3. It explains the IPDA (Interbank Price Delivery Algorithm) phases. PO3 simply means there are 3 things that the market maker's algorithm do with price: Accumulation, Manipulation and Distribution ICT tells us how its important to identify the weekly candle expansion and then try to enter above or below the daily open, in the direction of the weekly expansion. This handy indicator here helps you keep track of the weekly and
Relative Volume MT4
Alberto Gauer Borrego
4 (1)
Relative Volume or RVOL is an indicator that averages the volume of X amount of days, making it easy to compare sessions volumes. The histogram only has 3 colors: Green - Above average volume Yellow - Average volume Red - Below average volume The default setting is 20 days, which corresponds more or less to a month of trading. With the data obtained from this indicator you can better gauge the commitment behind a move. For example, you will be better equipped to judge if a breakout of a r
FREE
Crosshair Local Time
Alberto Gauer Borrego
If you ever wanted to know your local time (or NY time) at any bar on the chart without needing to waste time with mental calculations, look no further. This indicator creates a crosshair which you can drag anywhere on the chart and will show you the local time in a label on top of the time axis. Press the "c" key to show/hide the crosshair. Left click it to pick it up and drag anywhere, left click again let it go. You can't hide the crosshair without letting it go first. Time setting inputs
If you want a reliable seconds chart that works properly, look no further. This utility here uses tick data to create a precise seconds chart. You just need to load it on a M1 chart and choose how many seconds you want the chart to be. The utility creates an offline chart that gets updated on every tick so it behaves as if it were a live chart. It receives tick data so you can load custom indicators on it.  It's not possible to trade from the seconds chart. The screenshots below show a 30 se
筛选:
Smart42dj
150
Smart42dj 2025.07.01 23:58 
 

This indicator, as described, does use heavy resources. I turned off many of the options and it still uses High resources. Can you edit it, so it only uses the features "TRUE" Or can you make one that is only Stochastic RSI? That single indicator alone is all you need.

Irusel
704
Irusel 2024.10.29 21:08 
 

Отличный индикатор

Rafal Krzysztof Manuszewski
2387
Rafal Krzysztof Manuszewski 2024.10.06 19:57 
 

super

Van Khiet Tran
142
Van Khiet Tran 2024.03.07 04:31 
 

Excellent!

BlackArmor
438
BlackArmor 2023.10.05 01:03 
 

Thank you. Good indicator, works in conjunction with your system. Need some practice also watch the video.

回复评论