 MetaTrader 5
 专家
专家
 指标
指标
 程序库
程序库
 实用工具
实用工具
 窗口小部件
窗口小部件
 规则
规则
适用于MetaTrader 5的免费技术指标 - 36
 技术指标的信号外汇和股票市场的开仓交易和平仓交易起着至关重要的作用。指标的本质就是一种交易品种的数学转换,旨在预测未来的价格变化。
测试技术指标可以更有利于预测市场行为并从中获利。
技术指标的信号外汇和股票市场的开仓交易和平仓交易起着至关重要的作用。指标的本质就是一种交易品种的数学转换,旨在预测未来的价格变化。
测试技术指标可以更有利于预测市场行为并从中获利。 
============== -- If you are a fan of FIBONACCI... then this is defenitely a tool for you
-- Please master the optimal trade entry concept and you will become profitable
-- Show me you comment about this tool and I will give you more tools: Tradelist Panel, Watermark, Reversal tool, ... ============== Hallo Trader, This is fibonacci system based on the previous day levels (low and high) and the current day levels.
You can choose your favorite in settings. I use the Previous Day Fibo and use the
FREE
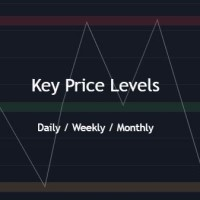
Key Price Levels Indicator Indicator that shows the highs and lows for the significant price levels for past periods that could be potentially considered as reaction levels. The indicator displays the following price levels: Yesterday high and low The day before yesterday high and low Two days back high and low Last week high and low Last month high and low Last three month high and low (Quarter) Last year high and low
FREE

Plus Channel RSI — 适用于 MetaTrader 5 的带动态通道 RSI Plus Channel RSI 将相对强弱指数(RSI)与根据 RSI 自身近期行为计算出的动态通道相结合。 除了 RSI 主线之外,该指标还显示上限、下限和中心线。通道会跟随指标的波动变化,为分析动量、强弱、可能的极值以及市场行为变化提供自适应的视觉参考。 与固定的水平线不同,该通道会根据 RSI 的近期历史以及不同资产和图表周期中的市场条件进行调整。 显示元素: RSI 主线; 动态上限; 通道中心线; 动态下限。 可用参数: period_RSI: RSI 的计算周期; Applicated_RSI: 用于计算的应用价格; period_channel: 通道形成所使用的周期; canal_centro_RSI: 控制通道中心的偏移; canal_escape_RSI: 控制极端区域中的自适应; canal_largura_RSI: 调整通道宽度; canal_largura_min: 设置最小通道宽度; canal_largura_max: 设置最大通道宽度。 主要特点: 基于 RS
FREE

Investment Castle Spots — Candlestick Patterns, Spotted for You
The Spots Indicator watches for the candlestick patterns traders rely on — engulfing, hanging man, doji and more — and marks them on your chart for cleaner entries and exits.
What it does for you Key patterns detected: engulfing, hanging man, doji and other classic candlestick signals. Entry & exit help: use the patterns to time your trades with more confidence. On-chart and clear: no manual pattern-hunting candle by candle. Works
FREE
ZIGZAG and FRACTAL CANDLE PRO ( Only candles, No RSI strength panel) " Suitable for QQE RITZ " > Check My Product is an advanced market structure visualization system built for precision trend detection, powered by dynamic fractal logic and adaptive swing validation.
It seamlessly identifies Higher Highs (HH), Lower Lows (LL), and key structural shifts — allowing traders to read the true rhythm of market transitions with institutional clarity. This system combines ZigZag precision , fractal
FREE

Fractals Alligator Filter is an indicator for MetaTrader 5 that detects fractals and filters them according to their position relative to the Alligator lines. There is also the HotkeyFractalsEA utility designed to simplify trading.
The indicator automatically separates fractals into valid and invalid fractals: valid fractals are displayed with colored arrows; invalid fractals can be displayed separately or hidden in the settings. Two filtering modes are available: filtering relative to the Tee
FREE

賬戶儀表板統計
它是一個工具,可以幫助您有一個集中的觀點,以便了解您賬戶的利潤和損失,這樣您就可以跟踪它,它還帶來了回撤分析,以了解所獲得的風險 下載並在您的帳戶中激活後,您必須將其附加到任何交易品種,例如 EURUSD H1,然後從這一刻起,該工具將開始監控您的統計數據
該面板是完全高級的,您可以將其隱藏並移動到您喜歡的位置 根據您的帳戶操作,主要特徵如下 每日一段時間(每日盈虧逐日更新) weekly時間段(weekly gain and loss renew weekly) 每月一段時間(每月盈虧每月更新) 每年一段時間(每年更新的年度損益) 最大回撤(控制每秒監控根據您的餘額達到的最大風險) 例如,如果您的餘額為 1000 美元,提款標記為 10%,則表示您的賬戶在某個時刻達到了 100 美元的總風險
FREE
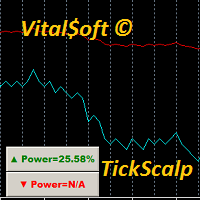
Free version of the TickScalper indicator. The Tick Scalp indicator is a trading assistant for a scalping trader. Works in a separate window. Tracks the momentary activity of the market, shows the graph of the movement of ticks and the strength of bulls or bears. Sometimes it can anticipate the beginning of a strong movement before any other indicators. Helps the trader to make a decision to open the desired order. Designed to work on any instrument. Used timeframes from M1 to M15. Has simple a
FREE

由于无法确切知道当前K线何时收盘,很容易错过预定的操作(移动止损、执行预定入场、在收盘时检查交易机会),尤其是在几秒钟都至关重要的较低时间周期上。
Phoenix Candle Timer Panel 会实时显示距离下一根K线收盘的秒级倒计时,并同时显示当前交易品种和时间周期,因此您始终能准确掌握当前K线剩余的时间。
如何提升您的时机把握能力
- 实时倒计时至下一根K线收盘,每秒更新一次
- 两种颜色模式:K线方向(看涨/看跌)或时间紧迫度(随着收盘临近,依次显示安全/警告/紧急)
- 可选12小时制时间格式
- 可配置在收盘前设定秒数时触发提醒,通过弹窗、声音或推送通知发送
自定义设置
面板位置(自动居中或手动调整 X/Y 坐标)、各紧急程度阶段的颜色阈值,以及用于即时隐藏或显示面板的热键。
使用 Phoenix K线计时器面板可:
- 精准把握 K线收盘时的入场、出场或止损调整时机
- 在低时间周期 K线快速收盘前获得早期预警
- 无需将视线从价格上移开,即可随时掌握距收盘剩余时间
使用方法
1. 将其附加到任何图表上,
FREE

Forex Position Size Calculator - a free lot size calculator for every forex trader. Enter your account balance, risk percentage, entry price and stop-loss, and the calculator instantly gives you the exact lot size for the pair you are trading. Risking a fixed lot on EURUSD, GBPUSD, USDJPY or any other pair means each trade actually risks a different amount of money. This calculator works it out the professional way: it measures the distance to your stop and converts it into a position size that
FREE
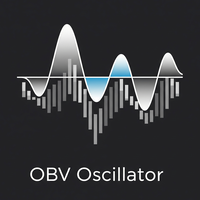
Overview The OBV Oscillator is a custom technical indicator for MetaTrader 5, designed to provide a clearer visualization of On Balance Volume (OBV) by transforming it into an oscillator. This indicator aims to assist traders in identifying trend confirmations, potential reversals, and momentum shifts by analyzing the relationship between price and volume. It features a customizable Moving Average (MA) for smoothing the OBV, a signal line for generating crossover signals, and an alert system to
FREE

The FVG Toolkit is a lightweight Smart Money Concepts (SMC) indicator that automatically identifies and draws Fair Value Gaps (FVG) on your chart . It scans for the classic 3-candle imbalance patterns (BISI & SIBI) to highlight high-probability liquidity zones for your entries . Key Features Dynamic Zones: The FVG boxes extend to the right and automatically freeze when the gap is fully filled by the price . Auto-Cleanup: Option to automatically delete boxes once they are fully mitigated to keep
FREE

开盘区间检测 – 根据可配置的时间段检测开盘区间
突破信号 – 在突破开盘区间时显示信号
目标位 – 根据区间宽度的百分比计算并显示目标位
日内偏向 – 考虑每日趋势以筛选信号
移动平均线 – 可选显示的移动均线 MQL5 的重要调整 :
可视化 : 绘制 ORH、ORL 和 ORM(开盘高/低/中间)线条 用图形对象表示目标位、信号和开盘区间框 根据日内方向进行颜色编码 参数 : 所有关键设置均可作为输入参数配置 开盘区间的时间设置灵活 可自定义颜色和样式 功能性 : 会话管理控制开盘时间段 根据可配置百分比计算目标位 带偏向选项的信号逻辑 可选显示历史数据 特色 : 图表对象管理,保持界面整洁 内存高效实现 针对不同时区的稳定时间处理
各市场的精准时间计算
无需修改代码即可灵活配置
全球交易时段兼容性强
使用简单,整型参数操作 该指标现在根据设置的时区计算所有时间相关功能(开盘区间、自定义区间、会话检测),可广泛适用于全球不同市场。
FREE

MFI Divergence is a technical indicator that detects regular bullish and bearish divergences between price and the Money Flow Index (MFI) at swing highs and lows. It highlights potential reversal points by drawing clean green (bullish) and red (bearish) arrows directly on the chart. The indicator uses configurable swing detection, customizable MFI period, and an optional MFI threshold filter to show signals only in oversold/overbought zones. Alerts are triggered only once per bar on candle close
FREE

Short description Plots a repeating grid of round-dollar levels on ETHUSD — labeled Wall / Hot Zone / Exit / Trap by their typical institutional role — tuned for lower timeframes (M1 through H1). Full description Draws horizontal reference lines at 10 intervals around the current ETHUSD price, based on the idea that round-dollar levels (multiples of $100, and near-round levels like $X20/ X80, $X50, $X10/$X90) tend to act as psychological reaction zones where liquidity and stop-hunts commonly clu
FREE

Trading Exporter for AI Assistant Trading Exporter for AI Assistant 是一款专为 MetaTrader 5 设计的专业指标,旨在以 JSON 格式 导出完整且结构化的交易数据 。其目的是让任何人工智能助手(无论是免费的还是付费的,如 ChatGPT、Gemini、Copilot、Claude 或 DeepSeek)都能分析这些信息,并提供个性化的建议、策略和解释。 特别推荐:DeepSeek 尽管此导出器兼容任何人工智能,但 特别推荐使用 DeepSeek ,原因如下: 扩展上下文能力 :非常适合处理指标导出的海量数据。 原生多语言支持 :与内含的 7 种语言完美兼容。 高级技术分析 :在解释技术模式和指标方面具有卓越能力。 高效的 JSON 处理 :专为处理复杂数据结构而优化。 导出哪些信息? 该指标会自动收集和整理以下数据: 历史价格和交易量数据 ,涵盖多个时间周期(M5、M15、M30、H1、H4、D1)。 原生技术指标 :MACD、RSI、ATR、Stochastic、ADX、布林带、DeMarker、MFI、A
FREE

Daily Time Lines Indicator for MT5 Daily Time Lines is a simple and powerful chart tool for MetaTrader 5 that automatically draws vertical and horizontal lines at a specific time each day. Perfect for marking session opens, key levels, or important trading moments directly on your chart. Main Features Automatic daily vertical line at a selected time Optional horizontal line starting from the same point Horizontal line can end: At the end of the day Or extend for a customizable number of future d
FREE

Index Trend Monitor 是一款用于 MetaTrader 5 的指标,用于衡量指数 CFD 以及其他活跃市场的方向强度。 核心思路: 该指标结合 EMA 结构、ATR 标准化波动、动量与持续性逻辑,生成清晰的趋势评分, 并提供一个隐藏的市场状态缓冲区,方便 Expert Advisor 和自定义工具读取。 快速概览 产品类型 MetaTrader 5 指标 主要用途 方向强度、趋势评分与市场状态分类 视觉输出 多空柱状图与趋势评分逻辑 EA 集成 支持,通过可见和隐藏缓冲区 外部 DLL 不需要 主要功能 趋势强度范围从 -100 到 +100 。 提供多头和空头柱状图显示。 计算逻辑基于 EMA 方向、ATR 标准化、动量和持续性。 可选参考周期,用于更高层级背景分析。 可选仅按收盘 K 线计算。 可配置最大计算 bar 数量。 清晰区分强势、弱势和中性区域。 提供适合 EA 使用的缓冲区,包括隐藏的 Regime Code 。 开发者缓冲区 Trend Score: 主要方向强度值。 Bull Strength: 正值柱状图。 Bear Strength: 负值柱
FREE
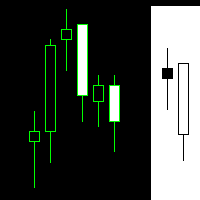
The Martinware Manual Trading Helper indicator is aimed at helping people start their lives in manual trading. It can be used to display both some generic images at the right side of the graph, where custom operational remarks may be displayed or just a blank rectangle hiding the chart while backtesting. Moreover, it can periodically play a list of sounds. To show a blank rectangle, let the first image name input field empty and select the desired color. To show one or more custom images inste
FREE

Divergence Hunter - Professional Multi-Oscillator Divergence Detection System Overview Divergence Hunter is a professional-grade technical indicator designed to automatically detect and visualize price-oscillator divergences across multiple timeframes. Built for serious traders who understand the power of divergence trading, this indicator combines precision detection algorithms with an intuitive visual interface. Key Features Multiple Oscillator Support: RSI (Relative Strength Index) MACD (Mo
FREE

KS 双 EMA RSI 信号指标
结合 RSI 确认与 ATR 风险管理的双周期 EMA 策略
专为超短线(Scalping)、日内交易及波段交易设计,旨在帮助交易者捕捉趋势延续行情,同时规避震荡盘整的市场环境。
核心功能
进阶的风险与回报管理
基于 ATR 的止损设置(支持自定义倍数,默认为 1.5 倍 ATR)
三档止盈水平(1R、2R、3R)
灵活多样的止盈离场模式
可视化界面与仪表盘
简洁明了的双周期 EMA 显示
实时 ATR 仪表盘,显示以下关键信息:
趋势状态(周期 1 / TF1)
EMA 交叉状态(周期 2 / TF2)
RSI 数值及阈值状态
信号就绪状态
信号冷却倒计时
上一组信号的关键价位(入场点、止损点、止盈点 TP1–TP3)
动态水平线段,用于标记止损与止盈位;当价格触及相应水平时,线段会自动延伸或截断。
图表上直接显示所有 EMA 均线的数值标签。
实用功能
代码整洁且经过高度优化,无任何冗余对象。
FREE

简介 这是一款结合了经典震荡指标 Williams %R 与 Bollinger Bands (布林带) 的复合型技术指标。它不同于传统直接基于价格的布林带,而是通过对 Williams %R 进行平滑处理后再进行标准差计算。 这种创新的组合能够有效捕捉动量爆发的瞬间,并利用布林带的动态特性来过滤普通震荡信号。当平滑后的 WPR 突破布林带上下轨时,通常预示着一个强力波段行情的开启。
核心功能与优势 双重过滤机制: 指标首先对原始 Williams %R 进行平滑处理(参数可调),有效减少了传统 WPR 常见的锯齿状噪点。 动态动量阈值: 与固定在 -20/-80 的静态超买超卖线不同,本指标引入了布林带作为动态边界,能够根据市场近期波动率自动调整信号触发点。
直观的视觉信号: 颜色变换: 指标线会根据其与布林带的位置关系自动变换颜色(突破上轨为绿,跌破下轨为红,震荡为灰)。 箭头提示: 当发生“穿透性”突破时,系统会在副图自动标注 L (Long) 或 S (Short) 信号。 高度可定制化: 用户可以自由调整 WPR 周期、平滑周期以及布林带的标准差倍数,以适应从 sc
FREE

价格行为辅助指标套件4-4 ATR/ATR%数值指标 这是一套个人常年交易在使用的价格行为辅助指标,已涵盖了价格行为交易的基本需求。任何标的都可以载入使用。 纯价格行为手工交易的福音,提供多项辅助。非价格行为交易者请谨慎购买,该套指标无任何买卖信号,纯辅助。 该套指标包含4个组件,由于平台的原因只能拆分开,购买的朋友请看清介绍,按需购买。 4-1、4-2为收费指标,4-3、4-4为免费指标。 全套指标包含以下四个内容—— 4-1 缺口自动标记,包括跳空缺口和影线缺口的自动标记,实体缺口由于MT5不支持透明度着色的原因已去除,以保持图表整洁。含实体缺口的版本仅在TV版提供(TV版指标为单指标所有辅助功能齐全的版本,还有许多MT5版本没有的工具) 4-2 H/L自动标记,仅在影线部分对H/L的情况做提醒,不进行数H1/H2的标记,以保持图表的整洁和可读性。 4-3 枢轴点PivotPoints指标,只显示当天的枢轴点情况,为日内止盈止损提供参考。 4-4 ATR/ATR%数值,提供5M/30M/1D/1Y的ATR数值,可以直观的反应标的的波动情况。
FREE

Session Clock is a small, free indicator that answers one question at a glance: what trading session is active right now, and how long until it changes?
The panel shows: - The current session (Asian, London, London/NY Overlap, New York, or Sydney/Late), color-coded - A live countdown to the next session change - What the next session will be
Optionally, it also draws labeled vertical lines directly on your chart at each session boundary - so you can see exactly where the Asian session ended a
FREE

Volatility Dragon Align Alert is a multi-timeframe SuperTrend indicator.
It shows H1, H4 and D1 SuperTrend on one panel.
ALIGNED = all three timeframes match.
MISALIGNED = they do not match.
When aligned it draws:
- StopLoss line (H1 ATR)
- TakeProfit line (H1 ATR)
Alerts:
- Aligned
- Misaligned
- H1 flip
- Price testing the stop line
- StopLoss hit
- TakeProfit hit
The panel also shows floating profit of open positions on the same symbol.
Designed for Deriv Volatility indices (V10, V25, V2
FREE

MTF Trend Dashboard Pro for MT5 MTF Trend Dashboard Pro adalah indikator Multi Timeframe (MTF) profesional untuk MetaTrader 5 yang membantu trader mengetahui arah trend pada berbagai timeframe secara bersamaan dalam satu panel yang ringan, cepat, dan mudah dibaca. Indikator ini menampilkan status Bullish atau Bearish secara real-time mulai dari M1, M5, M15, M30, H1, H4, D1, W1 hingga MN , sehingga trader dapat dengan mudah melakukan analisis top-down sebelum mengambil keputusan entry. Fitur Utam
FREE

MA Cross Histogram Oscillator (MT5) The MA Cross Histogram Oscillator is a custom indicator designed to visualize the relationship between two moving averages in the form of a color-coded histogram. Instead of drawing standard MA lines on the chart, it highlights the strength and direction of the trend by comparing the difference between a fast and a slow moving average. Green bars – bullish momentum (fast MA is above slow MA and rising). Red bars – bearish momentum (fast MA is below slow MA and
FREE

The Stochastic Oscillator is one of the main indicators used in the analysis of financial assets. It is one of the highlights in the study of price movements and can be an important indicator of changing trends in the capital market. Stochastic is an oscillator used to identify when an asset is overbought or oversold. It consists of two lines: %K, which is calculated from the highs and lows of a period, and %D, which is a moving average of %K. Our version contains color filling, which facilitate
FREE

Weis Waves(魏斯波浪) 是由大卫·魏斯 (David Weis) 开发的技术指标,灵感来源于理查德·威科夫 (Richard Wyckoff) 的原理。
与传统逐根显示的成交量不同,Weis Waves 将成交量累积为连续的上涨或下跌“波浪”,当价格方向反转时重新开始计算。 这种方法使交易者能够清晰地看到市场运动的 真实力度 ,因为每一波浪都反映了支撑一系列K线的成交量强度。 主要特点: 将成交量分组为买入波浪和卖出波浪。 突出显示市场的主导力量(买方或卖方)。 有助于识别 趋势延续 或 潜在反转 。 基于威科夫方法论,被广泛应用于成交量与资金流分析。 Weis Waves 被众多专业交易者使用,用于分析价格与成交量之间的平衡,提供更深入的市场动态视角。
FREE

ROMAN5 时间突破指标自动绘制日线的支撑和阻力突破箱体。它可帮助用户识别何处进行买入、卖出。当新信号出现时,它可发出提示和声音。它还具有发送邮件功能。您的邮件地址和 SMTP 服务器设置应该在 MetaTrader 5 的 "邮箱" 标栏里的设置窗口里指定。 蓝色向上箭头 = 买。 红色向下箭头 = 卖。 您可以使用一款我的移动止损产品,来自动移动止损,并包括设置盈亏平衡。 ROMAN5 分型移动止损 ROMAN5 抛物线SAR 移动止损 ROMAN5 布林带移动止损 ROMAN5 HeikenAshi 移动止损 ROMAN5 均线移动止损 ROMAN5 高级移动止损 如果您希望尝试 EA, 参见 ROMAN5 时间突破 EA 。 版本 1.2: 发送推送通知至移动终端。
FREE
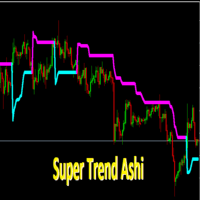
SuperTrendAshi Description SuperTrendAshi is an advanced and optimized version of the SuperTrend indicator that incorporates Heikin Ashi calculation to provide smoother and more reliable signals. This unique combination results in an indicator that reduces false signals and identifies trends with greater precision. Key Features Combines the strength of SuperTrend with Heikin Ashi smoothing More stable signals with less noise Intuitive color system (Aqua for uptrend, Magenta for downtrend) Custo
FREE

Stop guessing your lot size. Risk the same amount on every trade. Most traders blow accounts not because of bad entries, but because of inconsistent position sizing: fixed lots with variable stops means every trade risks a different — and unknown — amount of money. TrendSync Risk Calculator solves this in one drag. How it works Attach the indicator. It automatically anchors three draggable lines at the current price: Entry , SL at N×ATR and TP at your chosen R:R . Drag any line — or type a new A
FREE

Major Market Structure is a technical analysis indicator for MetaTrader 5 designed to display confirmed market structure directly on the chart. The indicator focuses on significant swing points instead of marking every minor price fluctuation. It helps traders observe the relationship between major highs, major lows, structural breaks and potential reaction zones across different market conditions. Main features Displays confirmed Major High and Major Low points Identifies bullish and bearish Br
FREE

Shaolin Trend Follow v2.1
针对 MetaTrader 5 上的欧元/美元 (EURUSD) 进行了优化 这是一个轻量级、纯信号型指标,采用严格的“从上而下”工作流程:先在 H4 上确认主要波动方向,然后在 M15 上等待经过波动性调整的入场信号。无自动下单或资金管理——仅在条件满足时清晰地标记 /,由您自行决定执行时机。 H4 趋势确认 Parabolic SAR + ADX 过滤器,仅在确认的上升或下降趋势中才允许信号通过。 仅当 H4 出现趋势时,M15 入场信号才会生效。 波动性区间 H4 上的 ATR 将市场分为三种波动性状态:低、中、高。 根据当前状态,有选择地启用不同的入场引擎。 M15 入场引擎 当 H4 趋势和波动性状态允许时,下列任意一种条件都会在对应的 M15 K 线上绘制 (买入)或 (卖出): 振荡器回归 (例如 RSI 超买/超卖反弹) EMA 突破 (价格穿越关键指数移动平均线) 随机动量 (限于低波动状态) MACD 动量 (限于中高波动状态) CCI 动量 (限于中高波动状态) 可选成交量过滤 可要求当前 M15 K
FREE

Big bull scalper Short Description Master market structure with the precision of the popular Big bull scalper This tool automatically identifies key pivot highs and lows, plotting unique "angling" trend lines that dynamically define market context. It visually confirms Breaks of Structure (BOS) and Changes of Character (CHoCH), removing all guesswork from your analysis.
Key Features: Automatic Pivot Detection Instantly spots significant swing highs and lows. Dynamic Angling Lines Visual
FREE

Direction sets the side. Timing sets the moment. Vector speaks only when both agree.
TrendCue Vector separates market direction from entry timing.
The Context line defines the preferred side of the market. Candle colour shows the current Vector timing state. A fresh setup appears only when a new candle-colour transition agrees with Context.
Simple chart. Clear workflow. No engine parameters to optimize.
HOW IT WORKS
Context is the coloured line.
Green Context → favour long setups Red Con
FREE

Product Description Clean, Smart Sessions is a professional trading sessions indicator designed to provide traders with a clear, accurate, and clutter-free view of the active market sessions directly on the chart. The indicator dynamically detects and displays the active trading session (Asian, London, and New York) in real time, drawing a clean session box that continuously updates to reflect the session’s true high and low. When sessions overlap, each active session is handled independently
FREE

โครงสร้างตลาด ZigZag (ความลึก 30) – คําอธิบาย + การตั้งค่า อินดิเคเตอร์นี้ใช้หาโครงสร้างตลาดแบบ: HH (Higher High) = ยอดสูงขึ้น → แนวโน้มขึ้น HL (Higher Low) = ยกฐาน → แนวโน้มยังขึ้น LH (Lower High) = ยอดต่ําลง → แนวโน้มลง LL (Lower Low) = ทําโลว์ใหม่ → แนวโน้มลงชัด ใช้ร่วมกับ ZigZag เพื่อ "คัดเฉพาะสวิงใหญ่" ไม่มั่ว หลักการทำงาน ZigZag จะหา "จุดกลับตัว" ตามค่า Depth เอาจุดเหล่านั้นมาเปรียบเทียบ: สูงกว่าเดิม → HH ต่ํากว่าเดิม → LH โลว์สูงขึ้น → HL โลว์ต่ําลง → LL แสดง label + เส้นแนวนอน
FREE

ED Multi-Timeframe Market Bias Dashboard ED Multi-Timeframe Market Bias Dashboard is designed to give traders a fast and clear overview of market direction across multiple timeframes without having to continuously switch between charts. The dashboard analyzes market bias from M1, M5, M15, M30, H1, H4 and D1 , displaying each timeframe as either BULLISH or BEARISH . Market direction is determined using the relationship between the 20 EMA and 50 EMA , providing a simple and consistent method of id
FREE

Pure Trend Logic MT5 — Профессиональный алгоритм следования за трендом Pure Trend Logic MT5 — это воплощение классической торговой стратегии в современной интерактивной оболочке. Индикатор предназначен для трейдеров, которые ценят чистоту графиков и математическую точность. Система объединяет три уровня анализа цены, позволяя находить точки входа с математическим преимуществом. ### Философия индикатора: В основе лежит «золотое правило» трейдинга: торгуй по направлению основного потока. Мы взяли
FREE

CandleScope Pro Demo – Candlestick Pattern Indicator CandleScope Pro Demo is a powerful and easy-to-use indicator for MetaTrader 5 that automatically detects and labels the most popular candlestick patterns directly on your chart. This tool is designed to help traders of all levels quickly identify key reversal and continuation signals, improving decision-making and trading accuracy. Key Features: Automatic Detection: Instantly scans and highlights the following candlestick patterns: Doji Spin
FREE
This is a simple RSI indicator, but unlike the original one, it sends alerts when volume falls below the upper level or rises above the lower level, so you never miss a trading opportunity. Combined with support and resistance levels, it can provide strong entry opportunities into the market. I recommend keeping the levels as they are, i.e. 75 above and 25 below Check out my signal " PipStorm Invest ", save it to your favorites and come back from time to time to check it again :)
FREE

Ichimoku 多层趋势振荡器专业版是一种先进的 趋势解读 和 进出场 系统,它将 Ichimoku 计算转换为四个强大的振荡器层。这些图层清晰地展示了趋势强度、动量和最安全的进出场点。 该指标还包括可选的 RSI 、 MACD 、 EMA 和 ATR 确认,构成一套完整的交易决策方案。 独特的 多层振荡器结构 该系统创建了 四个基于 Ichimoku 的振荡器层 ,每一层代表价格行为的不同方面: 1️⃣ 第一层 – 价格距离云的距离: 衡量收盘价与 Ichimoku 云之间的距离 (根据主趋势方向取最小或最大值)。 有助于识别正在进行的趋势的强度。 2️⃣ 第二层 – 迟行线 vs 云: 显示 迟行线 (Chikou) 与云之间的距离, 并向后位移 了特定数量的 K 线。 确认趋势的完整性和长期结构。 3️⃣ 第三层 – 转换线 vs 基准线: 衡量 Tenkan-sen (转换线) 与 Kijun-sen (基准线) 之间的距离。 非常适用于检测动量增强和趋势加速。 4️⃣ 第四层 – 领先线距离: 领先跨度 A 与 领先跨度 B 之间的距离,代表云的厚度和未来趋势强度。
FREE
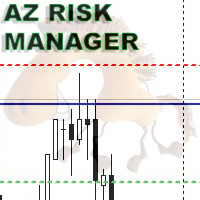
A simple indicator for calculating risk and automatically calculating the take profit line. In the settings, you enter the desired risk to profit ratio, the indicator will automatically calculate the volume for entry and show where to set the take-profit line to maintain the proportion. The risk is calculated based on your balance data. The information panel can be moved around the screen. The stop-loss line can also be moved, this will recalculate the entry volume and the take-profit position.
FREE
This indicator draws the highest and the lowest prices of the previous periods on the chart. And If you want, Indicator can alert you when the current price arrives these levels. For example: If you are watching the H1 timeframe, Indicator shows you the lowest and the highest prices of H4, D1, W1 and M1 periods. So you don't need to open the other periods of chart windows. Alert Options: Send Mobil Message, Send E-mail, Show Message, Sound Alert Time Periods: M1, M5, M15, M30, H1, H2, H3, H
FREE
SMC Donchian Keltner MTF Painter The SMC Donchian Keltner MTF Painter for MetaTrader 5 is a versatile trend indicator that colors candles according to multi-timeframe EMA bias and Keltner channel breakouts. The combination of trend and momentum logic enables fast, visual assessment of market conditions – perfect for both intraday and swing traders. Key Features: Multi-Timeframe Trend Assessment: Candle colors are based on EMA slope from two timeframes (e.g., H1/H4), instantly showing the curren
FREE

Dynamics Edge: Statistical Precision in Mean Reversion Dynamics Edge is a volatility boundary indicator designed to identify price exhaustion with high precision. Using an advanced standard deviation calculation ( $2.2 \sigma$ ), it maps the extremities where price is statistically likely to return to equilibrium (median). Key Features: Dynamic Exhaustion Edges: Solid lines that expand and contract based on volatility, identifying overbought (Blue) and oversold (Red) zones. OCR-Ready Price Tags:
FREE

Percent Change Dashboard Percent Change Dashboard 是一款专为 MetaTrader 5 平台开发的紧凑型信息指标,可实时显示交易品种在多个时间周期内的价格百分比变化。 该指标旨在帮助交易者快速了解市场动能,无需手动计算或频繁切换不同时间周期,即可清晰掌握市场走势。 ️ 主要功能 小时涨跌幅 (%) —— 显示短期市场动态
日涨跌幅 (%) —— 反映当日价格波动情况
周涨跌幅 (%) —— 帮助识别中期趋势
月涨跌幅 (%) —— 提供更全面的市场视角 优势 快速了解市场强弱及运行方向 适用于趋势跟踪和动量交易策略 自动计算涨跌幅,节省分析时间 支持外汇、指数、贵金属及加密货币等各类交易品种 界面简洁轻量,不影响图表观察 适用人群 日内交易者(剥头皮交易和短线交易) 动量交易及波动率策略交易者 进行相对强弱分析的多资产交易者 依赖价格百分比变化进行决策的交易者 如何帮助交易者 该指标能够回答一个简单却非常重要的问题: “当前价格走势在不同时间周期上究竟有多强?” 因此,它能够成为任何基于
FREE

Description of the MonteCarloBands Indicator The MonteCarloBands indicator is a forward-looking analytical tool that employs the Monte Carlo method to project potential future price scenarios of a financial asset. It appears as a set of five percentile bands extending into the future, visualizing a "probability cone" based on the historical behavior of the market. Visual Appearance: P50 (Median) : Solid green line at the center, representing the expected median path P25 and P75 : Two orange
FREE

Trend Master Ultra MT5 — Intelligent Trend Filter Trend Master Ultra is a professional-grade trading system designed to separate real market trends from deceptive noise. Unlike standard arrow indicators, it doesn't just react to price spikes—it validates every signal using a built-in multi-stage filtration engine. Advanced Signal Filtering The core of TrendMaster Ultra combines the power of three legendary indicators to ensure high-probability entries: ADX (Trend Strength): Automatically fi
FREE
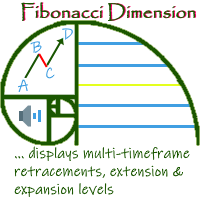
'Fibonacci Dimension' indicator allows display of preset or user-defined multi-timeframe Fibonacci levels. It automatically takes the previous high and low for two user-defined timeframes and calculates their Fibonacci retracement levels. It also considers the retraced level to draw the expansions on every change of price. A complete visual dimension in multiple timeframes allows deriving profitable strategies for execution. Enhanced functionality to view and customize the default Fibonacci Rang
FREE

这是一个正在积极维护的版本,已针对当前的MT5版本进行了重新构建和功能扩展。
在平静的市场中有效的止损距离或仓位大小,一旦波动率发生变化,可能会变得过于紧或过大。仅凭肉眼观察或单纯依靠原始ATR值来判断这种变化,并不可靠。
Phoenix ATR 波动率仪表会将当前 ATR 值与其近期历史数据进行对比分析,因此您不仅能看到原始数值,还能判断当前波动率是否异常偏低或偏高。
它如何为您解读波动率
- 实时波动率仪表,分为五个区间(“极低”、“低”、“平均”、“高”或“极高”),并基于30天滚动历史数据进行排名 - 可配置的ATR周期 - 各区间警报开关,确保您仅在关注的条件触发时收到通知
使用 Phoenix ATR 波动率仪表可: - 在入场前判断当前波动率是否支持您计划的止损幅度 - 识别往往预示突破的异常平静行情 - 避免在波动率刚开始扩大时,根据平静市场的情况来设定仓位
使用方法
1. 将其附加到任何图表上,并设置您的 ATR 周期。 2. 在设定仓位或止损前,先查看当前所处的区间。 3. 针对您希望收到通知的特定区间启用警报。
安装
从 MQL5 市场下载并添
FREE

Trading Dashboard FULL - Real-Time Performance & Analytics Calendar Trading Dashboard FULL is an advanced, interactive visual analytics tool for (MT5). Designed for serious traders, prop firm challenge takers, and portfolio managers, this indicator converts your raw trading history into a clear, comprehensive monthly calendar and real-time statistics dashboard right on your main chart window. No more switching between account tabs or downloading report files to analyze your trading performance.
FREE

Kito Trading Sessions Pro Kito Trading Sessions Pro is a MetaTrader 5 session analysis indicator designed to make the structure of the trading day easy to see.
SPECIAL OFFER: After purchasing this product, send me a private message to claim your bonus indicator FREE .
It automatically maps the Asia, London and New York trading sessions, tracks their highs, lows and ranges, maintains historical session structure and identifies the first confirmed breakout after a session has closed. The indicat
FREE

Pivot eXtreme Pivot adalah level referensi penting yang digunakan trader untuk memetakan potensi support & resistance intraday maupun jangka lebih panjang.
Dalam sistem ini, level pivot dikembangkan menjadi P (Pivot Point utama) , R1–R13 (Resistance) , serta S1–S13 (Support) . Pivot Point (P) Titik pusat utama, dihitung dari rata-rata harga (High + Low + Close) / 3 . Berfungsi sebagai acuan keseimbangan harga : Jika harga di atas P → tren cenderung bullish. Jika harga di bawah P → tren cenderung
FREE

Candle Volatility ET Classifier Indicator
A candle volatility indicator, candle classifier, and ET classification tool for MT5 that transforms raw price action into a structured market model through volatility classification. Overview
Candle Volatility Structures (CVET) is a custom candle classifier and volatility indicator designed to help traders understand market behavior through structure, volatility, and price action. This indicator provides real-time candle size measurement and candl
FREE

Классический индикатор фракталов является запаздывающим, т.к. для подтверждения образования фрактала необходимо ждать 2 бара. Если этого избежать, то индикатор будет перерисовывающим, т.е. при обновлении максимума/минимума в течении 2-х баров фрактал будет менять своё положение на более позднее. В данном продукте максимально нивелированы оба этих недостатка, при этом совмещены достоинства обоих подходов! Индикатор показывает фрактал сразу в момент его образования, а в случае его обновления показ
FREE
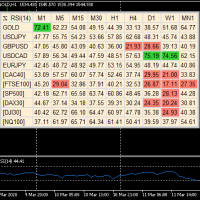
A useful dashboard that shows the RSI values for multiple symbols and Time-frames. It can be easily hidden/displayed with a simple click on the X top left of the dashboard. You can input upper and lower RSI values and the colours can be set to show when above/below these values. The default values are 70 and 30. You can choose whether the dashboard is displayed on the right or left of the chart. If you want to have 2 dashboards on the same chart you must input a different name for each. The sca
FREE

LZ Auto Fibo Retracement automatically detects the most significant swing highs and lows on your chart and instantly draws accurate Fibonacci retracement levels between them. Stop drawing Fibs manually—let the indicator do it for you dynamically as the market evolves.
Feature highlights
- Auto Swing Detection: identifies the most relevant market extremes based on a configurable swing period and lookback range. - Dynamic Updates: the Fibonacci levels automatically adjust to new highs and lows
FREE

Support Resistance Channel MT5 The Support Resistance Channel MT5 indicator plots dynamic support and resistance levels based on a configurable lookback period, displaying them as green and red lines respectively. It optionally shows goldenrod-colored arrows when price touches these levels, indicating potential trend changes (not explicit buy/sell signals) , along with customizable "RES" and "SUP" labels. With adjustable parameters like lookback period, arrow size, and label offset, it offers t
FREE

The CV ADX Indicator helps traders analyze trend strength and market structure with precision. By combining ADX, +DI and -DI analysis, the indicator helps identify strong trends early while filtering weak market conditions. Features: Trend strength detection +DI / -DI analysis Early trend confirmation Clean chart visualization Suitable for all markets and timeframes Disclaimer: This product is intended for analytical purposes only and does not constitute financial advice.
Use of this product is
FREE

具有双线信号、两级系统、多时间框架支持、可自定义视觉信号和高度可配置警报系统的高级 Fisher Transform 指标。
自由编程服务、更新和其他 TrueTL 产品可在我的 MQL5 资料页 上获取。
非常感谢您的反馈和评价!
什么是 Fisher Transform? Fisher Transform 是一种将价格转换为高斯正态分布的技术指标。由 John Ehlers 开发,它通过将价格转换为在极端正值和负值之间振荡的数值来放大价格转折点。 该指标产生清晰、明确的转折点,使识别潜在反转变得更加容易。+2.0 以上的值表示极端超买状态,-2.0 以下的值表示极端超卖状态。指标由两条线组成:主线(Fisher Transform 值)和信号线(主线的平滑版本)。这两条线之间的交叉通常被用作入场信号。 功能: 具有两级系统(高/超买和低/超卖)的双线 Fisher Transform(主线和信号线) 具有三个独立可配置信号缓冲区的視觉信号标记(箭头、垂直线) 高级信号检测:方向变化、线交叉、级别交叉、两条线的峰值/谷值 可配置的警报功能(电子邮件、推送、声音、弹出窗口),带有
FREE

CROW FVG PRO + EMA Professional Fair Value Gap (FVG) indicator for MetaTrader 5 designed for traders looking for a clean, fast and functional market visualization. CROW FVG PRO + EMA automatically detects bullish and bearish FVG zones displaying professional visual areas with midpoint (50%) line, customizable borders and an optional fast EMA directly integrated into the chart. Perfect for: Scalping Intraday trading Momentum trading Trend continuation Liquidity pullbacks Main Features: Automatic
FREE

The indicator displays divergence for any custom indicator. You only need to specify the indicator name; DeMarker is used by default. Additionally, you can opt for smoothing of values of the selected indicator and set levels whose crossing will trigger an alert. The custom indicator must be compiled (a file with ex5 extension) and located under MQL5/Indicators of the client terminal or in one of the subdirectories. It uses zero bar of the selected indicator with default parameters.
Input parame
FREE

Blame The Box is a lightweight, session range and breakout analysis indicator. It identifies custom intraday consolidation sessions, maps out dynamic breakout levels, and displays real-time position sizing directly on your chart.
Key Features Automated Session Mapping: Automatically detects and frames intraday consolidation ranges (such as the Asian session) with a customisable background and border box. Dynamic Level Projections: Automatically plots Long/Short entry buffers, Stop Loss, Break
FREE
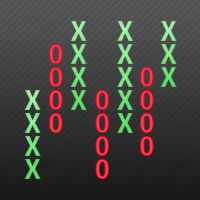
This indicator displays Point & Figure charts (PnF charts) in the indicator window. PnF charts show only price movements that are bigger than the specified box size. It helps to eliminate noise and allows focusing on main trends. Time is not a factor here. Only price movements are taken into account. That is why PnF chart is not synchronized with the main chart it is attached to. More about PnF charts: http://stockcharts.com/school/doku.php?id=chart_school:chart_analysis:pnf_charts Indicator wor
FREE

注意:此免費版本只可使用到2026/09/30
交易最怕的不是虧損,而是「方向不明」
為什麼很多交易者會被掃出場?因為他們只看單一時框。本指標透過 AI 降噪技術,將 H1 的穩健與 M15 的靈敏結合,為您打造一個自動化的趨勢過濾網。
「讓數據說話,讓 AI 帶路,您只需負責收穫成果。」本指標在商品行情圖表中顯示H1(圓點)與M15(箭頭)兩個時間段的趨勢方向,其他時間段的計算結果會顯示於下方的曲線圖中。行情的走向、震盪、強度、交易量等請參考Stochastic, MACD, RSI等指標,指標可精準地判斷波段的方向與合適的進出場時機。
指標特色如下:
1. AI 多重時框(MTF)動態演算
本指標搭載 AI 趨勢過濾算法,自動同步 H1 (長期趨勢監測) 與 M15 (精準進場導航)。AI 會自動過濾掉已知趨勢方向中不具備獲利空間的微小波動,確保你始終站在大趨勢的正確一邊並且減少盤整時的心理壓力。
H1 圓點: 您的導航雷達,鎖定大波段方向。
M15 箭頭: 您的開火按鈕,精準捕捉發動瞬間。
2. 雙週期行情圖,一眼看出方向與
FREE

The indicator draws daily support and resistance lines on the chart, as well as the Pivot level (reversal level).
Adapted to work in MT5
The standard timeframe for calculating support and resistance levels is D1. You can choose other timeframes according to your strategy (for example, for M1-M15, the optimal timeframe for calculations is H1)
The function for calculating support and resistance levels has been updated; in this calculation option, fibonacci levels are taken into account, respec
FREE

RSI Zone Master: Advanced Smooth RSI & Dynamic Visual Zones A revolutionary RSI indicator with anti-noise smoothing algorithms and transparent dynamic visual zones. Spot Overbought, Oversold, and Sideways areas in the blink of an eye! Take Your RSI Analysis to the Professional Level The Relative Strength Index (RSI) is one of the most powerful indicators in the trading world, yet it often produces false signals (noise) due to erratic price movements. RSI Zone Master is here to solve that problem
FREE

I present the well-known Moving Average indicator.
This indicator is presented as a channel, where the upper and lower lines are equidistant from the main line by a percentage set by the user.
The indicator is easy to use. The basic settings of the moving average have been saved and a percentage parameter (Channel%) has been added.
Basic parameters:
Channel% - shows how much we want to deviate from the main line.
The indicator is freely available.
FREE
MetaTrader市场是一个简单方便的网站,在这里开发者可以出售自己的交易应用程序。
我们将帮助您发布您的产品,并向您解释如何为市场准备您的产品描述。市场上所有的应用程序都是加密保护并且只能在买家的电脑上运行。非法拷贝是不可能的。
