 MetaTrader 5
 专家
 指标
 程序库
 实用工具
 窗口小部件
 规则
适用于MetaTrader 5的免费技术指标 - 42
 技术指标的信号外汇和股票市场的开仓交易和平仓交易起着至关重要的作用。指标的本质就是一种交易品种的数学转换,旨在预测未来的价格变化。
测试技术指标可以更有利于预测市场行为并从中获利。

FVGs + Alerts 是一款专为 MetaTrader 5 设计的“公允价值缺口”(Fair Value Gap)探测与可视化工具。
它旨在协助交易者识别并追踪价格失衡区域(即公允价值缺口),这些区域在“智能资金概念”(SMC)及 ICT 交易体系中,往往充当关键的支撑位、阻力位或价格反应区。
什么是公允价值缺口(FVG)?
典型的三根K线公允价值缺口形成于连续K线之间出现强烈失衡之时:
看涨 FVG(潜在支撑区):第 [n-2] 根K线的最高价 < 第 [n] 根K线的最低价
看跌 FVG(潜在阻力区):第 [n-2] 根K线的最低价 > 第 [n] 根K线的最高价
这些缺口代表了市场效率低下的区域,价格往往会在继续沿原有方向运行时,先回撤至这些区域进行填补。
主要功能
自动探测 FVG,并以彩色矩形框的形式直接绘制在图表上
看涨 FVG —— 蓝色方框
看跌 FVG —— 橙色方框
可选的中线(50% 中央平衡位),以虚线形式显示 —— 许多交易者将其视为保守的填补确认点或价格反应点
可配置的回溯周期(默认为过去 7 天),以保持图表界面的整洁
两种填补判定模式:
完全填
FREE

Candle Dominator 带高级设置的完整版本: Candle Dominator Pro 指标功能 Candle Dominator 可在任何交易品种和时间周期上自动识别看涨和看跌吞没形态。箭头仅在已收盘的K线上出现——无重绘。 信号质量过滤器 EMA 趋势过滤器 — 仅沿趋势方向发出信号 ATR 波动率过滤器 — 排除弱势和异常K线 最小K线实体大小 — 过滤不重要的形态 通知 声音提醒 弹出窗口 手机推送通知 推荐时间周期 H1及以上。在较低时间周期使用时,建议减小 Min body size(点数)参数。 参数 参数 说明 Full body overlap required 当前K线实体完全覆盖前一根K线 Min body size (points) 最小实体大小(点数) EMA trend filter 启用EMA趋势过滤器 EMA period EMA周期 ATR volatility filter 启用ATR波动率过滤器
FREE

Cobalt 高级支撑与阻力 (S&R) 指标 您的专业支撑/阻力位与突破辅助工具,在不干扰图表的情况下精准捕捉最佳价格走势。 您是否厌倦了那些在图表上充斥着凌乱垂直线的复杂指标? Cobalt Advanced S&R 采用 Bill Williams 经典的碎形 (Fractal) 逻辑,自动识别最关键的支撑位和阻力位。其“经典点状”设计让您在参考历史价位时不会感到视觉疲劳,并能与其他指标完美协同工作。 与普通 S&R 工具不同,这款由 Cobaltsw 研发的指标拥有经过优化的系统架构,不仅不会过度占用 CPU,还内置了“交易量过滤器” (Volume Filter) 以防止虚假突破 (Whipsaws)。 核心功能 清爽经典的视觉效果: 将支撑和阻力位显示为优雅的点(菱形),而不是切开屏幕的连续线。让您在实时行情中更清晰地观察历史 S&R 密集区,告别视觉噪声。 高性能引擎: 不同于每个 Tick 都要扫描完整历史记录的冗余代码,本指标的优化架构仅计算新进入的数据。这确保了零 CPU 过载,即使同时开启多个图表也能流畅运行。 智能交易量过滤器 (Smart Volu
FREE

Overview MarketX Dashboard 是一款功能强大的 MetaTrader 5 全能市场分析指标。专为希望在下单前了解任何品种的结构、市场状态和统计行为的交易者设计——一切都在图表上一个简洁的多标签窗口中完成。 没有杂乱,没有噪音,只有市场本身。 大多数指标用来寻找入场点。MarketX Dashboard 回答的是交易前真正重要的问题: 当前市场是趋势、震荡,还是正在突破? 该品种统计上最可能的回撤水平是多少? 市场结构是看涨还是看跌? 哪个交易时段该品种波动最大? 四大模块,四个标签页,一个窗口。适用于任何品种和任何时间周期。 How it works REGIME(市场状态) 对四种交易策略——趋势跟踪、均值回归、突破和剥头皮——分别在三个时间窗口(短、中、长)给出 0-100 分的评分。基于赫斯特指数(Hurst)、ADX、相对ATR、偏度和超额峰度。让您知道哪种策略适合当前市场,而不是您的偏好。 RETRACE(回撤) 基于全部可用历史数据,统计分析当前K线相对于前一根K线的回撤深度。对齐斐波那契水平(38.2%、61.8%)及至127%的整数水平。 STR
FREE

什么是Pi周期预测 (Pi Cycle Projections)? Pi周期预测是一个专为MetaTrader 5设计的综合交易系统,它为您提供双重优势:它不仅能在当前市场中识别 高概率的入场信号 (基于移动平均线交叉),还能绘制 市场未来潜在情景的可视化地图 。 可以将其视为一个二合一的系统: 一个智能信号生成器 :它通过Pi移动平均线交叉告诉您 何时 行动。 一个战略周期预测器 :它向您展示价格可能 走向何处 。 这两个功能都基于强大的“Pi周期”概念,并辅以多个可选的过滤条件来减少噪音。(请注意:启用这些过滤器后,如果信号不满足任何一个过滤条件,预测线就会消失。) 组成部分一:Pi移动平均线交叉信号生成器(“当下”) 通常,Pi信号产生于移动平均线的交叉。而这个指标通过一个 严格的4层验证过程 , 极少 生成买入或卖出箭头: Pi移动平均线交叉 :当快速移动平均线(例如111)与乘以Pi的慢速移动平均线(例如350 * 3.14)交叉时,信号产生。 强度过滤器 (ADX) :只有当ADX确认存在足够强的趋势时,信号才有效,从而避免了弱势或横盘的移动。 参与度过滤器 (成交量) :
FREE

Prime Power 是一款专为 MetaTrader 4 设计的专业分析工具,旨在实时识别 8 种主要货币的强弱。与分析单一货币对的传统指标不同,该系统同时监控整个外汇市场,通过相对资金流的数学比较,揭示强劲的趋势和高概率的反转点。 核心功能与用户指南 1. 智能交互式仪表板 中央控制枢纽,可根据货币的当前动能自动对其进行排序。 实时强弱排名: 列表是动态的;最强的货币保持在顶部(正值),而最弱的货币保持在底部(负值)。 动态折线切换器: 您可以直接在面板上点击货币名称(如 EUR 或 JPY),立即在图表上切换任何货币线条的显示或隐藏。 拖拽式界面: 通过拖动顶部标题栏,可以自由将仪表板移动到屏幕的任何位置,包括主价格窗口。 2. 快速过滤模式 [SHOW ALL] (显示全部): 立即将所有 8 条货币线恢复到图表上。 [TOP PAIR] (顶级货币对): 最大集中模式。指标自动隐藏 6 种次要货币,只留下绝对领先者和绝对落后者。这非常适合直观地显示市场背离。 3. MTF 汇合引擎 (杀手级功能) 在单个窗口内同时分析选定两种货币在三个不同时间周期上的表现。 如何激活: 点
FREE

注意:此免費版本只可使用到2026/09/30
交易最怕的不是虧損,而是「方向不明」
為什麼很多交易者會被掃出場?因為他們只看單一時框。本指標透過 AI 降噪技術,將 H1 的穩健與 M15 的靈敏結合,為您打造一個自動化的趨勢過濾網。
「讓數據說話,讓 AI 帶路,您只需負責收穫成果。」本指標在商品行情圖表中顯示H1(圓點)與M15(箭頭)兩個時間段的趨勢方向,其他時間段的計算結果會顯示於下方的曲線圖中。行情的走向、震盪、強度、交易量等請參考Stochastic, MACD, RSI等指標,指標可精準地判斷波段的方向與合適的進出場時機。
指標特色如下:
1. AI 多重時框(MTF)動態演算
本指標搭載 AI 趨勢過濾算法,自動同步 H1 (長期趨勢監測) 與 M15 (精準進場導航)。AI 會自動過濾掉已知趨勢方向中不具備獲利空間的微小波動,確保你始終站在大趨勢的正確一邊並且減少盤整時的心理壓力。
H1 圓點: 您的導航雷達,鎖定大波段方向。
M15 箭頭: 您的開火按鈕,精準捕捉發動瞬間。
2. 雙週期行情圖,一眼看出方向與
FREE

BinaWin NoTouch is an indicator that sends an alert signal when the trade is in the right position to wait for the breakdown of a side market.
It is specially designed to trade under the “No Touch” strategy of the Binary.Com platform with synthetic indexes N.10, N.25, N.50, N.75 and N.100
Similarly, trading can be done with the conventional CALL and PUT strategy of any Binary Options platform.
Requirements to use the indicator:
1. Have an account at Binary.Com
2. Configure the Binary.Com d
FREE
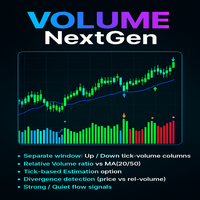
The Advanced Volume Flow Indicator is a free and practical tool who want to clearly see the balance between buying and selling pressure in the market. Instead of just showing total volume, this indicator separates volume into Up Volume (green bars) and Down Volume (red bars), making it easy to understand which side of the market is stronger at any moment.
The indicator also calculates a Relative Volume Line (blue), which shows whether the current trading activity is higher or lower than usual
FREE

CV Session Range Pro – Professional Trading Session Indicator for MetaTrader 5 CV Session Range Pro is a professional trading session indicator for MetaTrader 5, designed for precise visualization and analysis of global market sessions, trading ranges, and important price areas. The indicator helps traders analyze market activity, volatility phases, and liquidity zones of different trading sessions with a clean and structured visual interface. Supported Sessions: Tokyo Session Frankfurt Session
FREE

具有双线信号、双级系统、多时间框架支持、可自定义视觉信号和高度可配置警报系统的高级TSI(真实强度指数)。
自由职业编程服务、更新和其他TrueTL产品可在我的 MQL5主页 获取。
非常欢迎您的反馈和评价!
什么是真实强度指数(TSI)? 真实强度指数(TSI)是由William Blau开发的动量振荡器。它对价格动量(当前收盘价与前收盘价之差)应用双重指数平滑,从而有效过滤市场噪音并揭示潜在趋势方向。 TSI在-100和+100之间振荡,由两条线组成:TSI主线和信号线(TSI的移动平均线)。正值表示看涨动量,负值表示看跌动量。两条线之间的交叉以及穿过高/低水平线的运动是主要的交易信号。 功能特点: 具有双级系统(高位和低位超买/超卖区域)的双线TSI(主线和信号线) 具有三个独立可配置信号缓冲区的视觉信号标记(箭头、垂直线) 高级信号检测:两条线的方向变化、线交叉、水平交叉、峰谷 具有时间范围过滤的可配置警报功能(电子邮件、推送、声音、弹出窗口) 具有插值、多种颜色模式和用于EA集成的iCustom缓冲区访问的多时间框架(MTF) 输入参数: 基本设置: TSI参数: 长周
FREE

️ NEXORA CANDLE TIMER — Professional Bar Countdown for MT5 Stay perfectly synchronized with the market using Nexora Candle Timer , a clean and ultra-precise countdown tool designed for traders who rely on timing, price action, and candle behavior. Whether you trade manually or use automated strategies, this indicator keeps you informed about exactly when the next candle begins — without cluttering your chart. Overview Nexora Candle Timer is a lightweight yet powerful MetaTrader 5 utility tha
FREE

Blahtech Fisher Transform indicator is an oscillator that displays overbought and oversold locations on the chart. The Fisher Transform algorithm transforms prices with any distribution shape into a normal distribution. The end result is a curve with sharp turning points that may help to identify bullish or bearish trends. Fisher Transform values exceeding 1.66 on the daily chart are considered to be good areas for reversal trades. Links [ Install | Update | Training | All Products ]
F
FREE

RBM Pivot Zones automatically detects pivot highs and lows directly on the chart, marking each level with a horizontal line and a subtle visual zone. The logic is straightforward: the indicator scans price history looking for structural tops and bottoms, the areas where price arrived, rejected, and reversed. Pivot highs in blue, pivot lows in red. Clean chart, no clutter. The indicator adjusts to any timeframe automatically. It works the same way on M5, H1, or D1 without reconfiguration. Sensiti
FREE
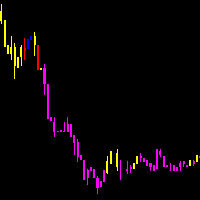
As médias coiote automatizam a leitura de analise de médias rápidas e lentas no saldo do volume e preço. Quando as médias estão em modo compra, a coloração do candle fica azul.
Quando as médias estão em modo venda, a coloração do candle fica magenta. Quando a coloração fica verde ou vermelho, temos a tomada das médias no volume mas não no preço, quando isso ocorre é um sinal de atenção.
A concepção do indicador é ser utilizado para operações em saída de consolidações na direção da tendencia do
FREE

EquiSentra P&L transforms your MetaTrader 5 (MT5) account history into a clean, institution-ready performance report. You can filter closed deals by any date range, review full profit-and-loss details—including swaps, commissions, and all trading costs—and export a professional PDF accompanied by CSV data and checksums for easy reconciliation and audit. The report is self-generated directly from terminal data, so it is not a broker-certified statement and is not GIPS verified, but it provides t
FREE

由于无法确切知道当前K线何时收盘,很容易错过预定的操作(移动止损、执行预定入场、在收盘时检查交易机会),尤其是在几秒钟都至关重要的较低时间周期上。
Phoenix Candle Timer Panel 会实时显示距离下一根K线收盘的秒级倒计时,并同时显示当前交易品种和时间周期,因此您始终能准确掌握当前K线剩余的时间。
如何提升您的时机把握能力
- 实时倒计时至下一根K线收盘,每秒更新一次
- 两种颜色模式:K线方向(看涨/看跌)或时间紧迫度(随着收盘临近,依次显示安全/警告/紧急)
- 可选12小时制时间格式
- 可配置在收盘前设定秒数时触发提醒,通过弹窗、声音或推送通知发送
自定义设置
面板位置(自动居中或手动调整 X/Y 坐标)、各紧急程度阶段的颜色阈值,以及用于即时隐藏或显示面板的热键。
使用 Phoenix K线计时器面板可:
- 精准把握 K线收盘时的入场、出场或止损调整时机
- 在低时间周期 K线快速收盘前获得早期预警
- 无需将视线从价格上移开,即可随时掌握距收盘剩余时间
使用方法
1. 将其附加到任何图表上,
FREE

该指标仅显示类似布林带风格的波动通道的上轨和下轨,不绘制中间的移动平均线。其主要目标是提供一个简洁且灵活的波动性包络,使用户能够专注于价格相对于通道边界的行为,同时保持对图表外观和布局的完全控制。 与传统布林带不同(传统布林带始终显示中间均线),本指标仅在计算中使用移动平均线。中间线被有意隐藏,以减少视觉干扰,并允许用户根据需要单独管理或添加中间线。 上轨和下轨可以分别设置不同的颜色,从而实现更清晰的视觉区分,并适应不同的图表主题或个人偏好。若用户希望还原传统布林带的外观,可以添加一个具有相同参数的独立移动平均指标,从而完全自定义中间线的样式和显示方式。 该指标使用移动平均线作为波动通道计算的内部基准。默认情况下采用简单移动平均(SMA),以确保计算的透明性和一致性。同时也支持其他类型的均线,例如指数移动平均(EMA)、平滑移动平均(SMMA)和线性加权移动平均(LWMA),从而使波动通道能够适应不同的市场环境和分析需求。 主要特点: 仅显示上下波动通道
不绘制中间线(仅用于计算)
上下轨支持独立颜色设置
支持多种均线类型(SMA、EMA、SMMA、LWMA)
界面简洁、清晰
周期和偏
FREE

ULTIMATE RSI PRO X-TREME: MULTI-FILTER REVERSAL SYSTEM MT5
Welcome to the most advanced, highly customizable, and powerful RSI-based indicator available on the MQL5 Market! The "Ultimate RSI Pro X-Treme" (RSI TVKU) is not just another standard Relative Strength Index indicator. It is a complete, all-in-one trading system designed for serious tr
FREE

SizeInPips Indicator – Visualize Candle Size with Ease!
Unlock the power of price action analysis with the SizeInPips Indicator ! This simple yet powerful tool is designed for traders who want to quickly measure and visualize the size of each candle (bar) in pips, helping you make informed trading decisions with confidence. Whether you're a beginner or an experienced trader, SizeInPips is the perfect addition to your MetaTrader 5 toolkit.
What Does It Do? The SizeInPips Indicator calculates
FREE

每位交易者都熟悉这套流程:打开指标设置,改一个数字,点确定,眯着眼盯图,觉得不对,再打开设置。Stochastic 比任何其他振荡指标都更折磨人——三个周期加两条水平线,等于要调对五个数字,而每换一种组合就要再跑一趟设置窗口。Stochastic Live Tuner 终结了这一切。 这是经典的双线慢速 Stochastic(%K 与 %D),而且可以 直接在图表上实时调参 。图表上会出现一个小面板,带五个滑块:%K 周期、%D 周期、Slowing,以及两条水平线。拖动其中任何一个,指标都会在你注视之下立刻重算并重绘。5,3,3 还是 14,3,3?80/20 还是 75/25?这些问题几秒钟就能在你自己的图表上得到答案,而不用去翻论坛帖子。 一个按钮切换 %D 方法。 直接在面板上循环切换 %D 的平滑方式——SMA、EMA、SMMA、LWMA。改动在按下的瞬间就体现在图表上。 真正的 Stochastic,不是套壳。 指标使用自有的经典慢速 Stochastic 实现:在 slowing 窗口上计算 %K = 100 x SUM(close - LL) / SUM(HH - LL
FREE

Ultimate MACD MTF Pro 是经典 MACD 的强大升级版 — 专为现代交易重新设计。 该指标为您提供 多周期 MACD (MTF)、动态直方图颜色、信号交叉标记以及基于动量的智能线条变色功能 。 专为追求清晰信号、早期趋势检测和专业级视觉清晰度的交易者打造。 主要功能 多周期 MACD (MTF) 轻松在当前图表周期或更高周期(H1, H4, D1…)之间切换。 非常适合自上而下的趋势确认。 清晰的 MACD 和信号线 – 可调节线条宽度 – MACD 穿过信号线时自动变色 – 平滑且视觉清晰的设计 5 色智能直方图 直方图根据以下情况变为 5 种不同颜色: 动量增加 动量减少 零轴上方或下方 趋势转变方向 这让您可以即时洞察趋势强度和反转。 交叉点(入场/出场点) 当 MACD 穿过信号线时,指标会绘制清晰的点: 绿色点 = 看涨交叉(买入机会) 红色点 = 看跌交叉(卖出机会) 非常适合发现早期反转。 高度可定制 您可以显示/隐藏: MACD 线、信号线、直方图、交叉点、MTF 模式、变色模式。 还包括
FREE

Ninja Dual EMA Cross The Sniper of Moving Average Crossovers How many perfect entries have you missed just because you glanced away for a moment?
How many times did your EMAs cross exactly like your system dictates… and you weren’t in front of the screen? It's over. Ninja Dual EMA Cross is the automatic execution of your moving average strategy. You set the periods, it watches without blinking, draws the signal without ever repainting , and alerts you instantly. No emotions, no delays, no ex
FREE

Fisher Transformation Indicator for MT5 – Spot Trend Reversals Before They Happen! The Fisher Transformation Indicator is your go-to tool for crystal-clear market movement detection. Through mathematical transformation of price data, it delivers unmistakable buy and sell signals – right there in your chart where you need them.
Key Benefits: Early Warning System for Trend Changes – catch uptrends and downtrends before the crowd Crystal Clear Buy & Sell Signals – color-coded for instant recogniti
FREE

Jireh Fair Value Gap Detector Overview The Jireh Fair Value Gap Detector automatically identifies Bullish and Bearish Fair Value Gaps (FVGs) and draws their imbalance zones directly on the chart. Designed for traders who use Price Action , Smart Money Concepts (SMC) and ICT methodology , the indicator helps identify high-quality imbalance areas through advanced filtering and a clean, fully customizable interface. Main Features Automatic Bullish & Bearish Fair Value Gap Detection Automatic FV
FREE

The Kijun-sen , also known as the Base Line , is arguably the most critical component of the Ichimoku Kinko Hyo system. While many traders focus on the "Cloud," professional traders know that the Kijun-sen is the true heartbeat of market momentum and trend direction. This indicator calculates the midpoint of the highest high and the lowest low over the last 26 periods , providing a stable, medium-term view of the market’s equilibrium.
FREE
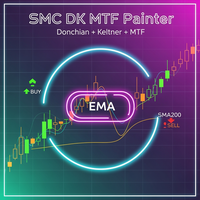
SMC Donchian Keltner MTF Trend Painter The SMC Donchian Keltner MTF Trend Painter for MetaTrader 5 is a versatile trend indicator that combines Donchian and Keltner channels with a multi-timeframe EMA bias. It delivers a clear, multi-dimensional view of market trends and precise trading signals – ideal for both intraday and swing traders. Key Features: Multi-Timeframe Trend Assessment: Candles are colored according to EMA bias from two timeframes (e.g., H1/H4), instantly showing the dominant ma
FREE

The Chandelier Exit Indicator for MT5 is a powerful tool designed to help traders manage trades by dynamically adjusting stop-loss levels based on market volatility. It is based on the Average True Range (ATR) and follows the trend, placing stop-loss levels above or below price action, depending on the trend direction. This makes it an effective tool for trend-following strategies, breakout trading, and risk management .
Key Features: • Dynamic Stop-Loss Placement – Adjusts stop-
FREE

MSM Multi Chart Crosshair Sync keeps several MetaTrader 5 charts on the same moment in time. Click on one chart and all other charts scroll to the same time, even far back in history. It is useful when you study one symbol on several timeframes, or several symbols side by side, and want to see what happened on every chart at the same candle. How it works Attach the indicator to every chart that should stay in sync. Left-click on any chart. The other charts move so that the clicked time is in the
FREE

Moving Average Sentiment "Transform Raw Market Data into Clear Sentiment Vision" Moving Average Sentiment is a next-generation adaptive trend sentiment indicator that visualizes the true bias of the market — bullish, bearish, or neutral — in real time. It combines Moving Average dynamics with ATR-based volatility zones , creating a fluid, self-adjusting sentiment curve that reacts instantly to price structure and volatility shifts. This tool goes beyond a simple MA — it reads the behavior of th
FREE

UZFX 现代K线计时器数字时钟 v1.0
专为MetaTrader 5设计的、具备现代数字界面的专业倒计时器
UZFX现代K线计时器数字时钟将提升您的交易体验。这款简洁、精准且功能强大的指标专为重视图表清晰度与专业性的严肃交易者设计。
主要功能: 精准K线倒计时:实时显示当前K线收盘前的剩余时间,采用大号易读的数字格式(时:分)。 动态进度条:通过色彩编码的警报直观展示K线进展,随着K线接近结束,颜色将从绿色变为橙色,最终变为红色。 全面的市场信息:一目了然地显示当前交易品种、时间周期和实时点差。 浮动盈亏面板:监控并显示持仓的总浮动盈亏,采用清晰的正负色标区分。 专业日期显示:完整的工作日和日期信息,提升图表可读性。 现代且可自定义的用户界面:七种优雅主题,包括 UZFX 标志、青柠、水蓝、金、棕、灰和石板灰。 灵活定位:支持将时钟放置于左上、顶部中央、右上、左下或右下位置,并可调节 X 和 Y 偏移量。 性能优化:轻量级代码确保运行流畅,专业排版呈现高端视觉效果。 该指标非常适合短线交易者、日内交易者以及任何需要精准时间点来执行基于K线策略的交易者。简洁现代的设计确保其能完
FREE

Relevance Zones Indicator — Price Structure and Price Action Concept An indicator designed for Swing Trading analysis , based on price structure, support and resistance, and average price movements , applying the concept of moving averages within a Price Action framework. Its purpose is to identify and highlight, through horizontal lines , price regions where the market has demonstrated relevant behavior throughout its historical movement. These regions are displayed as areas of attention , all
FREE

具有多时间框架支持、可自定义视觉信号和可配置警报系统的加速振荡器(AC)指标。
免费编程服务、更新及其他 TrueTL 产品请访问 MQL5 个人主页 。
非常感谢您的反馈和评价!
什么是 AC? 加速振荡器(AC)是由 Bill Williams 开发的动量指标,用于测量当前驱动力的加速或减速。该指标计算为 Awesome Oscillator(AO)与其 5 期简单移动平均线(SMA)之间的差值。 AC 显示市场动量是在加速还是减速。正值表示向上方向的加速,负值表示向下方向的加速。当 AC 穿越零线时,标志着加速方向的变化。交易者经常使用 AC 来确认趋势强度并识别潜在的进场或出场点。 功能特点: 带箭头标记和垂直线的视觉信号标记 具有可配置触发条件的三个独立信号缓冲区 信号检测选项:方向变化、水平线穿越、峰值/谷值 每个信号可配置警报功能(邮件、推送、声音、弹窗) 支持插值方法的多时间框架(MTF)功能 直方图或折线绘制模式 多种颜色模式(简单、方向型、水平线型) 支持 Expert Advisor(EA)集成的自定义指标(iCustom)缓冲区访问 输入参数: 基本设置:
FREE

Attention - the indicator was initially developed for trading futures and the nuances of the Sunday session. This modification does not take into account the Sunday premarket, but is strictly tied to the time on the chart for correct operation on the spot market. Standard ATR indicator, you can enable ignoring abnormally large candles. It is possible to change the location of the displayed text in 4 corners of the chart. You can change the calculation period (days ago). Bonus - the indicator ha
FREE

The Phoenix Magic Levels indicator is a professional-grade institutional analysis suite for MetaTrader 5, specifically designed for high-precision Gold (XAUUSD) scalping. It transforms standard charts into a tactical dashboard by identifying institutional order flow, liquidity pools, and market inefficiencies. Core Functionality & Features Institutional Liquidity Detection: Automatically scans for "High-Ratio Wicks" and Fair Value Gaps (FVG) across multiple timeframes to reveal where "Big Mone
FREE
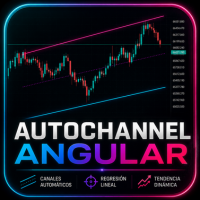
AutoChannel Angular Dibuje automáticamente canales de tendencia dinámicos utilizando regresión lineal AutoChannel Angular es un indicador para MetaTrader 5 que genera automáticamente canales de tendencia mediante un algoritmo basado en regresión lineal . Analiza el comportamiento del precio dentro de un período configurable y proyecta un canal compuesto por una línea superior, una línea media y una línea inferior, proporcionando una referencia objetiva sobre la dirección predominante del mercado
FREE

Regime Matrix 是一款多时间框架市场状态指标,旨在对所选时间框架上的当前市场环境进行分类。它会直接在图表上显示紧凑的分析面板,并通过 iCustom() 为智能交易系统提供缓冲区。 该指标帮助交易者评估市场是处于趋势、区间、压缩、扩张,还是过度延伸状态。每个时间框架都会独立计算,使短期与高周期市场条件能够在同一视图中进行比较。
面板列 TF — 被分析的时间框架。 STATE — 检测到的市场状态。 LONG — 0 到 100 的方向偏向评分。数值越高,表示多头条件越强。 SHORT — 0 到 100 的方向偏向评分。数值越高,表示空头条件越强。 VOL — 标准化波动率评分。接近 1.00 的数值表示正常波动率,低于 1.00 表示波动率降低,高于 1.00 表示波动率升高。VOL 不表示交易量或跳动量。
市场状态 中性 — 未检测到主导性的市场条件。 上升趋势 — 当前结构偏向上行。 下降趋势 — 当前结构偏向下行。 区间 — 未检测到强烈的方向性主导。 压缩 — 波动率相对收缩。 扩张 — 相较近期条件,波动率处于升高状态。 向上过度延伸 — 价格相对于当前结
FREE

VTX OMNIBOARD 是一款专为 MetaTrader 5 设计的全功能多品种、多周期趋势监控面板(Dashboard)。基于 Vortex (VTX) 涡流趋势算法与价格动量分析,帮助交易者在单一图表上一眼掌握整个市场的多空结构与强弱变化,无需频繁切换图表。 无论您是剥头皮交易者、波段交易者还是长线交易者,VTX OMNIBOARD 都能将复杂的市场动态转化为直观的趋势方向、动量强度及高胜率反转预警。 核心优势与主要功能 多品种 & 多周期扫描器: 在单个主图上同时监控多个货币对、黄金贵金属或指数在不同周期(M1 至 MN1)的走势。 高精度 Vortex (VTX) 算法: 精确测量正向 (+VI) 与负向 (-VI) 市场涡流动态,提早捕捉新趋势启动,有效过滤震荡噪音。 一键图表直达: 点击面板上的任意品种或周期按钮,立即快速切换当前图表。 全方位智能提醒: 支持趋势金叉死叉与多周期共振(Confluence)实时推送:桌面弹窗、手机 MT5 Push 推送及邮件提醒。 极低资源占用: 代码深度优化,即使同时扫描 20 个以上品种,也不会造成图表卡顿或 CPU 负载过高。
FREE

MACD Signal Pro – Многовременной сканер
MACD Signal Pro – это продвинутый индикатор, разработанный для трейдеров, которым нужны четкие, отфильтрованные и подтвержденные сигналы на разных таймфреймах.
Он сочетает в себе мощь классического MACD с интеллектуальным многовременным сканером, отображаемым в современном визуальном интерфейсе, чтобы избежать ложных сигналов и повысить точность входа.
Идеально подходит для Форекс, индексов, криптовалют и металлов.
ОСНОВНЫЕ ХАРАКТЕРИСТИКИ
FREE
交易实用必备工具指标 波浪自动计算指标,通道趋势交易 完美的趋势-波浪自动计算通道计算 , MT4版本 完美的趋势-波浪自动计算通道计算 , MT5版本 本地跟单复制交易 Easy And Fast Copy , MT4版本 Easy And Fast Copy , MT5版本 本地跟单复制交易 模拟试用 Easy And Fast Copy , MT4 模拟账号运行 Easy And Fast Copy , MT5 模拟账号运行 顺势指标又叫CCI指标,CCI指标是 美国 股市 技术分析 家唐纳德·蓝伯特(Donald Lambert)于20世纪80年代提出的,专门测量股价、外汇或者贵 金属 交易是否已超出常态分布范围。属于超买超卖类指标中较特殊的一种。波动于正无穷大和负无穷大之间。但是,又不需要以0为中轴线,这一点也和波动于正无穷大和负无穷大的指标不同。 相对强弱指标RSI是根据一定时期内上涨点数和下跌点数之和的比率制作出的一种技术曲线。能够反映出市场在一定时期内的景气程度。由威尔斯.威尔德(Welles Wilder)最早应用于期货买卖,后来人们发现在众多的图表技术分析中,
FREE

ATS Daily Performance 以柱状图和数字在图表上的紧凑面板中显示最近30天每天的盈亏。打开即可一眼看出哪些天赚钱、哪些天亏损,以及本月进展如何。 您将看到 - 每天一根柱:盈利日为绿色,亏损日为红色 - 最近30天的净结果、今天的结果以及未平仓交易的盈亏 - 胜率、盈利天数、盈利因子、最佳日和最差日 - 最近7天的结果列表 - 深色和浅色主题,面板可拖动 工作原理 指标读取您账户的成交历史,并按天汇总盈利、隔夜利息和佣金。日期按经纪商服务器时间。可以统计整个账户或仅统计当前图表品种,也可以不计入隔夜利息和佣金。 指标只读取历史。它从不开仓、修改或平仓,也不需要交易权限。 截图显示的是模拟交易,不是真实或模拟账户。它们展示的是面板,而不是收益。 设置 统计的成交(整个账户 / 图表品种)、是否计入隔夜利息和佣金、显示面板、主题(深色 / 浅色 / 自动)、面板位置。 适用于任何品种和周期。 如果这个工具对您有帮助,欢迎留下简短评价。有问题或功能建议?请在评论中告诉我。 Andy Trading Solutions
FREE
AliPivot Points is a Meta Trader 5 Indicator that draws you the latest pivot points. You can choose from timeframes ranging from 1 Minute to 1 Month. Calculation methods for pivot points includes: Classic Pivot Points Camarilla Pivot Points Fibonacci Pivot Points Woodie Pivot Points You can personalize the line colors, style, and width to suit your preference. The indicator displays values on the right side of the chart. AliPivot Points values can also be utilized by developers for creating Expe
FREE

Advanced Trade Information Dashboard – MT5
Everything I need to know about my account and open positions, right on the chart.
I got tired of clicking between the terminal, the trade tab, and the calculator just to check my margin, pip value, or total profit in pips. So I built this dashboard to put it all in one place.
What It Shows Total P&L – Real profit/loss from the positions I care about (filter by symbol, magic number, or include swap/commission).
Margin Level – The one number th
FREE

Session Breakout Master is a high-performance trading tool designed to capture explosive moves following the breakout of major trading session ranges (Asia, Europe, and USA). It automatically visualizes volatility zones and utilizes a Moving Average filter to ensure you stay on the right side of the market trend. Key Features: Automated Session Mapping: No more manual drawing. The indicator identifies and plots Asia, Europe, and USA session boxes automatically. Trend Filtering: Built-in MA filte
FREE

Smc Session Killzone and Breakout
The Smc Session Killzone and Breakout indicator automates the institutional session trading model for MetaTrader 5. It draws the Asian, London, and New York session ranges as labelled boxes on the chart, detects when price sweeps beyond the Asian session high or low, and fires a non-repainting entry signal after a Market Structure Shift is confirmed. All signals are based on closed bars and do not repaint. The underlying model follows the sequence that institut
FREE

Momentum Maxwell V1 PRO: The Sniper Hybrid Energy Momentum Maxwell V1 PRO no es un oscilador convencional; es una herramienta de precisión balística diseñada para el trader que opera como un francotirador . Mientras que los indicadores estándar se pierden en el ruido del mercado, el Maxwell V1 PRO utiliza un motor de triple filtrado de energía para detectar el agotamiento del precio con una nitidez quirúrgica. A diferencia del RSI o el Estocástico, que confinan sus datos en una escala artificial
FREE

News Hound for MT4 / MT5
A professional economic news calendar for every chart — MT4 and MT5 — from the same trusted MQL5.com source. MetaTrader 5 has a built-in economic calendar. MetaTrader 4 doesn't. This tool fixes that — and gives you a single, shared news feed that every chart on your PC or VPS can read, in both platforms.
Why I built it This is the foundation for something bigger. All my upcoming Expert Advisors are built around this news engine. Instead of locking news filtering insid
FREE

AUC - S&R Clusters 是一个基于价格行为分析,用于识别支撑位和阻力位区域的指标。 该指标使用历史数据来检测价格多次发生交互的区域,并根据这些信息将相近水平分组为区域。 与固定水平不同,该指标会根据市场变化调整这些区域,从而帮助观察价格结构中的关键位置。 ---------------------------------------------
工作原理 该指标持续分析: K线历史 价格交互区域 基于历史数据的水平间距 基于这些信息: 将相近水平分组为定义区域 减少不太重要的水平 显示价格曾经活跃的区域 -------------------------------------------------
特点 自动识别支撑和阻力区域 水平分组为区域 基于历史数据进行调整 图表中清晰显示区域 支持多时间周期和多种交易品种 说明
该指标仅作为分析辅助工具,不替代风险管理或用户决策。
FREE

This indicator marks the 50% mark of each candle. It will help you make profitable scalping trades. If the next candle opens above the 50% mark of the previous candle, you should open a BUY position, and if the next candle opens below the 50% mark of the previous candle, you should open a SELL position. This strategy is very profitable. To make the most of it, keep an eye on the candle contexts on the left. Good luck!
FREE

VWAP FanMaster:精准掌握回调策略!
VWAP FanMaster 是专为追求 精准入场点 和 高效回调交易 的交易者打造的终极指标。 它结合了 VWAP(加权平均成交价) 与 斐波那契扇形线 ,清晰标绘出市场中的重要价格区域。 主要特点 简单而强大 :只需移动垂直线,指标将自动绘制 VWAP 和 斐波那契扇形线 。
智能交易策略 :等待价格回到绘制的区域,以捕捉 完美回调 的支撑和阻力点。
高级可视化工具 :快速识别 价格共振区域 ,做出果断的交易决策。 为什么选择 VWAP FanMaster? 易于使用 ,适合新手和资深交易者。
提升交易精度 ,通过结合两种强大的分析工具。
改善风险管理 ,提供清晰一致的价格预测。 优化您的交易策略,用 VWAP FanMaster 轻松掌控市场!
FREE

Fibonacci Auto Channel Dibuje automáticamente canales dinámicos con niveles de Fibonacci integrados Fibonacci Auto Channel es un indicador para MetaTrader 5 que construye automáticamente un canal dinámico utilizando los máximos y mínimos recientes del mercado, incorporando de forma simultánea los niveles internos de Fibonacci 23.6%, 38.2%, 50%, 61.8% y 76.4% . Esta combinación permite analizar la estructura del precio, identificar zonas potenciales de soporte y resistencia dinámicas y evaluar la
FREE

# Tulip Trading Panel v1.0 郁金香交易面板
## MetaTrader 5 专业多因子技术分析指标
---
### 产品概述
Tulip Trading Panel 是一款综合性技术分析指标,将 **24个专业级技术指标** 整合到一个优雅的仪表板中。采用先进的加权评分算法,结合分类分析,提供清晰的买卖信号、置信度和趋势质量指标。
---
### 核心功能
**24个技术指标:** - **趋势类:** EMA、一目均衡表、抛物线止损、唐奇安通道、VWMA、多周期确认(H1+H4) - **动量类:** RSI、MACD、随机指标、CCI、W%R、振荡器、随机RSI - **波动类:** ATR、布林带挤压、肯特纳通道、波动指数 - **成交量类:** 成交量分析、能量潮(OBV)、资金流量指数(MFI) - **方向类:** ADX +/-DI、阿隆振荡器
**高级评分算法:** - 加权评分系统,分类分析 - 共识检测(指标一致时加分) - 冲突惩罚(信号分歧时减分) - 类别对齐奖励(趋势+动量+成交量) - 强信号奖励 -
FREE

BarionQuant MACD Color Lite displays a custom four-color MACD histogram that makes momentum shifts easy to read at a glance. DIF and DEF lines are included; divergence detection is reserved for the paid Divergence Pro edition. HOW IT WORKS DIF = Fast EMA(12) minus Slow EMA(26) DEF = Smoothed signal line of DIF Energy = (DIF − DEF) × 2, split into four histogram colors: Above zero, lengthening → red (momentum building) Above zero, shortening → aqua (momentum fading) Below zero, lengthening → gree
FREE

RSI Multi-Timeframe Dashboard shows the RSI of four timeframes at the same time, directly on your chart, so you can read momentum across the whole market at a glance instead of switching charts one by one. By default it displays the M15, H1, H4 and D1 timeframes, and every setting is configurable. Each timeframe is color coded so the current condition is easy to see, with red for overbought, green for oversold and grey for neutral. Alerts are based on the closed bar, which keeps them stable so t
FREE

Gold Daily Analysis Engine
Gold Daily Analysis Engine is a MetaTrader 5 indicator designed for XAUUSD daily structure analysis.
The indicator helps traders observe daily gold movement through structure levels, daily range behavior, liquidity sweep conditions, reaction zones, and a simple market status panel. It is a manual decision-support tool and does not place trades automatically.
Overview
Gold can move quickly during active market sessions. This indicator is designed to organize the da
FREE

The indicator looks for the "Fifth dimension" trade signals and marks them on the chart. A detailed description of the chart patterns that generate the trade signals can be found in Chapter 8 "The Balance Line Trades" in the book Williams' "New Trading Dimensions". Signal levels with indication of the position entry or stop loss placement price are indicated directly on the chart. This feature creates additional convenience for the trader when placing pending orders. A solid horizontal line is d
FREE
Hi Traders, The Volume Spike Alert Indicator is a lightweight, non-lagging tool designed to help traders identify unusual volume activity in real time. This indicator calculates the average tick volume over a user-defined number of previous bars and compares it with the current candle’s volume. When the current volume exceeds the average by a specified percentage, the indicator triggers alerts, allowing traders to quickly spot potential breakouts, institutional activity, or strong market interes
FREE

TRUE TIMER - Candle Countdown
真实时间K线倒计时 在任何周期上显示距离当前K线收盘剩余的时间(MM:SS),实时精确到秒。内置智能提示,在新K线开始及最后20秒时进行提醒。 主要功能: 精确的服务器时间倒计时 自动识别背景颜色(浅色 / 深色) 智能提示:“新K线”提醒 & 关键时间提醒 支持所有周期:M1 → 月线 适合人群:短线交易者(Scalpers) & 精准入场时机把控 如果你需要 更偏向营销用语 或 更技术化的中文版本(用于指标说明 / MQL5 市场) ,我也可以帮你再优化一版。...........................................................................................................
FREE

Improve Your Trading with Buraq RSI Detector!
Buraq RSI Detector makes trading easier by spotting important RSI levels and marking them on your chart with clear bars. This helps you see exactly when to enter or exit trades. Key Features: Set Your Own RSI Levels: Choose the levels you want, and Buraq RSI Detector will mark them when the RSI touches those points. Clear Visual Signals: Bars appear on your chart as soon as the RSI hits your chosen levels, making it easy to find trading opportunitie
FREE

Daily Price Ruler Pro - Visual Grid for Daily Open Levels
An essential visual tool that creates a dynamic, customizable "Price Ruler" anchored to the Daily Open price. Perfect for day traders to track pip/point distances from the start of the day at a glance. Full Description: Daily Price Ruler Pro is a lightweight, highly customizable indicator designed for precise price action and distance tracking. It automatically plots a vertical "Ruler Body" ahead of the current price action, with hor
FREE
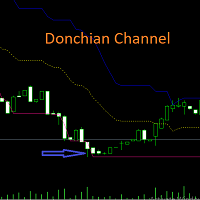
Harness the Power of Donchian Channels for Trend Trading
The Donchian Channel Indicator may your key to precision trading. With Donchian channels, you'll gain insights into market volatility, breakouts, and overbought/oversold conditions. This winning strategy is named after its developer, Richard Donchian.
How Does the Donchian Strategy Work? The upper band represents the previous period's highest high; The lower band represents the previous period's lowest Low; The centre band reflects
FREE

The Smart Turtle Indicator is an advanced, fully non-repainting trend-following system designed specifically for MetaTrader 5. It is heavily inspired by the legendary "Turtle Traders" strategy developed by Richard Dennis and William Eckhardt, but refined with modern visual enhancements to make trading decisions clearer and more intuitive. Unlike standard Donchian Channel indicators, the Smart Turtle Indicator uses a dynamic internal logic to track trend shifts (K1 Line) and trailing stops (K2 Li
FREE

Cobalt MACD Multi-Timeframe (MTF) 面板 一眼看穿市场全局,掌控多维趋势。 Cobalt MACD MTF 是一款专为专业交易者量身定制的高级战略分析面板。该指标能够实时扫描多达 21 个时间周期(从 M1 到月线),并将复杂的动能数据转化为图表上简洁、直观且可交互的控制面板。 无需再频繁切换时间周期来观察“大局”。凭借 Cobalt Software 的强大技术,全周期的市场动能尽在您的掌控之中。 核心功能 灵敏的拖拽体验 (Drag & Drop): 只需用鼠标点击并拖动,即可将面板置于图表的任何位置。再也不用担心面板遮挡您的核心指标。 全周期覆盖: 支持 21 个时间周期,让您在关注短期波动的同时,清晰把握高周期 (HTF) 的大趋势方向。 三重分析算法: 为每一个启用的时间周期提供三维深度检查: 零轴状态: MACD 主线位于 0 轴之上(多头)还是之下(空头)? 动能方向: 与前一根 K 线相比,MACD 是在上升还是下降? 信号线交叉: MACD 主线位于其信号线之上还是之下? 高级通知中心: 当所有周期的信号达成一致(共振)或满足您的
FREE

具有多时间框架支持、可自定义视觉信号和可配置警报系统的Chaikin Money Flow(CMF)指标。
自由职业编程服务、更新及其他TrueTL产品详见 MQL5主页 。
非常欢迎您的反馈和评价!
什么是CMF? Chaikin Money Flow(CMF)是由Marc Chaikin开发的成交量加权动量指标,用于衡量指定时期内的买卖压力。指标计算每个周期的资金流量乘数,并在回溯期内创建加权平均值。 CMF在+1到-1之间振荡,正值表示买入压力(积累),负值表示卖出压力(分配)。高于零的值表明市场处于积累阶段,而低于零的值则表示分配。该指标通过分析价格与成交量之间的关系,帮助交易者确认趋势强度并识别潜在反转。 功能特点: 带有箭头和垂直线的视觉信号标记 三个独立信号缓冲区,可配置触发条件 信号检测选项:方向变化、水平交叉、峰值/谷值 每个信号可配置警报功能(电子邮件、推送、声音、弹窗) 带插值方法的多时间框架(MTF)功能 柱状图或折线图绘制模式 多种颜色模式(简单、基于方向、基于水平) 用于Expert Advisor(EA)集成的自定义指标调用(iCustom)缓冲区访
FREE

QUANTUM VIXES EMPEROR - AI Trading System for Deriv VIX Indices Professional indicator designed exclusively for Volatility Indices (VIX 10, 25, 50, 75, 100). This wont work in FOREX GOLD, EUR-USD. Please test it on Synthetic indices such as Volatility Indices (VIX 10, 25, 50, 75, 100) KEY FEATURES Auto VIX Detection Automatically identifies which VIX index you're trading and applies optimal settings for that specific index. For any further about the indicator kindly contact me here on ht
FREE

Dynamic Candle Countdown
This indicator provides a real-time countdown to the next candle. Unlike standard timers, it positions the label near the current price for better visibility during fast-moving markets. Real-time updates: Uses a 1-second timer event. Dynamic Positioning: Follows the price action automatically. Fully Customizable: Adjust colors, font size, and offsets to suit your chart template. Performance Optimized: Minimal CPU usage.
FREE
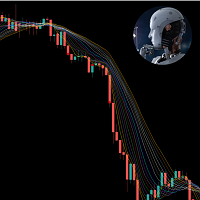
This indicator is very useful in observing the direction of the market. It allows users to enter multiple MA lines with specific display method. In addition, it is also possible to change the candle color same to color of the background of chart, so that we only focus on the MA lines. When a signal appears, represented by a red or green dot, we can consider opening a sell (red dot) or buy (green dot) order. Note: it need to set stoploss at the highest value of MA lines (with sell order) or lowe
FREE

This indicator uses a different approach from the previous version to get it's trendlines. This method is derived from Orchard Forex, and the process of making the indicator is demonstrated in there video https://www.youtube.com/watch?v=mEaiurw56wY&t=1425s .
The basic idea behind this indicator is it draws a tangent line on the highest levels and lowest levels of the bars used for calculation, while ensuring that the lines don't intersect with the bars in review (alittle confusing? I know
FREE

The SyntheticaFX Zones Indicator simplifies the process of identifying key levels in the market where price reversals are likely to occur. By incorporating this tool into their trading strategies, traders can improve their decision-making, enhance risk management, and ultimately increase their chances of success in the financial markets. However, like all technical indicators, it should be used in conjunction with other analysis methods and not relied upon as the sole basis for trading decisions
FREE

STRUCTUREMAP NAVIGATOR MT5 Multi-Timeframe Market Structure Dashboard
TAGLINE
Read the market like a structure trader.
PRODUCT OVERVIEW
StructureMap Navigator MT5 is a multi-timeframe market-structure indicator for MetaTrader 5. It is designed to help traders understand how price is behaving through swing points and structure events rather than relying only on traditional buy/sell arrows.
The indicator analyzes recent swing highs and swing lows, classifies them as HH, HL, LH, or LL, and th
FREE
MetaTrader市场是独有的自动交易和技术指标商店。
阅读MQL5.community用户备忘更多地了解我们提供给交易者的独特的服务:复制交易信号,自由职业者开发的自定义应用程序,通过支付系统完成的自动付款和MQL5云网络。
