Ed Multi Timeframe Dashboard
- 指标
- 版本: 1.7
- 更新: 6 九月 2026

ED Multi-Timeframe Market Bias Dashboard
ED Multi-Timeframe Market Bias Dashboard is designed to give traders a fast and clear overview of market direction across multiple timeframes without having to continuously switch between charts.
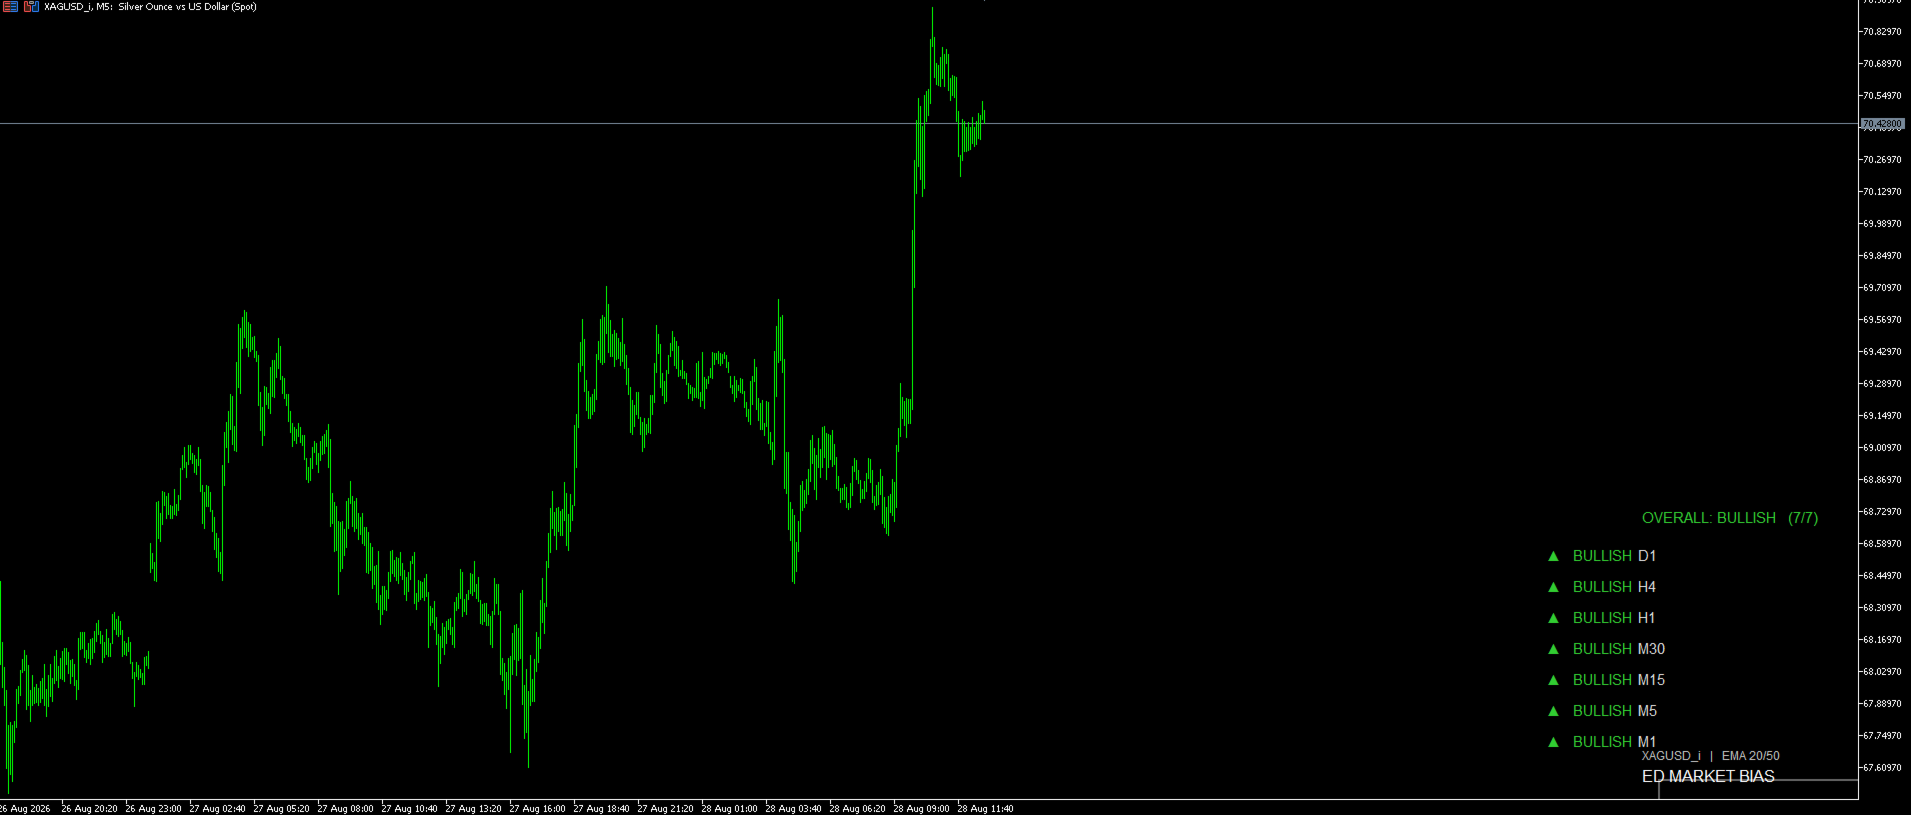
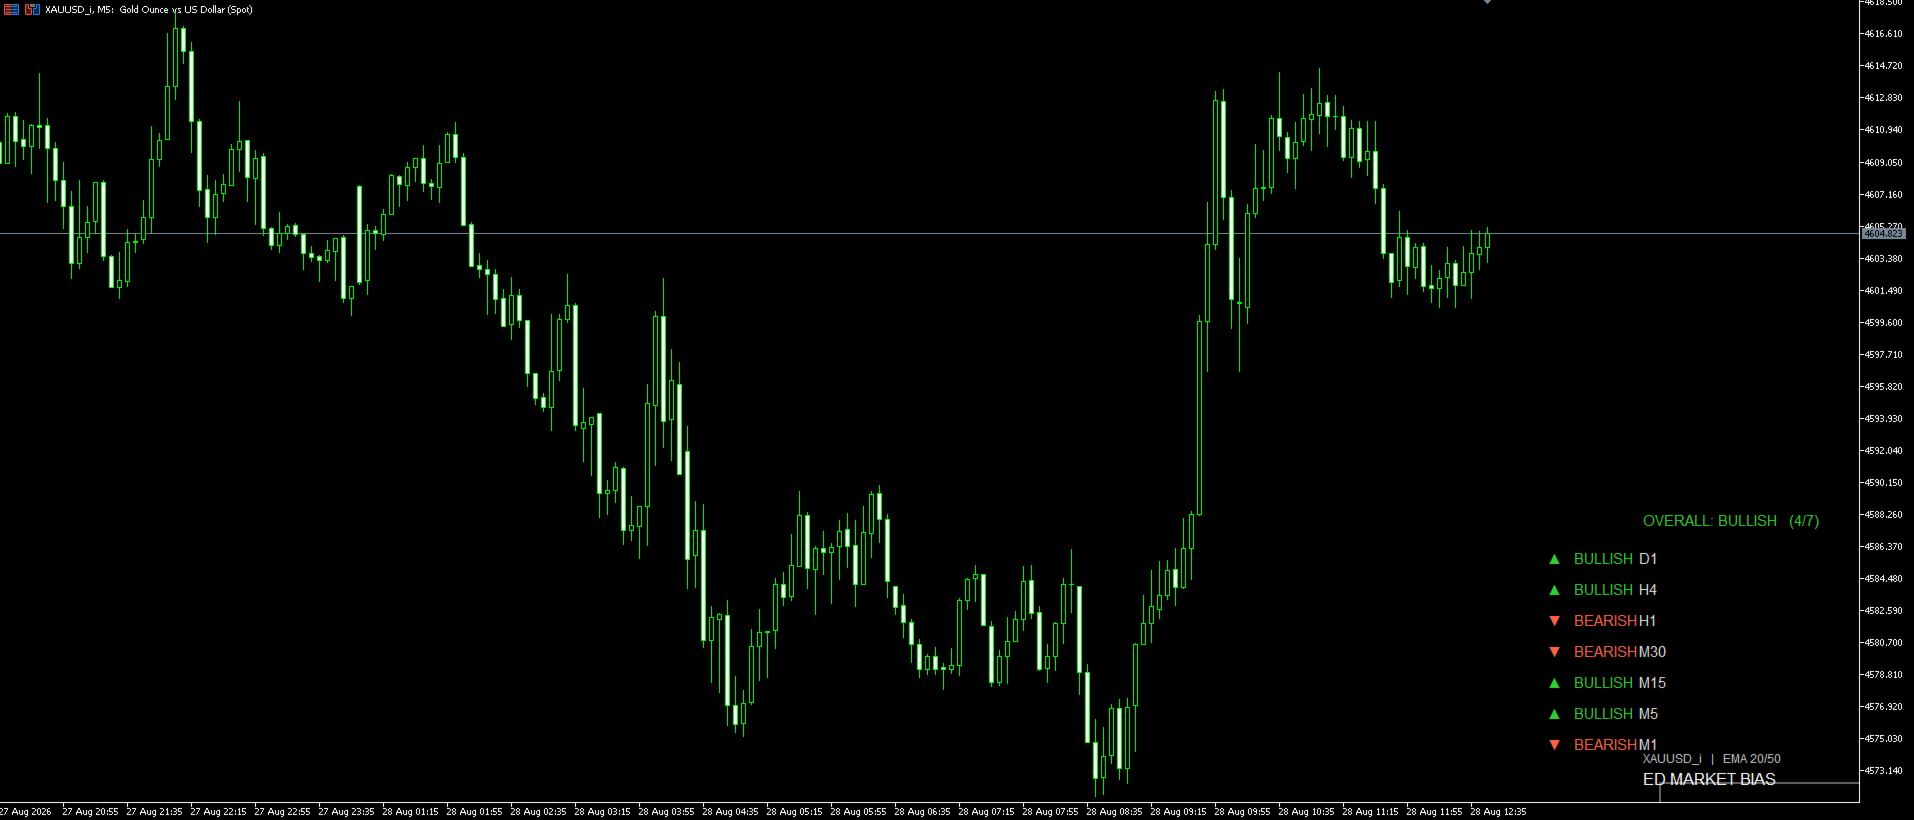
The dashboard analyzes market bias from M1, M5, M15, M30, H1, H4 and D1, displaying each timeframe as either BULLISH or BEARISH.
Market direction is determined using the relationship between the 20 EMA and 50 EMA, providing a simple and consistent method of identifying the prevailing trend on each timeframe.
The dashboard also calculates an Overall Market Bias, allowing traders to quickly see whether the majority of monitored timeframes are aligned bullish or bearish.
Main Features
- Multi-timeframe analysis from M1 to D1
- Clear BULLISH and BEARISH indications
- Overall market bias calculation
- EMA 20/50 trend-based analysis
- Clean and compact dashboard
- Individual timeframe visibility controls
- Adjustable dashboard position
- Automatic dashboard updates
- Designed to reduce unnecessary chart clutter
- Suitable for Forex, metals, indices and other supported MT5 instruments
The indicator can be used as an additional confirmation tool alongside an existing trading strategy. For example, traders can check whether a lower-timeframe setup is aligned with the H1, H4 or Daily market direction before making a trading decision.
ED Multi-Timeframe Market Bias Dashboard does not automatically execute trades and should not be considered a guarantee of future market direction. It is intended as a market analysis and decision-support tool.