 MetaTrader 5
 专家
 指标
 程序库
 实用工具
 窗口小部件
 规则
适用于MetaTrader 5的免费技术指标 - 30
 技术指标的信号外汇和股票市场的开仓交易和平仓交易起着至关重要的作用。指标的本质就是一种交易品种的数学转换,旨在预测未来的价格变化。
测试技术指标可以更有利于预测市场行为并从中获利。
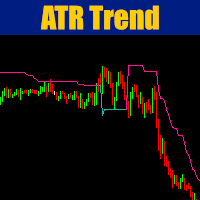
Cybertrade ATR Trend Zone - MT5 The indicator shows, by calculating the ATR (Average True Range), the zone of probable price resistance. Indicated to be used as a probable exit point of an operation.
It works on periods longer than the period visible on the chart. All values are available in the form of buffers to simplify possible automations. This indicator is the same one we use in our EA. Also check out our other products.
FREE

SMC Donchian CandleBlend The SMC Donchian CandleBlend for MetaTrader 5 is a powerful indicator that simplifies your chart analysis by coloring candles based on a fusion of signals from two powerful indicators: the "SMC Donchian Trend Breakout" and the "SMC Donchian Fusion ZigZag". This provides a clear and immediate visual representation of market sentiment, helping you to make more informed trading decisions. Key Features: Fused Signal Logic: The indicator intelligently combines signals from t
FREE

The « Multi-Standard Dev Channel» indicator is based on the statistical concept of linear regression, with Gilbert Raff being the first to implement it as a technical analysis indicator. Basically, it is one of many ways of making future projections based on known past and current data; it also requires that the variables be linearly related, i.e., that changes in the variables remain stable, resulting in a straight line on the plane, hence the term «linear». Advanced users may rightly note th
FREE

Swiss VWAPsimple Motivation Did not find free VWAP that works, the one that I found craseh. So I created a VWAP which calculates values only for the actual day. So computer resouces are not over stressed.
What is VWAP, how is it used? VWAP stands for Volume Weighed Average Price, it calculates the running sum of tick volume and the runnung sum of price times tickvolume. The division of these sums result in a weighed price (Sum P*V/Sum V). The calculation starts normally at midnight. The values
FREE
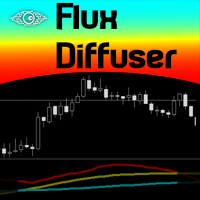
Based on Brazilian trader André Moraes' Difusor de Fluxo theory, the indicator is a more reliable version of the original MACD. It is a great confirmation indicator for Swing Trading and also can be used as a Day Trading tool. If you are not familiar with the concept or André's trading strategies, I strongly recommend his excelent book named "Se Afastando da Manada" in which he explains in detail how this indicator is used. Even if you don't know the Portuguese language it is not difficult to un
FREE

一根大实体蜡烛收盘。看起来像突破。您入场。
下一根K线反转,触发了您的止损。成交量只是平均水平。动能早已衰减。
Impulse Momentum Shift 识别具有真实冲量的K线,并标记冲量反转的时刻。 大多数交易者只看蜡烛大小。真正的冲量由三个因素构成:实体主导性、成交量突破近期均值、以及经ATR标准化的方向性动能。 本指标对每根K线进行三维评分,以5色冲量色阶绘制图表,并在强冲量阶段反转方向的瞬间放置转变箭头——仅在已收盘的K线上触发。 显示内容: 5色冲量K线: 亮蓝色代表强烈看涨冲量,浅蓝色代表适中,灰色代表中性,珊瑚色代表适中看跌,深红色代表强烈看跌。每根K线实时评分0–100 冲量追踪线: 基于ATR的动态追踪线,随主导冲量方向棘轮式移动。趋势结构转变时变色,作为视觉偏向锚点 动能转变箭头: 仅在确认的冲量K线序列反转后触发。无重绘。信号仅出现在完全收盘的K线上 状态标签: 实时显示当前状态——IMPULSE BUY、MODERATE SELL、LOW MOMENTUM——以及百分比评分和追踪线方向 K线倒计时计时器: 当前K线收盘前的剩余时间,显示在图表上 冲量评分机制
FREE

Daily VP Professional – Intraday Volume Profile for MT5 Daily VP Professional is a powerful, institutional-grade Volume Profile indicator built specifically for day traders, scalpers, and market structure analysts on MetaTrader 5. While standard technical indicators rely solely on time-based calculations, Daily VP Professional organizes volume directly by price levels across daily trading sessions. This exposes key institutional accumulation and distribution zones, giving you clear visibility in
FREE

AP VWAP Bands Pro (MT5) Volume-weighted average price with ±σ bands for clear intraday bias, mean-reversion zones, and dynamic support/resistance. Works on crypto (incl. BTC) , FX , indices , and metals . Uses tick-volume when real volume isn’t available. What it shows VWAP line (volume-weighted mean price). Two envelopes around VWAP (default ±1σ and ±2σ) to highlight balance vs. extension. Reset modes : Day , Week , or Anchor Time (HH:MM) to start VWAP where you need it (e.g., exchange open).
FREE
Koryu Delta Koryu Delta 是一款 MetaTrader 5 指标。它利用枢轴点分析和 Delta 交易量数据来识别趋势反转点。它可以检测市场变化形态,并根据市场动态显示信号。此工具可供剥头皮交易、波段交易或长期投资的交易者使用。它可以分析多达 500 条历史K线图来发现过去的形态。它使用闭合K线图逻辑来发出信号。 Koryu Delta 的功能
形态检测:它使用枢轴点分析来识别看涨和看跌的市场变化形态。 Delta 交易量分析:它使用逐笔成交量和K线图结构来显示买入和卖出压力。Delta 显示可以调整。它通过检查形态范围内每根K线图的实体大小、灯芯比和逐笔成交量来计算 Delta。 支撑位绘制:它为检测到的形态绘制支撑位,包括入场位、止损位 (SL) 和三个止盈位 (TP)。可以为每个支撑位设置风险回报率。入场和止损的偏移量可以点数调整。 视觉元素:它使用三角形、支撑位和标签标记形态。它使用圆圈和线条突出显示枢轴点和形态边界。 信号选项:用户可以选择显示看涨信号、看跌信号或两者兼有。 警报:它会发送新形态的推送通知和弹出警报,其中包含入场、止损、止盈位和增量交
FREE

BW Zones Indicator is an indicator for MetaTrader 5 that detects market zones based on AO and AC direction and displays them directly on the price chart: green zone — AO and AC are rising; red zone — AO and AC are falling; neutral zone — AO and AC move in different directions. Chart display: colored bars for zone visualization; up arrow after two consecutive green zones; down arrow after two consecutive red zones. Arrow placement: up signal — below the candle low; down signal — above the candle
FREE

Weekly Fibonacci extension levels projected from the week's open, with clean edge labels and zero per-tick overhead. Every week the market opens with a question: how far can it go? Last week's range is one of the most honest answers you have. TrendSync Weekly Fibo takes that range and projects it from the current week's open as Fibonacci extension levels, above and below, so you know where the week's natural targets and exhaustion zones are before price gets there. No manual drawing. No red
FREE

概述 Multi Timeframe Open Lines是一款适用于MetaTrader 5的轻量级指标,可在当前图表上直接显示所选时间周期的开盘价水平线。 本指标可以显示更高时间周期、更低时间周期以及相同时间周期的开盘价。 例如,可以在H1图表上显示H4和D1的开盘价,也可以在H1图表上显示M15的开盘价。 最多可以同时设置三个时间周期,并且每个时间周期都可以单独配置。 本指标仅用于辅助图表分析。它不会提供交易信号,不会开仓、修改持仓或平仓。 工作原理 每条开盘价线从所选时间周期的开始时间绘制到下一个周期的开始时间。 通过这种分段显示方式,可以清楚地确认每个开盘价所属的时间区间,并查看当前市场价格位于该开盘价的上方还是下方。 本指标也可以显示当前正在形成周期的开盘价,并自动更新显示。 主要功能 最多同时显示三个时间周期的开盘价 支持更高、更低和相同时间周期 可单独启用或关闭每个时间周期 可单独设置每条线的颜色、样式和宽度 可调整历史周期的显示数量 可显示当前周期的开盘价 可使用垂直线连接连续的开盘价水平 在图表右侧显示最新开盘价标签 可调整标签文字大小 可调整刷新间隔 自动使用当前
FREE

Professional Trend ADX Professional Trend ADX 是一款专为 MetaTrader 5 开发的强大趋势强度指标,将经典 ADX(平均趋向指数) 与直观的 Power(动能)/成交量柱状图 相结合。与传统需要在独立指标窗口中分析趋势强度不同,本指标直接在主图中显示 ADX 曲线和 Power 柱状图,使交易者能够更快识别趋势形成、趋势延续以及动能减弱。 该指标特别适合 日内交易者(Intraday Trader) 、 剥头皮交易者(Scalper) 和 短线交易者(Day Trader) ,帮助他们无需在多个指标之间切换,即可快速判断市场走势的强弱。 推荐时间周期 推荐:M5 至 M30 本指标专为短期市场波动设计,在 5 分钟至 30 分钟 时间周期内表现最佳。 虽然更高时间周期同样适用,但其最大的分析价值体现在日内交易中。 工作原理 该指标由三个主要部分组成: ADX 趋势线 橙色 ADX 曲线用于显示当前趋势强度。 曲线上升 = 趋势正在增强 曲线下降 = 趋势正在减弱 与多头(Long)或空头(Short)方向无关 Power / 成交量
FREE

An MT5 divergence scanner that automatically finds divergence / hidden divergence between price and a chosen oscillator , then draws the matching trendlines/channels in the indicator window and can alert you when the line is crossed. Key features (simple) Auto Divergence Detection Bullish divergence : price makes a lower low while oscillator makes a higher low (possible reversal up). Bearish divergence : price makes a higher high while oscillator makes a lower high (possible reversal down). Hidd
FREE
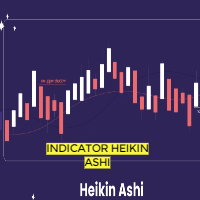
In this indicator, Heiken Ashi candles are calculated with the most optimal method. You can also customize the results by adjusting the amount of period and method input. But the most important advantage of this indicator is the adjustment of the time frame value. You can use this to calculate the Heiken Ashi chandels to See in time frames with lottery in the lower time chart. In this case, you get the best signal to buy or sell using two or more Heiken Ashi indicators with different timeframes
FREE

-- 简单而有效。 反转指标 - 是什么?
一种结合超级趋势逻辑与指数曲线技术的趋势跟随叠加指标。它能识别趋势方向,在图表上绘制动态通道,并在趋势反转时发送实时警报。
工作原理
该指标通过ATR与超级趋势因子计算指数基准线。当价格收盘突破该基准线时,确认趋势反转。绿色箭头标记买入趋势启动,红色箭头标记卖出趋势启动。
功能特性:
基于ATR的指数趋势基准线与动态通道 绿色/红色趋势线及填充通道 趋势反转时的买入/卖出箭头信号 内置警报:弹窗、推送通知、邮件、声音 重复警报防护(每根K线仅触发一次警报) 完全可定制:颜色、线条粗细、箭头尺寸、通道宽度 无延迟的简洁图表叠加层
输入参数:
指数速率、超级趋势因子、ATR周期、通道宽度 开关控制:通道填充、箭头、各警报类型 所有视觉元素支持全色系定制
最佳适用场景:任意品种、任意周期。适用于外汇、指数、大宗商品及加密货币图表。
FREE
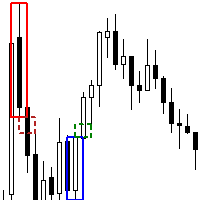
Next Arrival : Flip or Die Trading Arena. Flip a trading account: https://flipordie.com/chapter-1-thirteen-doublings-double-a-trading-account/ The Order Block FVG Box indicator for MetaTrader 5 is a powerful tool designed for discerning traders looking to identify and capitalize on high-probability trading opportunities. This indicator excels at pinpointing valid Order Blocks that are immediately followed by Fair Value Gaps (FVG), enhancing your trading strategy with precise visual cues. Key Fe
FREE
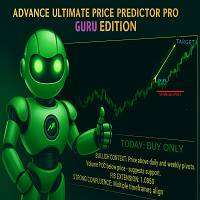
THE ADVANCE PRICE PREDICTOR - GURU EDITION Tired of Guesswork?
Meet the AI-Powered "Almighty Predictor" – Pinpoints High-Probability Targets Before the Move, With Surgical Precision
Stop chasing pips. Start attracting them. Our proprietary algorithm fuses Multi-Timeframe Analysis + Smart Money Concepts + Real-Time Confluence Scoring to give you a clear, calculated edge on every trade.
Are You Constantly Wondering…
"Is this the top, or will it keep going?"
"Where should I real
FREE
FREE
This indicator provides a clear, at-a-glance dashboard for monitoring both the Relative Strength Index (RSI) and Stochastic Oscillator on any instrument or timeframe.
Whenever both RSI and Stochastic %K simultaneously exceed their respective overbought or oversold levels, the indicator displays an arrow signal in the indicator window.
These signals highlight strong momentum and can help traders quickly identify high-probability reversal zones. As with all my free tools, the arrow symbol can be e
FREE

Version 1.5: manual color change added
This indicator helps to trade price action and momentum strategies like Guerrilla Trading or similar strategies.
The indicator displays: most recent highs and lows number of consecutive breaks past breaks of most recent highs and lows retest lines flag formations manual color change User can change colors. Go to Indictor Properties/Input, set "Auto Color" to false and change the colors. Set "Auto color" back to true to go back to pre-set colors. Please wa
FREE

1. Description (The Sales Pitch) Never miss a trade setup again! Timing is everything in forex and stock trading. The Precision Candle Timer for MT5 is a lightweight, professional-grade tool designed to show you exactly how much time is left before the current candle closes. Unlike other clunky timers that clutter your screen, this indicator sits elegantly right next to the current price action, ensuring your eyes stay on the market. Key Features: Real-time Countdown: High-precision cou
FREE

Sentinel Sessions & KillZones 将三大交易时段——亚洲、伦敦和纽约——以简洁、按颜色区分的 区间方框直接绘制在您的图表上,另外还提供可选的 ICT 风格 KillZone 时间窗口,用于伦敦开盘 和纽约开盘。 每个时段都以 GMT 定义,并换算为您经纪商的服务器时间,因此方框会精确落在真实时段开盘和收盘 的位置——无需猜测,也无需在每次更换经纪商时手动调整偏移。您只需告诉指标您的服务器时钟比 GMT 快多少小时(大多数经纪商为 GMT+2 或 GMT+3),一切便会自动对齐。 每个方框都紧贴其时段的真实价格区间:左右两边是时段的开始和结束时间,上下两边则跟踪该窗口内 K 线的最高价和最低价。当前活跃时段的方框会逐根 K 线实时增长,因此您始终能实时看到正在发展的 时段区间。较早的交易日会按您选择的历史深度保留在图表上。 您将看到 亚洲 / 伦敦 / 纽约时段方框,各有自己的颜色 可选的伦敦开盘和纽约开盘 KillZone 方框,用于 ICT 风格的时机把握 每个方框自动捕捉的时段最高价和最低价 为当前正在运行的时段实时增长的方框 每个方框上简洁的名称标签(完
FREE

Sniper ZZ — Precision Entry. Clean Signals.
Sniper ZZ is a lightweight MetaTrader 5 indicator that automatically draws Fibonacci retracement levels 0.382 and 0.618 from confirmed ZigZag swings. No more manual Fibonacci drawing — every time a new swing is confirmed, Sniper ZZ instantly calculates and displays the exact 0.382 and 0.618 retracement levels with price labels.
WHAT MAKES SNIPER ZZ DIFFERENT?
Most Fibonacci indicators alert you on EVERY touch — flooding you with false signals. Snip
FREE

MACD Pro – MACD Indicator for MetaTrader 5 Description
MACD Pro is a Moving Average Convergence Divergence (MACD) indicator for MetaTrader 5. It follows the standard MACD calculation method and displays trend direction and momentum in a separate indicator window. Indicator Elements MACD line based on the difference between fast and slow exponential moving averages Signal line calculated as an exponential moving average of the MACD line Histogram showing the difference between the MACD and signa
FREE

Supertrend with Dual EMA Confirmed is a MetaTrader 5 trend indicator that combines a Supertrend engine with two EMA filters and a multi-candle confirmation rule. Unlike a plain Supertrend that flips between bullish and bearish on every touch, it adds a third state, No Trend, so you can clearly see when the market is trending and when it is just chopping. Features Triple-state trend engine: the Supertrend line is drawn lime in a confirmed uptrend, red in a confirmed downtrend, and grey when there
FREE

EMA Crossover Alert Indicator FREE
Get notified instantly when Fast EMA crosses Slow EMA. Never miss a trend change.
Includes Alert, Push Notification to phone and Email.
FREE, No DLL, Lightweight.
FEATURES: Fast and Slow EMA customizable periods Bullish and Bearish crossover detection Alert + Push + Email notifications Non-repaint, on closed bar Draws both EMAs on chart
INPUTS: Fast EMA, Slow EMA, UseAlert, UsePush, UseEmail
If you like it, please leave a 5-star review!
Lookin
FREE

"If you're using it, give it a rating."
MBFX Timing is a (MetaTrader 5) indicator and it can be used with any forex trading systems / strategies for additional confirmation of trading entries or exits. The MBFX Timing Indicator is a momentum oscillator that tells about the overbought and oversold levels. Like many other oscillators, the Indicator fluctuates between certain levels. These levels are 0 and 100. When the price is near 100, it’s an overbought level, while near 0 signifies an overso
FREE

KAB: A Better Baseline. KAB is an adaptive trend filter designed to track directional movement while actively suppressing abnormal volatility and noise. It behaves like a dynamic moving baseline that automatically adjusts responsiveness to changing market conditions. Unlike fixed moving averages, KAB continuously modifies its internal smoothing rate based on volatility and directional efficiency. The result is a line that tightens during strong trends and stabilizes during unstable or chaotic pr
FREE

Description tab. Másold be ezt a teljes szöveget (angol, ember-hangvétel, nincs AI-klisé):
---
The Fractal Alligator Scanner combines two classic tools that traders have used for years: swing fractals and Bill Williams' Alligator. It does the watching for you and keeps the chart clean.
What it draws:
- An up arrow above every confirmed swing high and a down arrow below every confirmed swing low. A fractal is only marked once the bars to its right have closed, so the arrows do not repaint.
- Th
FREE

If you love this indicator, please leave a positive rating and comment, it will be a source of motivation to help me create more products <3 Key Takeaways Provides both trend and momentum signals in a single view. Entry and exit signals are based on the crossover of the RSI and Signal Line. Market Base Line offers insight into the overall trend direction. Volatility Bands help identify overbought and oversold market conditions.
FREE

Average Volume Smart — Read the Market Before Everyone Else In Wyckoff's method, volume is the soul of the market. It reveals what big operators are doing before price confirms any move. Average Volume Smart was built exactly for that: to give you a clear, immediate, and contextualized reading of volume behavior relative to its own history. What It Is and How It Works The indicator calculates the average volume over a configurable period and compares that value to the current volume, allowing yo
FREE

TWAP/VWAP Indicator - a professional technical analysis tool that displays two important moving averages on the chart: TWAP (Time Weighted Average Price) - calculated as a simple arithmetic average of closing prices over the specified period. VWAP (Volume Weighted Average Price) - calculated using the typical price (high+low+close)/3 weighted by trading volume. Key Features: Dual indicator in one window Adjustable calculation period Clear visualization (blue line - TWAP, red line - VWAP) E
FREE

RBM Volume Ultimate RBM Volume Ultimate is an indicator for MetaTrader 5 that combines buyer and seller financial volume, cumulative delta, daily VWAP and automatic detection of absorption and exhaustion in a single panel. The purpose of the indicator is to give traders a clearer view of buying and selling flow in real time. The histogram separates financial volume between buyers and sellers on a bar by bar basis, making it easier to identify moments when pressure shifts from one side of the ma
FREE

ICONIC TRENDLINE 适用于 MetaTrader 5 标题: ICONIC TRENDLINE:带多周期(MTF)面板与提醒的高级趋势指标 简要说明 还在总是 太晚 识别趋势、并在震荡市里被 假信号 误导吗?MT5 指标 ICONIC TRENDLINE 正是为此而生。它将 智能 EMA 逻辑 与 ADX 趋势强度 结合,提供 清晰、提前、已过滤 的趋势信号。借助 动态趋势线 、 多周期仪表盘 和 即时推送通知 ,你的交易将比以往更 自信 、更 精准 。 指标关键特性 动态变色趋势线 在图表上绘制一条清晰的趋势线,并依据当前方向自动变色: 蓝色: 已确认上升趋势(多头)。 红色: 已确认下降趋势(空头)。 在 中性 阶段,趋势线保持 上一个颜色 ,以避免不必要、易误导的频繁变色(“拉锯/假突破”)。 基于 ADX 的智能趋势过滤(核心) 仅当关键 EMA( 9、21、50 ) 按正确顺序排列 且 ADX 达到 最低强度 (默认 > 20 )时才发出趋势信号。该过滤器能有效排除大多数假信号高发的 弱势/横盘 市场。 多周期(MTF)GUI 面板 一眼把握“大局观”!图表右侧
FREE

大多数零售账户爆仓不是因为入场不好,而是因为手数过大、在震荡中交易以及被忽视的风险。 Risk & Regime Cockpit 把真正保护账户的三件事放进一个始终显示、可自由拖动的面板。无需心算,没有术语,也没有让你盲目跟随的信号。 1. 基于风险的仓位——替你算好。 用百分比设定风险、用 ATR 设定止损;面板即时显示当前品种的精确手数、多空双向的止损和止盈。当手数符合目标风险时变绿;当经纪商的最小手数把风险推高到目标之上时以橙色警告。 2. 用大白话说明市场状态。 基于 ADX,标题栏用清晰语言告诉你当前周期是上涨、下跌还是横盘,以及趋势有多强——无需解读原始数值。 3. 多周期一致性。 M5、M15、M30、H1、H4 和 D1,每个都带彩色箭头,再加一行诚实的总结:全部周期向上、大多向下(4/6)、大多横盘或混合。 4. 实时账户风险守卫。 未平仓头寸、由止损定义的总风险(占账户%)、浮动盈亏,以及大多数工具忽略的两个硬性警告:没有止损的头寸(无限风险,红色显示)以及超过你上限的总风险。 5. 可选的一致性提醒(默认关闭)。 仅当高周期趋势进入一致时才触发提醒。可选终端弹窗、
FREE
SMC Trend Momentum – Adaptive Trend and Momentum Oscillator SMC Trend Momentum is a momentum oscillator plotted in a separate window.
The indicator combines a Donchian position bias with a ZigZag leg normalization and transforms this into a smoothed, color‑coded histogram for assessing trend direction and momentum changes. Optionally, a higher timeframe filter can be applied. The indicator is designed to be flexible for different trading styles (short‑term, swing, indices, FX) using ready‑to‑u
FREE
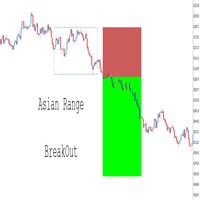
完全可定制 – 通过调整范围时间、颜色、线条样式和风险回报设置,使该指标适应您的个人交易风格。 交易水平可视化 – 根据突破条件自动绘制入场价格、止损 (SL) 和止盈 (TP) 水平。 与智能交易系统 (EAs) 无缝集成 – 通过添加额外的确认信号(如 RSI、均线、结构突破 (BOS) 等)来完全控制您的自动交易策略。您还可以 自定义缓冲区名称 ,以匹配您的 EA 需求,从而实现更大的策略灵活性。 多资产 & 多时间框架回测 – 在 外汇货币对、加密货币及其他交易工具 上测试不同配置,找到最适合您的交易策略的设置。 清晰简洁的界面 – 以非干扰性的显示方式关注价格走势,使交易信号更易于理解。 该指标为交易者提供了 突破策略的坚实基础 ,但其真正的优势在于灵活性。您可以 修改和增强 它,结合额外的指标或逻辑,以适应您的独特交易方法。 试用、回测,并优化它,以匹配您的个性化交易策略! 立即在 MQL5 上获取完整版,让您的交易更进一步!
FREE
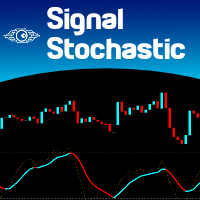
It is the very same classic Stochastic indicator, but with a little twist: we changed the Signal Line with a 2-color line, so we can use it with EAs as a filtering system. And that's it! I know it could seem stupid but I needed that, so I created it. The original formula is right from Metaquote's chest, no additions, no subtractions, it is Stochastics in its core.
So I will not publish here the Stochastics parameters as they are all the same as always... Enjoy!
If you like this indicator, all I
FREE
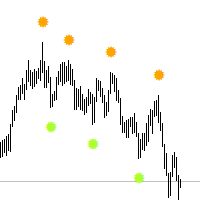
Think of the Super Fractal Indicator as the Bill WIlliams Indicator on Steroids. Indicator Abilities: 1. Adjust Candle around Fractal High or Low. 2. Adjust Lookback period and only plot for a specific number of history candles avoiding cluttering your trading desk. 3. The Indicator uses buffers so you call and use it from any EA.
Note : The higher the candles around Fractal, the stronger the Turning point anfd viceversa is true.
FREE
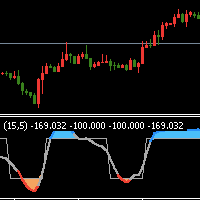
指标简介: 该指标来自网络,相对RSI或CCI更加稳定; 该指标绘制趋势线和高低价格区域,它可以用来分析市场趋势并根据趋势设计新的交易系统; 该趋势指标适用于 M1 及以上时间范围; 指标的简单实用方法:如果指标下跌出现橙黄色区域,则可以选择开多或平仓空头,若指标上涨到蓝色区域,则可以选择开空或平仓多头,当出现上或下箭头信号时候可以开启消息提醒功能,前两个参数框“UpMessages/DownMessages”用于修改邮件消息提醒文字; 需要特别说明的是:任何指标都不是万能的,指标是否有用取决于对指标的使用,而不是试图寻找到一个完美无暇的指标,然后凭借这种指标一劳永逸,那是不可能的。 我的其他指标和 EA 可以在这里找到 : https://www.mql5.com/zh/users/hzx/seller
FREE
MACD with 4-Color Histogram Overview MACD with 4-Color Histogram is a modern upgrade of the classic MACD indicator — redesigned for clarity, precision, and visual power .
It provides instant insight into market momentum , signal strength , and trend reversals using four distinct color zones that make trading decisions faster and more confident. Color Logic Color Condition Interpretation Green MACD > 0, Signal < MACD Bullish momentum strengthening Orange MACD > 0, Signal > MACD Bul
FREE

Coasyn Crown Sweep — Manual Edition Crown Sweep Manual Edition is a market-structure indicator built around an operator-defined Crown Zone . The trader manually marks the two Crown levels. From there, the indicator monitors price interaction with that zone and helps identify the Crown Sweep sequence: Crown Zone → Sweep → Failed Acceptance → Departure → Retest The indicator can display bullish and bearish sweep conditions, failed acceptance, retests, and key alerts while leaving the actual zone
FREE

BrioQuant Anchored VWAP plots the volume weighted average price from a chosen anchor point, with optional standard deviation bands. Alongside the usual calendar anchors it can re-anchor at the start of each trading session. Asia, London and New York each get their own developing VWAP, which resets when that session opens and stops when it closes. The hour inputs match the BrioQuant Trading Sessions indicator, so the two line up on the same chart. Anchor modes Session - Asia, London or New York,
FREE

考拉趋势线升级到1.2版
上一次升级改进:添加了新参数,允许用户将趋势线连接到第二或第三或第X最高或最低点。
我的请求 :
**尊敬的客户,请在Koala趋势线上发布您的评论,让我通过您的反馈进行改进。
为什么科拉趋势线是免费指示器?
我相信免费指标必须是合格的工具。
关于其他免费产品呢?
所有带有绿色考拉徽标的产品都是我的免费产品
https://www.mql5.com/zh-CN/users/ashkan.nikrou/seller#products
考拉趋势线介绍:
我做了这个指标来帮助交易者更好地找到趋势,该指标可以显示当前趋势线。
如您所知,趋势线必须在2个最高点或最低点之间绘制。
因此,主要逻辑是找到最高和最低点。
指标查找历史上所有最高和最低点,并用红色和蓝色点显示它们。
这些最高和最低点是根据深度值计算的。深度值可调,用户可以更改。
深度是什么意思?
当深度为10时,表示每个最高蜡烛必须在其周围的10支蜡烛之间最高,必须在前5个蜡烛与下一个5个蜡烛之间为最高蜡烛。
当深度为10时,表示每个最低蜡烛必须在其周围的10支蜡烛之间最低,必
FREE

Добро пожаловать в новую эпоху торговли с индикатором AI Moving Average, передовым индикатором MetaTrader 5, разработанным для предоставления трейдерам предсказательной информации о движениях рынка. Этот инструмент сочетает в себе мощь ИИ с надежностью экспоненциального скользящего среднего без запаздывания для точных и своевременных прогнозов будущих ценовых тенденций. Инновационная модель линейной регрессии Индикатор AI Moving Average использует модель машинного обучения линейной регрессии для
FREE
Alpha Edge Pro – The Manual Trader’s Edge - If you prefer trading manually without stress, this indicator is for you. Get your copy now. Tired of missing the big moves or holding on to losing trades too long? Alpha Edge Pro is your new secret weapon. This high-performance, plug-and-play MT5 indicator gives you crystal-clear BUY and SELL signals — so you can trade with confidence, precision, and speed. If you prefer manual trading profitably , this indicator is made for you. Alpha Edge Pro does
FREE

Product Name: Auto Trend Pattern Pro [Subho - India] Short Description:
An advanced Price Action tool that automatically detects and draws Trend Channels, Wedges, and Triangles with a live Dashboard. Full Description: Auto Trend Pattern Pro is a sophisticated technical indicator designed for MetaTrader 5. It automates the complex task of drawing Trend Lines and Channels. By analyzing historical price action, the indicator identifies the most accurate "Best Fit" channels for both short-term
FREE

# Account Statistics Pro — 产品描述(中文)
**Account Statistics Pro(账户统计专家)** 是 MetaTrader 5 的多品种账户分析仪表盘指标。它读取您的交易历史,将其转化为一套完整的、机构级的绩效与风险报告,并以快速、完全不透明、可拖拽的面板直接呈现在图表上。
一眼即可看清钱从哪里赚、在哪里亏:按品种、按 EA 魔术号、按小时、按星期、按月份——以及您的真实风险究竟有多深。
---
## 核心亮点
- **绩效核心(CORE)**——余额/净值、净盈亏、盈亏比、胜率、期望值、平均盈亏、盈亏系数、连赢连亏、多空拆分,以及近期日/周/月窗口。 - **排名页(RANK)**——所有品种与所有魔术号策略按净利、胜率、风险调整收益排名,附迷你走势图与单策略详情。 - **时段分析(PERIOD)**——日/周/月盈亏,小时与星期分布,24×7 小时×星期热力图,月度收益热力图,季节性与季度显著性检验。 - **风险实验室(RISK)**——回撤深度/持续/修复,保证金与敞口,账户负载,连续亏损风险,隔夜风险,仓位 sizin
FREE
Stop guessing where the market will turn. Our advanced High/Low Indicator for MT5 is the ultimate tool for mastering price action and identifying key market structure. It automatically scans the chart to identify and clearly plot all critical swing highs and lows in real-time, helping you see the true story behind the candles. These crucial, non-repainting levels form the backbone of any successful trading strategy. Use them to instantly visualize the market's framework, allowing you to pinpoint
FREE

AI Candle Countdown Timer keeps you constantly aware of exactly how much time is left before the current candle closes - plus a live multi-timeframe overview so you always know when every major timeframe is about to print a new bar, all in one clean on-chart panel. KEY FEATURES
- Large, always-visible countdown showing hours:minutes:seconds (or minutes:seconds) remaining until the current chart candle closes.
- Countdown text automatically turns red in the final 10 seconds before close, so you n
FREE

O RBM Volume Real foi desenvolvido para transformar volume em informação útil para tomada de decisão. Em vez de observar apenas a movimentação do preço, o indicador permite identificar quem está dominando o mercado em determinado momento: compradores ou vendedores.
O primeiro dado apresentado é o volume de Compras, que representa a agressão dos participantes que aceitaram pagar o preço pedido para entrar no mercado. Já o volume de Vendas mostra a agressão daqueles que aceitaram vender ao preço
FREE

VolumeBasedColorsBars — Free Powerful Volume Analysis for All Traders
Unlock the hidden story behind every price bar! VolumeBasedColorsBars is a professional-grade, 100% FREE indicator that colorizes your chart candles based on real, adaptive volume analysis. Instantly spot surges in market activity, identify exhaustion, and catch the moves that matter.
This indicator gives you: • Dynamic color-coded bars for instant volume context • Adaptive thresholds based on historical, session-awar
FREE

Risk Reward Ratio Calculator - a free tool that tells you instantly whether a trade is worth taking. Enter your entry, stop-loss and take-profit prices and see the risk/reward ratio, potential loss and potential profit before you open the position. Successful traders only take trades with a favourable reward compared to risk. This calculator draws your entry, stop and target directly on the chart and shows the exact R:R multiple, so you can reject bad setups and size good ones correctly. Feature
FREE

LC Multi Session VWAP 全球金融市场会随着交易时段从 Asia 转换到 London ,再进入 New York 而不断变化。每个交易时段都有其独特的价格行为、流动性特征和市场平衡。 LC Multi Session VWAP 的设计目标是清晰地展示这些差异。与使用贯穿全天的单一 VWAP 不同,本指标为每个主要交易时段分别计算独立的 Volume Weighted Average Price (VWAP) 。 可分别显示以下交易时段的 VWAP: Asia London New York 因此,每个交易时段都可以独立分析,帮助交易者更轻松地比较一天中不同阶段的市场变化。 可选的 Sigma Bands 显示价格与当前交易时段 Fair Value 之间的距离,为市场分析提供更多参考信息。 专为日内交易者设计 本指标特别适合希望观察以下内容的交易者: 每个交易时段的 Fair Value 全球交易时段之间的切换 价格相对于 VWAP 的位置 趋势市场与平衡市场 围绕 Fair Value 的价格扩张与回归 LC Multi Session VWAP 专注于市场分析,
FREE
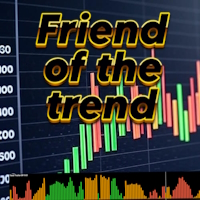
Friend of the Trend: Your Trend Tracker Master the market with Friend of the Trend , the indicator that simplifies trend analysis and helps you identify the best moments to buy, sell, or wait. With an intuitive and visually striking design, Friend of the Trend analyzes price movements and delivers signals through a colorful histogram: Green Bars : Signal an uptrend, indicating buying opportunities. Red Bars : Alert to a downtrend, suggesting potential selling points. Orange Bars : Represent cons
FREE

Pivot Point Super trend it can be used to catch price turning points and can show arrows for buying and selling. calculations are based on price peaks . you can control the price turning points by increasing the Pivot point period input on the indicator the ATR factor is for how far apart do you want the bands to be spread apart price break outs are also spotted in their early stages which will make trading much better
FREE

The true strength index is a technical indicator used in the analysis of financial markets that attempts to show both trend direction and overbought/oversold conditions. It was first published William Blau in 1991. The indicator uses moving averages of the underlying momentum of a financial instrument. The True Strength Index (TSI) is a momentum oscillator that ranges between limits of -100 and +100 and has a base value of 0.
FREE

SmartWaterMark Essential 是一款适用于 MetaTrader 5 的轻量级水印指标。
它可以在图表中央显示清晰、简洁的交易品种水印,帮助您快速识别当前图表正在查看的交易品种。对于同时使用多个图表、多个品种或多个时间周期的交易者来说,这可以让工作区更加整洁,也能减少切换图表时的识别错误。
功能: - 居中的交易品种水印 - 可在基于时间的图表上选择显示时间周期 - 支持显示交易品种描述 - 提供基本的文字颜色、透明度和字体自定义
SmartWaterMark Essential 专为日常图表管理而设计,设置简单,视觉风格低调,不会干扰价格走势阅读,同时让图表信息更加清楚。
简洁、清晰,并且适合日常图表整理。适合日常使用。
FREE

Draw Order Blocks – Channels and Market Structure Manual
-A simple tool for drawing precise channels on Order Blocks or any area you choose. It offers three drawing modes: full candle, wick only, or body only, each with a 50% level. It also includes "BOS" and "CHoCH" lines with two-level confirmation: one checkmark on wick break and two checkmarks on candle close-
FREE

GUARDIAN: The Ultimate Trend & Security Indicator GUARDIAN is a sophisticated technical analysis tool designed for traders who prioritize precision and capital preservation. This indicator acts as a vigilant protector of your trades, filtering market noise and identifying high-probability trend reversals with institutional-grade accuracy. Core Features: Adaptive Trend Detection: Utilizes advanced algorithms to detect market shifts before they become obvious. Smart Risk Management: Built-in signa
FREE

Read Manual Setup Guide Apex Institutional Edge is a high-performance technical analysis indicator for MetaTrader 5 that automatically identifies and tracks Supply and Demand zones across all markets and timeframes. Designed with optimized native MQL5 engineering , the indicator detects institutional-style price imbalances and displays them as clean, easy-to-read zones directly on your chart. Key Features • Automatic Supply and Demand zone detection
• Multi-Timeframe (MTF) zone overlay
• Fresh a
FREE
Market Structure Shift with FVG Indicator for MT5 This MT5 indicator from the apexfintech.net suite identifies market structure shifts and fair value gaps (FVGs) to provide traders with potential trading opportunities. It alerts users on these events via mobile notifications, enabling them to react quickly to changing market conditions. Key Features: Market Structure Shift Detection: Identifies bullish and bearish market structure shifts based on swing high/low breaks and significant candl
FREE

Price Predictor Pro Turn Market Patterns into Predictable Profits!
Are you tired of guessing where the market will go next? With Price Predictor Pro , you’ll trade with confidence by spotting powerful chart patterns and receiving precise price projections —directly on your MT5 chart.
What Price Predictor Pro Does: ️ Detects high-probability chart patterns like Double Tops, Double Bottoms, Head & Shoulders, Flags, Pennants, and more . ️ Instantly projects the next price target using adv
FREE

Important Reminder: If you find this tool helpful , please support the work by leaving a comment or rating .
Avoid using it without showing support. Your feedback motivates further development! Trend Vision - SuperTrend PRO Take your trading to the next level with a powerful upgrade to one of the market’s most trusted trend-following indicators! SuperTrend PRO has been optimized to deliver precise signals based on the strength of the ATR, with smart alerts sent instantly to your phone wh
FREE

Fibo Zones Manual — Manual Fibonacci with Buy/SL/TP Zones
Fibo Zones Manual is a fully manual Fibonacci tool — drag the two points to your swing high/low, exactly like the native MT5 Fibonacci retracement. On top of it, the indicator draws three colored zones directly on the chart: entry zone (Buy/Sell), SL zone, and TP zone, each with the exact price displayed.
Key Features
• Manual placement, drag-and-drop like the native tool • Colored zones (entry, SL, TP), fully adjustable • Price and pe
FREE

Read detailed blogpost with screenshots here: https://www.mql5.com/en/blogs/post/770947
Features at a Glance One-click symbol change across all charts simultaneously One-click timeframe change across all charts simultaneously Live trade status on every pair button — buy/sell counts, profit/loss coloring Pending order indicators shown separately on buttons Panel background color changes with your overall profit or loss Sync panel position across all charts Sync the number of buttons per row acro
FREE

"Candlesticks MTF 5" is an informational indicator that displays "Japanese Candlesticks" . The indicator analyzes and determines the opening and closing times of candles from higher time frames.
An algorithm has been developed for the "Candlesticks MTF 5" indicator that corrects the discrepancy between the opening and closing times of candles from higher time frames. For example, if the opening time of a candle on a weekly time frame is the 1st of the month, and on the smaller time frame this
FREE

MTF RSI Fusion Basic 是 MetaTrader 5 振荡器,将一个基础相对强弱指数(RSI)与最多两个可选 RSI 来源组合。每个来源可设置时间周期、计算周期和应用价格,两个附加来源各自具有权重和组合模式。 指标显示 Fusion RSI 曲线、基于平均真实波幅(ATR)的动态超买和超卖区域,以及可选的快慢移动平均线。均线可在指标窗口中基于 Fusion RSI 绘制,也可在主图中基于价格绘制。功能不包括背离检测、买卖信号、趋势方向着色或成交量加权平均价格(VWAP)振荡器。 RSI1 Period、RSI2 Period、RSI3 Period 默认分别为 7、14、28,三个来源初始均使用当前图表周期。Enable RSI2 和 Enable RSI3 控制附加来源;RSI2 Weight 和 RSI3 Weight 控制其贡献。组合模式包括 ADD、SUB、AVG、ADDSUB、SUBADD。Clamp output to 0..100 将结果限制在 0 至 100。 Enable Dynamic OB/OS、OB/OS Timeframe、ATR Lengt
FREE
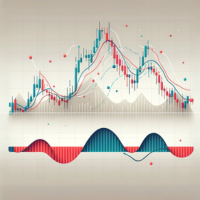
Divergence Force 背离指标 描述 Divergence Force 是一个旨在识别资产价格与MACD(移动平均收敛/发散)之间背离的指标。此指标自动绘制价格和MACD的高点和低点上的趋势线,突出潜在的交易机会。 主要功能 自动识别背离 :该指标自动检测价格与MACD之间的看涨和看跌背离。 趋势线跟踪 :自动绘制价格的连续高点和低点上的趋势线,并与MACD的高点和低点进行比较。 买入和卖出信号 :在图表上清晰显示买入("Buy")和卖出("Sell")信号,当检测到背离时显示。当未检测到背离时显示"Neutral"。 标准MACD参数 :使用标准的MACD参数(12, 26, 9)进行计算,确保结果可靠和被认可。 兼容不同时间框架 :优化为在1小时时间框架上运行,但可以根据用户的偏好应用于其他时间框架。 使用方法 安装 :将指标添加到MetaTrader 5平台的 Indicators 文件夹中。 应用到图表 :将指标加载到所需的图表中。该指标将自动开始绘制趋势线并识别背离。 信号解释 : Buy :当检测到看涨背离时,指标将显示"Buy"信号。 Sell :当检测到
FREE
您知道为什么MetaTrader市场是出售交易策略和技术指标的最佳场所吗?不需要广告或软件保护,没有支付的麻烦。一切都在MetaTrader市场提供。
