 MetaTrader 5
 专家
专家 指标
指标 程序库
程序库 实用工具
实用工具 窗口小部件
窗口小部件 规则
规则适用于MetaTrader 5的免费技术指标 - 38
 技术指标的信号外汇和股票市场的开仓交易和平仓交易起着至关重要的作用。指标的本质就是一种交易品种的数学转换,旨在预测未来的价格变化。
测试技术指标可以更有利于预测市场行为并从中获利。
技术指标的信号外汇和股票市场的开仓交易和平仓交易起着至关重要的作用。指标的本质就是一种交易品种的数学转换,旨在预测未来的价格变化。
测试技术指标可以更有利于预测市场行为并从中获利。 
SMART ZONES is an advanced institutional indicator for MetaTrader 5 designed for traders who want to identify real market decision zones with precision and clarity. The indicator automatically plots: Previous day high Previous day low 50% range level POC (Point of Control) based on highest traded volume Main institutional value zones SMART ZONES helps traders identify: liquidity areas institutional defense zones possible reversals true breakouts market balance levels price acceptance and rejecti
FREE

Trading Dashboard FULL - Real-Time Performance & Analytics Calendar Trading Dashboard FULL is an advanced, interactive visual analytics tool for (MT5). Designed for serious traders, prop firm challenge takers, and portfolio managers, this indicator converts your raw trading history into a clear, comprehensive monthly calendar and real-time statistics dashboard right on your main chart window. No more switching between account tabs or downloading report files to analyze your trading performance.
FREE
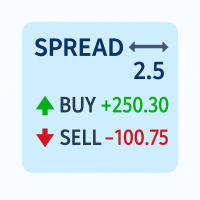
Track your spread and all position PnLs (Buy & Sell) in real-time – stay in control of your trades at a glance!
Features: Real-time spread display (in pips) Total Buy position PnL Total Sell position PnL Clean, non-intrusive display layout Works with all symbols and timeframes Perfect for: Scalpers needing quick spread awareness Day traders monitoring long/short performance Risk managers optimizing exposure No need to switch tabs or rely on external tools — everything you need is visible at
FREE

The Scaled Awesome Oscillator (SAO) represents a refined adaptation of the Awesome Oscillator, aimed at establishing consistent benchmarks for identifying market edges. Unlike the standard Awesome Oscillator, which records the variation in pips across different commodities, the only unchanging reference point is the zero line. This limitation hampers investors and traders from pinpointing specific levels for trend reversals or continuations using the traditional Awesome Indicator, a creation of
FREE

The CSI Currency Strength indicator ranks all ten G10 currencies by momentum strength using a multi-lookback Z-score model, displayed as a live on-chart panel. Attached to any chart, it runs independently of the chart's symbol or timeframe. The methodology follows the multi-horizon momentum framework from Asness, Moskowitz & Pedersen (2013), applied cross-sectionally to G10 currencies. Rather than comparing a single bar against the previous close — which introduces a cliff-edge artifact at each
FREE

Breakout Monitor is a powerful trading tool designed to track price action within your custom-drawn zones. Simply draw a rectangle on your chart to define your consolidation or key levels, and the indicator will do the rest. It highlights the price range clearly and monitors it in real-time, ensuring you never miss a significant market move. When the price breaks through your defined boundaries, the indicator sends an instant Push Notification directly to your mobile phone in a clear, actionable
FREE
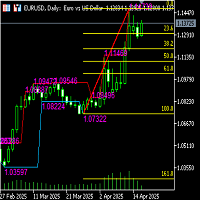
自动斐波那契线指标(含高低通道线)功能说明 功能简介 本指标结合自动识别的波段高低点,自动绘制斐波那契回撤/扩展线,并配合绘制当前分析区间的最高价与最低价通道线,为交易者提供更清晰的支撑/阻力参考与趋势分析依据。 主要功能 自动波段识别 程序根据预设算法Fractal 高低点)识别关键波段; 选取最近一个明显高点与低点作为绘制基础; 无需手动干预,自动更新。 斐波那契回撤/扩展线绘制 自动计算以下常用比例:0%、23.6%、38.2%、50%、61.8%、100%、161.8% 等; 对每一水平绘制水平参考线,标注数值; 高低通道线绘制 在选定的计算区间内自动绘制“最高价线”和“最低价线”价格标签; 显示当前区间内的价格通道宽度,便于判断价格是否处于突破/震荡阶段。 自动更新与多周期适配 指标随行情自动刷新; 可用于任何时间周期(如1分钟至周线); 保持图表整洁,适应短线与波段策略。 图表友好设置 支持自定义线条颜色、透明度、样式; 技术参数 区间长度: 指定显示价格标签K线数量 应用场景 趋势行情中预测回调/反弹区; 判断价格是否突破关键比例位; 配合价格通道识别震荡
FREE

This indicator automatically draws horizontal lines at 00s, 20s, 50s and 80s levels. If you trade ICT concepts and are an ICT Student, then you know that these levels are used as institutional support/resistance levels and/or fibonacci retracement anchor points. Features
Draws horizontal lines at 00, 20, 50 and 80 levels above and below current market price . Choose the amount of levels to show on chart Customizable line colors Recommended for forex currency pairs. Saves time looking for thes
FREE
As the suggested, with this indicator you are able to switch from one symbol or timeframe to another in the same single chart. So forget about opening tons of chart on your screen! It's not designed for ICT or SMC trader, but if you are that kind of trader you still can use it. Imagine you have a strategy containing various indicators and settings, on a single chart you can screen the entry opportunity then move to the next symbol or timeframe.
FREE

The purpose of using Smart money index (SMI) or smart money flow index is to find out investors sentiment. The index was constructed by Don Hays and measures the market action. The indicator is based on intra-day price patterns. The beginning of the trading day is supposed to represent the trading by retail traders. The majority of retail traders overreact at the beginning of the trading day because of the overnight news and economic data. There is also a lot of buying on market orders and shor
FREE

The Kalires Channel Indicator is a technical indicator used to evaluate trend direction and potential trading opportunities. This is a hybrid indicator that combines Kauffman Adaptive Moving Average (KAMA), linear regression and smoothing. The Kalires Channel Indicator consists of two lines: one central and two outer bands. The central line is a smoothed KAMA modified according to the direction of the trend. The outer bars represent two linear regression lines drawn above and below the center l
FREE
Hi Traders, The Volume Spike Alert Indicator is a lightweight, non-lagging tool designed to help traders identify unusual volume activity in real time. This indicator calculates the average tick volume over a user-defined number of previous bars and compares it with the current candle’s volume. When the current volume exceeds the average by a specified percentage, the indicator triggers alerts, allowing traders to quickly spot potential breakouts, institutional activity, or strong market interes
FREE

Analyze 8 timeframes simultaneously on a single screen! AURA Lite delivers real-time trend confluence data (Trend, Momentum, ADX, and ATR). Eliminate chart-hopping and streamline your technical analysis. 100% FREE! "Simplify your trading, maximize your profits, and eliminate emotional errors by combining this tool with [ Aura Trade Assistant Pro ] AURA MULTI TIMEFRAME BIAS MATRIX (LITE VERSION) Streamline your technical analysis workflow. AURA is an advanced technical scanner designed to give
FREE

Prop Risk Meter – 为 Prop Firm 交易者打造的免费回撤仪表盘。Prop Risk Meter 是面向自营交易公司(Prop Firm)和资金账户交易者的免费只读回撤仪表盘与风险面板,实时监控每日亏损、每日回撤和净值回撤 — 适用于 FTMO、FundedNext、Funding Pips、The5ers、E8 及任何资金账户。 在您的图表上实时显示: - 今日亏损对照您可配置的每日亏损限额(金额、已用百分比、信号灯进度条) - 从净值峰值起的当前回撤,对照您的最大回撤限额 - 以账户货币显示的剩余每日缓冲 - 总持仓手数与持仓数量 - 清晰的状态判定:OK · NEAR LIMIT(默认 80%)· OVER LIMIT 设计上即为只读。本工具以指标形式构建。MQL5 中的指标无法发送、修改或关闭订单——这是技术属性,不是承诺。Prop Risk Meter 只显示您的数字;它绝不触碰您的交易,绝不索取密码,不使用 DLL,不发起任何网络请求。 为什么免费?交易者失去资金账户最常见的原因不是策略差,而是没看到每日亏损限额逼近就已越线。这个面板让这段距离时刻可见
FREE

Versión Beta El indicador técnico Non Lag MA MTF (Non-Lagged Moving Average Multi-Time Frame) es una versión avanzada del Non Lag MA que permite visualizar la media móvil en varios marcos temporales simultáneamente. Pros: - Visión integral: Proporciona una visión más completa al mostrar la media móvil en diferentes marcos temporales en un solo gráfico. - Anticipación de tendencias: Ayuda a anticipar cambios de tendencia al observar la convergencia o divergencia de las medias móviles en distint
FREE

1. Description (The Sales Pitch) Never miss a trade setup again! Timing is everything in forex and stock trading. The Precision Candle Timer for MT5 is a lightweight, professional-grade tool designed to show you exactly how much time is left before the current candle closes. Unlike other clunky timers that clutter your screen, this indicator sits elegantly right next to the current price action, ensuring your eyes stay on the market. Key Features: Real-time Countdown: High-precision cou
FREE

//////////////////////////////////////////////// //////////////////////////////////
An improved version of the standard Bulls Power and Bears Power indicators.
Now it's two in one.
The setup is simple - you just need to specify the period. It is also very easy to understand the readings of this indicator, a signal above zero is a buy, and below it is a sell.
//////////////////////////////////////////////// ///////////////////////////////////
I hope this indicator will be very useful to you
FREE

This is our version of the Bull Market Support Band indicator.
This indicator contains two moving averages: one simple and one exponential. Together, they represent a support band that can be used in both bull and bear markets.
Although originally designed for the weekly chart, it can be used on any timeframe.
Our version adds a candle coloring rule: green for closes above the band and red for closes below.
The default value is 20 for the Simple Moving Average (SMA) and 21 for the Exponentia
FREE

Candle size oscillator is an easy to use tool to figure out candle size from highest to lowest price of each candle. It's a powerful tool for price action analysts specifically for those who works intraday charts and also a perfect tool for short term swing traders. Kindly note that you can also edit the Bullish and Bearish candles with different colors.
#Tags: Candle size, oscillator, price action, price range, high to low, candle ticks __________________________________________________________
FREE

Santa Donchian Indicator is an efficient way to detect support, resistence and break outs in any market.
The Donchian channel measures the high and the low of a previously defined range. Typically, a trader would look for a well-defined range and then wait for the price to break out to either one side for a trade entry trigger. Advantages Never repaints, never backpaints, never recalculates. Works in all symbols and all timeframes. Perfect trend filter for any strategy or expert advisor. Full
FREE
The Sessions and Bar Time indicator is a professional utility tool designed to enhance your trading awareness and timing precision on any chart. It combines two key features every trader needs — market session visualization and real-time bar countdown — in one clean, efficient display. Key Features: Candle Countdown Timer – Shows the remaining time before the current candle closes, helping you anticipate new bar formations. Market Session Display – Automatically highlights the four main trading
FREE

SmartRSI Pro – 智能交易者的智能RSI信号指标
SmartRSI Pro 是一款基于RSI的下一代指标,旨在为交易者提供清晰、可靠且可操作的买入/卖出信号,直接显示在图表上。该工具基于流行的相对强弱指数(RSI),加入了智能逻辑以过滤市场噪音,减少错误信号——适合初学者和高级交易者。 主要功能:
自动买入/卖出箭头
基于自定义RSI阈值,清晰可见的上下箭头(无重绘)。 带重置逻辑的智能信号过滤器
仅在RSI重置时激活信号,避免过度交易和噪音。 可定制的RSI参数
选择RSI周期、水平,甚至时间框架——根据您的策略调整。 极简设计
无杂乱、无干扰——只有精准的箭头信号和一个干净的标签。 适用于所有符号和时间框架
完美支持外汇、指数、金属、加密货币等——从M1到日线。 工作原理:
买入信号:当RSI跌破买入水平(例如30)时触发。 卖出信号:当RSI突破卖出水平(例如75)时触发。 ️ 重置逻辑:确保只有在RSI回归至重置水平之后才产生新的信号。 箭头位置:可自定义箭头偏移以适配您的图表风格。 ️ 输入参数: 参数
FREE
Rinse and Repeat indicator for 3 day/session/week setups. Check out our other products for fxer.net:
https://www.mql5.com/en/market/product/114888
https://www.mql5.com/en/market/product/114890
Indicator daily features: Daily close/high/low Weekly open/high/low/close Month open/high/low/close Daily breakouts Daily failed breakouts Asia/London/New York sessions Inside days Outside days Green days Red days
Indicator weekly features:
Weekly breakouts Week dividers Indicator other features: Das
FREE

BluePrint Adaptive Trader - Professional Trading System Advanced Channel Trading System based on our proprietary TrenderFlex PRO algorithm Learn more about TrenderFlex PRO KEY FEATURES • TrenderFlex PRO Channel Technology - Advanced channel calculation based on our proven algorithm
• Adaptive Risk Management - Automatic TP/SL calculation based on channel width
• Win Rate Statistics - Real-time tracking of TP1, TP2, TP3 success rates
• Multi-Timeframe Analysis - Monitor 7 timeframes simultaneou
FREE

Floating Live Price Line is a lightweight MetaTrader 5 indicator that displays a real-time horizontal line at the current market price along with a floating price label. The label automatically follows the latest Bid or Ask price and stays positioned on the right side of the chart, making it easier to monitor live price movement without relying on the price scale. Designed for traders who prefer a clean and professional chart, this indicator provides instant visual reference for the current mark
FREE

Candle Timer displays a live countdown timer showing exactly how much time remains before the current candle closes. It updates every 500 milliseconds, giving you a near-real-time readout directly on your chart — no more guessing when the next bar will form. Key Features & Advantages Two flexible display modes Corner Overlay — pins the timer to any corner of your chart screen (top-left, top-right, bottom-left, bottom-right), staying fixed as you scroll or zoom. Ideal for keeping the timer always
FREE

The concept is simple: Plotting Price behavior within several periods of time. Some Symbols behave very well during the trading day - with this I mean Intraday trading - and this behavior ends up plotting effectively well with the proposed Exponential Moving Averages in this indicator... Obviously that this behavior could not be seen in all Symbols, but you can give it a try... Just drop this indicator in a chart and you will see for yourself...
This indicator is intended for "Feeling the Trend"
FREE

If you love this indicator, please leave a positive rating and comment, it will be a source of motivation to help me create more products <3 How to use Slope Direction Line Uptrend: When the SDL line slopes up and turns from red to green, it shows that the price is trending up. This is also considered a buy signal. Downtrend: When the SDL line slopes down and turns from green to red, it shows that the price is trending down. This is also considered a sell signal. Sideways: When the SDL line mo
FREE

TK - Rainbow 指标 描述: TK - Rainbow 指标是一个强大的技术分析工具,旨在通过多条线的方式提供市场趋势的清晰视图。通过30条计算不同周期的线,它提供了广泛的价格运动分析。该指标使用双色方案来突出显示上升和下降趋势,使市场状况一目了然。 主要特点: 30条线: 每条线代表不同的平滑周期,以涵盖广泛的市场趋势。 双色方案: 使用两种颜色区分上升(冷色)和下降(暖色)趋势。 可定制设置: 调整线宽、样式和步长以适应您的交易偏好。 如何使用 TK - Rainbow: 应用指标: 从 MetaTrader 5 的指标列表中将 TK - Rainbow 指标添加到您的图表中。 配置参数: 步长 (inpStep): 定义每条线之间的周期增量。调整此设置以设置线条间距。 价格 (inpPrice): 选择用于计算的价格类型(例如,收盘、开盘、最高、最低)。 线宽 (inpLinesWidth): 设置线条的厚度以提高清晰度。 线样式 (inpLinesStyle): 选择线条的样式(例如,实线、虚线)。 解读颜色: 上升趋势: 冷色(蓝色)的线条表示上升趋势。 下降趋势:
FREE

ForexFanclub(FFC) : For detailed instructions and our official website, please visit my profile ! InteractiveMA: Real-Time Moving Average Control Stop wasting time opening settings dialogs just to tweak your Moving Average. InteractiveMA puts complete control of your trend analysis directly at your fingertips, allowing you to cycle through MA types and periods instantly on the chart. Whether you are a scalper needing rapid adjustments or a long-term trader refining your entry, this tool makes yo
FREE

RaysFX Pattern Detector è uno strumento di analisi tecnica all'avanguardia progettato per i trader che basano le loro decisioni sull'azione dei prezzi (Price Action). Questo indicatore scannerizza automaticamente il grafico in tempo reale per identificare e segnalare i pattern candlestick più affidabili e noti, eliminando il lavoro manuale e aiutandoti a non perdere mai un'opportunità di trading. Che tu sia un trader discrezionale, un principiante che sta imparando a riconoscere le candele, o un
FREE

DEAR USERS?! PLEASE GIVE THIS ITEM YOUR FAIR AND HONEST REVIEW?! Thank you!
️ THE ALPHAQUANT ADVANTAGE: BUILT FOR PROP FIRMS and LIVE ACCOUNTS Most standard dashboards only show you the profit and loss of individual EAs. AlphaQuant goes further to protect your funded accounts: True Account-Level Drawdown Tracking: Prop firms do not care about an individual EA's drawdown; they care about your total account drawdown. AlphaQuant tracks your account's highest equity peak and calculates your true,
FREE

ICT Levels Pro is a complete multi-timeframe levels indicator for MT5, built for traders who follow ICT methodology. Every key level is plotted automatically and labeled clearly — Daily, Weekly, Monthly, ADR, AWR, and Open Range — all in one indicator with full individual control over every single line.
DAILY LEVELS
- PDH — Previous Day High - PDL — Previous Day Low - DO — Daily Open - TDO — True Day Open (NY midnight price)
FREE
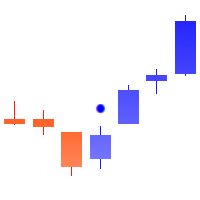
修正突破是一个强大的工具,可以根据对价格形态和价格走势惯性的分析,从修正或交易走廊中检测可能的突破点。
_________________________________
如何使用指标信号:
指标在当前价格柱期间产生信号。 建议在关闭信号箭头上方/下方的信号栏后使用生成的信号。 指标不重绘其信号。
_________________________________
指标参数建议更改信号箭头的显示样式。 不提供更改用于计算的参数-这是由于我的产品的哲学:稳定性和客观性。
_________________________________
欢迎您的任何问题和建议,可以私信发送
_________________________________
提前感谢所有有兴趣的人,祝你好运征服市场!
FREE

Ritz MOVAR ALL Filter Ritz MOVAR ALL Filter is a professional multi-timeframe moving average filter designed to help traders clearly identify trend direction, bias, and momentum across all trading instruments. This indicator supports a wide range of advanced moving average algorithms — including Super Smoother, Hull MA, Zero-Lag, ALMA, T3, VWMA, and more — combined with flexible price source modes for precise market filtering. The color-coded line dynamically reflects trend state changes , makin
FREE
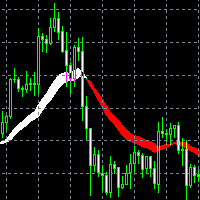
Индикатор Trade in trend предназначен для торговли по тренду. Сила тренда определяется шириной линии. Узкая линия - начало или конец тренда. Широкая линия свидетельствует о высокой силе тренда. Резкая смена ширины линии свидетельствует, с большой вероятностью, об окончании тенденции. Сигналы индикатора Не против покупки: переход с красной линии в белую цена отразилась от белой линии индикатора цена находится выше белой линии индикатора Не против продажи: переход с белой линии в красную цена отр
FREE

1. Overview Thank you for choosing the SuperTrend Suite for MT5. This package provides a set of powerful tools for trend analysis, designed to integrate seamlessly into your MetaTrader 5 platform. This suite includes two components: SuperTrend Indicator : A robust trend-following indicator that displays the current market trend directly on your chart, complete with entry signals and alerts. SuperTrend Screener EA : A multi-symbol dashboard that scans a user-defined list of instruments in the bac
FREE
Este indicador foi desenvolvido para auxiliar na tomada de decisão em operações de compra e venda. Ele realiza uma análise minuciosa baseada em um cálculo complexo que leva em conta múltiplos fatores do mercado. A partir dessa análise, o indicador gera um ponto visual que representa, de forma clara e objetiva, a direção sugerida – seja de entrada ou saída de uma posição. Sua principal função é fornecer ao trader uma leitura simplificada de dados sofisticados, facilitando o entendimento do moment
FREE

产品名称: 黄金形态面板 产品描述: 黄金形态面板是一款多信息综合显示工具,用于展示多周期的趋势强度、动态支撑阻力位、K线形态识别结果以及市场情绪数据。 核心功能: 趋势强度条
结合 EMA20 与 RSI,生成 0–100% 的趋势强度数值,分别计算 M1、M5、M15、M30、H1、H4 六个周期。通过聚合算法将各周期强度汇总为一条多空能量条,便于快速判断市场主要方向。 动态枢轴系统
基于历史最高价、最低价和收盘价,自动计算枢轴点(P)及支撑阻力位(S1–S3、R1–R3)。在图表右侧生成可调节偏移量的水平线段,提示潜在的价格波动边界。 K线形态扫描
实时识别最新 K 线的常见形态,包括十字星、锤头、吞没形态、大实体等。识别结果以冷色(看跌)和暖色(看涨)标注,帮助捕捉潜在反转信号。 情绪指数矩阵
结合 ATR 波动率与当前价格到最近整数关口的距离,生成市场情绪热图,并输出基于 ATR 动态调整的建议止损阈值。 交互界面
支持在图表任意位置拖拽面板,响应延迟低于 1 毫秒。自适应不同屏幕分辨率,背景、文字、颜色、尺寸等全部可自定义。 说明: 本工具仅提供数据分析
FREE

BarionQuant MACD Color Lite displays a custom four-color MACD histogram that makes momentum shifts easy to read at a glance. DIF and DEF lines are included; divergence detection is reserved for the paid Divergence Pro edition. HOW IT WORKS DIF = Fast EMA(12) minus Slow EMA(26) DEF = Smoothed signal line of DIF Energy = (DIF − DEF) × 2, split into four histogram colors: Above zero, lengthening → red (momentum building) Above zero, shortening → aqua (momentum fading) Below zero, lengthening → gree
FREE
This is the demo version of "All Harmonics 26" indicator . "All Harmonics 26" searches for 26 types of harmonic patterns and outputs them in a convenient way. You can check out the documentation here . This demo version has the following limitations: The indicator searches only for one type of harmonic patterns out of 26:- Gartley. The indicator outputs new patterns with a lag of 10 bars.
FREE
该指标是My candle的演示版本,完整版可以在此处下载: 蜡烛图案创建器 通过完整版,您可以创建自己的蜡烛规则,并修改传统蜡烛图案以更准确地适应您的策略。 该指标包含了多个示例蜡烛规则,但这里我只展示其中几个: Pattern Rule Candle Green C > O Candle Red C < O Doji C = O Hammer (C > O and (C-O) *2 < O-L and (C-O) *0.5 > H-C) or (C < O and (O-C) *2 < C-L and (O-C) *0.5 > H-O) Hammer Green C > O and (C-O) *2 < O-L and (C-O) *0.5 > H-C Hammer Red C < O and (O-C) *2 < C-L and (O-C) *0.5 > H-O Marubozu (C > O and C-O > (H-L) * 0.7 ) or (C < O and O-C > (H-L) * 0.7 ) Marubozu Green C > O and C-O > (H-
FREE

GANN TRIANGLE PRO v4.0 - OPTIMIZATION ANALYSIS REPORT CURRENT VERSION ASSESSMENT (v3.8) Strengths Feature Evaluation Swing Point Detection Clear logic using Left/Right bars Fibonacci/Gann Ratios Properly applied 61.8%, 100%, 161.8% Dashboard Real-time updates with visual indicators Code Structure Clean, maintainable architecture Critical Limitations Issue Impact Win Rate Effect No Trend Filter Signals against major trend -20% to -30% Missing Volume Confirmation False breakouts not filt
FREE

Certainly! Here's the revised Chinese translation including the information about the indicator not repainting its signals and being resistant to market noise:
介绍 Volatility Doctor RSI,这是一款基于可信赖的RSI指标构建的突破性工具,旨在提升您的交易体验。
我们的指标不仅提供实时的RSI读数,还准确预测了未来10步内RSI读数的位置,适用于您选择的任何时间框架和任何偏好的交易符号。此外,我们强调指标不会重新绘制其信号,确保您获得可靠的交易指导,同时对市场噪音具有很强的抵抗力。
自适应智能:这个智能工具学习并动态调整,无缝融入您独特的交易策略,增强您的决策过程。
立即使用 Volatility Doctor RSI 提升您的交易。
祝您和平、繁荣和交易盈利。
Volatility Doctor.
FREE

Bollinger Bands Stop Indicator holds significant importance for traders navigating the complex world of financial markets. Its relevance lies in several key aspects. Firstly, it aids in trend identification. By analyzing price movements relative to the Bollinger Bands, traders can discern whether the market is in an uptrend, downtrend, or ranging phase. Secondly, the indicator provides valuable insights into market volatility. Wider bands indicate higher volatility, while narrower bands suggest
FREE

Chỉ báo Watermark là một công cụ trực quan thường được sử dụng để lưu trữ các ký hiệu giao dịch và khung thời gian. Các tính năng chính trên chỉ báo: Tạo nhãn dán ký hiệu giao dịch tạo nhãn dán khung thời gian giao dịch Cố định vị trí theo chart giá Chỉ báo không tác động đến các tín hiệu giao dịch của nhà đầu tư. Nếu có bất kỳ vấn đề vui lòng phản hồi lại để chúng tôi có thể cải thiện sản phẩm.
FREE
Session Buffer Lines 是一款轻量级 MetaTrader 5 指标,可直接在图表上标记主要交易时段,并通过缓冲区输出时段事件。 核心思路: 该指标为东京、伦敦、纽约以及伦敦纽约重叠时段提供清晰的视觉参考, 同时通过 iCustom() 向 Expert Advisor 提供时段开盘和收盘事件。 快速概览 产品类型 MetaTrader 5 指标 主要用途 时段时间参考、图表标记与 EA 缓冲区 包含时段 东京、伦敦、纽约以及伦敦纽约重叠时段 时间基准 基于纽约时间,并支持经纪商服务器时间偏移调整 外部 DLL 不需要 主要功能 为东京、伦敦、纽约及重叠时段绘制垂直标记。 基于纽约时间的可配置时段设置。 支持经纪商服务器时间偏移和夏令时调整。 每个时段都可独立显示或隐藏。 可自定义颜色、线宽以及开盘/收盘样式。 支持可选图表标签。 提供可供 EA 读取的时段开盘和收盘缓冲区。 实现轻量,无 DLL、无 WebRequest、无外部文件依赖。 开发者缓冲区 Buffer 0: Tokyo Open Buffer 1: Tokyo Close Buffer 2: Lon
FREE

介绍 Consecutive Candle MT5,这是一款创新的指标,旨在通过识别连续的看涨或看跌蜡烛来增强您的交易策略。此工具非常适合 forex、股票、加密货币和商品市场的交易者,提供清晰的信号和警报,帮助您做出明智的决策。 凭借其提供及时的趋势确认和潜在反转警报的能力,Consecutive Candle MT5因其准确性和易用性而受到赞誉。许多交易者报告称,通过利用此指标把握持续趋势,改善了交易时机和提高了成功率。 MQL产品安装指南 | 在 MT4/MT5 上更新已购买的MQL产品 | 常见故障排除指南 | 指标设置/指南 主要特点 缓冲区集成:将指标值暴露为可由 Expert Advisor 直接读取的可访问缓冲区,以便于基于信号的自动交易。 可视化箭头信号:在信号蜡烛上直接在图表上显示清晰的买入/卖出箭头,便于视觉阅读。 快速且可回测:基于 MetaTrader 的本机 OnCalculate() 引擎构建,确保快速计算并与策略测试器完全兼容,以进行历史回测。 弹出警报:在信号事件上触发 MetaTrader 警报弹出窗口,确保您不会错过任何交易设置。 推送通知:实时向
FREE

The "Volume Range Profile with Fair Value" (VRPFV) indicator is a powerful volume analysis tool designed to help traders better understand market structure and identify key price areas where significant institutional activity occurs. Instead of just looking at volume on individual candlesticks, VRPFV analyzes the distribution of volume by price level within a specific time range, providing deep insights into the "footprint" of smart money. VRPFV consists of the following core components: Upper &
FREE

Market Sessions HUD Pro turns any chart into a clear, professional session map. See exactly which market is open, how far it has moved, when the next one opens — plus elegant session zones with a fully configurable opening range. Built to look great on any broker and any timeframe, with real Daylight Saving handling so your sessions are always on time. Real-time HUD panel Active session name in its own color, with a live server clock Session progress bar (% elapsed) and countdown to the next
FREE

This indicator displays pivot points in the chart, including historical vales, and supports many calculation modes for Pivot Points and S/R levels. [ Installation Guide | Update Guide | Troubleshooting | FAQ | All Products | Get Help ] It plots historical levels for backtesting purposes
It allows you to select the reference timeframe It implements different Pivot Point calculation modes It implements different SR calculation modes
It implements customizable colors and sizes
Calculation Mod
FREE

Stochastic + RSI Multi-Timeframe Dashboard with Momentum Strength Need Trade Assistant? Trade Panel Pro MT 5
Please leave a review, if you like this.
OVERVIEW A professional multi-timeframe dashboard indicator that displays Stochastic Oscillator and RSI (Relative Strength Index) values from 7 different timeframes simultaneously on a single compact panel. Perfect for scalpers and day traders who need quick m
FREE
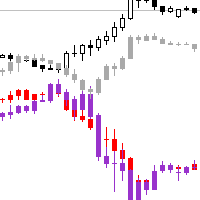
交易实用必备工具指标 波浪自动计算指标,通道趋势交易 完美的趋势-波浪自动计算通道计算 , MT4版本 完美的趋势-波浪自动计算通道计算 , MT5版本 本地跟单复制交易 Easy And Fast Copy , MT4版本 Easy And Fast Copy , MT5版本 本地跟单复制交易 模拟试用 Easy And Fast Copy , MT4 模拟账号运行 Easy And Fast Copy , MT5 模拟账号运行
可以设置其他周期品种的K线图 覆盖到本窗口中,观察到关联性波动 品种名留空则放弃显示该品种
"Cooperative QQ:556024" "Cooperation wechat:556024" "Cooperative email:556024@qq.com"
FREE

STRUCTUREMAP NAVIGATOR MT5 Multi-Timeframe Market Structure Dashboard
TAGLINE
Read the market like a structure trader.
PRODUCT OVERVIEW
StructureMap Navigator MT5 is a multi-timeframe market-structure indicator for MetaTrader 5. It is designed to help traders understand how price is behaving through swing points and structure events rather than relying only on traditional buy/sell arrows.
The indicator analyzes recent swing highs and swing lows, classifies them as HH, HL, LH, or LL, and th
FREE

This is a usefull utility for monitoring spread and also for recording informations to a file. (Files will be placed into "Common\Files\Spread Monitor"). There is the possibility to let the indicator calculate high/low into the past thanks to downloading ticks. (It's a slow and approsimate thing! The best way to use it is to attach to a chart and let it recording spread in real time). There is also a buffer with the average of spread in latest X periods.
Easy and effective.
FREE

If you love this indicator, please leave a positive rating and comment, it will be a source of motivation to help me create more products <3 Key Takeaways Generates buy and sell signals earlier than regular MA This indicator can detect a trend when it is just starting Filter : A special parameter that is useful for filtering out spikes without causing lag. However, like all indicators, it isn't foolproof, to avoid false signals, it's best to use the Dots indicator with other indicators. Te
FREE

This indicator displays volume delta (of either tick volume or real volume) encoded in a custom symbol, generated by special expert advisers, such as RenkoFromRealTicks . MetaTrader does not allow negative values in the volumes, this is why we need to encode deltas in a special way, and then use CustomVolumeDelta indicator to decode and display the deltas. This indicator is applicable only for custom instruments generated in appropriate way (with signed volumes encoded). It makes no sense to ap
FREE

The MP Andean Oscillator is used to estimate the direction and also the degree of variations of trends. It contains 3 components: Bull component, Bear component and Signal component. A rising Bull component indicates that the market is up-trending while a rising Bear component indicates the presence of down-trending market. Settings: Oscillator period: Specifies the importance of the trends degree of variations measured by the indicator. Signal line per: Moving average period of the Signal line
FREE
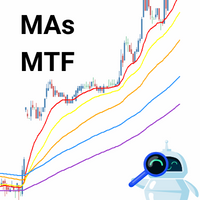
El indicador técnico propuesto es un sistema de medias móviles de múltiples marcos temporales diseñado para ayudar a los operadores del mercado financiero a seguir de cerca los movimientos tendenciales. Al combinar medias móviles de diferentes períodos, este indicador ofrece una visión más completa de la dirección de la tendencia, lo que permite a los traders identificar oportunidades de trading con mayor precisión. Al utilizar este indicador, los operadores pueden maximizar sus ganancias al tom
FREE

This indicator based on Tradingview indicator
True Close – Institutional Trading Sessions (Zeiierman) is a professional-grade session mapping tool designed to help traders align with how institutions perceive the market’s true close. Unlike the textbook “daily close” used by retail traders, institutional desks often anchor their risk management, execution benchmarks, and exposure metrics to the first hour of the next session.
This indicator visualizes that logic directly on your chart — drawi
FREE

Clock GMT Live 拥有您需要了解的有关我们经纪人的所有信息,很多时候您会想知道我现在的格林威治标准时间或我的经纪人正在处理什么格林威治标准时间,使用此工具您将能够实时了解格林威治标准时间和格林威治标准时间 经纪人和你当地时间的时间偏移,你也会不断地知道经纪人的 ping 只需将它放在一天中的某个时间,您就可以获得信息
每次收购价格都会上涨,我们将以此来保护,这样很少有人可以拥有我独特的策略 我的其他开发可以在这里查看
准确的时机可能是交易中的一个关键因素。 目前,伦敦或纽约证券交易所是否已经开市或仍处于关闭状态? 外汇交易的营业时间何时开始和结束? 对于手动交易和实时交易的交易者来说,这不是什么大问题。 使用各种互联网工具、金融工具的规格和时间本身,您可以快速了解何时是根据自己的策略进行交易的正确时间。 对于一些只关注价格走势并在价格走势向他们发出信号时进行买卖的交易者而言,时间本身并不重要。 对于在纽约(股票)市场收盘后和欧盟(股票)市场开盘前进行“夜间剥头皮”交易的交易者,或者专门在“伦敦休市”或其他时间进行交易的交易者而言,情况有所不同 最忙的时候,还是所有买卖
FREE
解锁精准交易:ATR 动态枢轴系统 立即下载这款 免费 的 ATR Pivot Signals 指标,立即在市场噪音中占据优势。对于那些要求基于 真实市场摆动反转 而非猜测来确定高信心入场点的交易者来说,这是终极工具。 ATR Pivot Signals 系统是一款创新的技术指标,它利用 平均真实波动范围 (ATR) 动态过滤波动性,确保仅在价格出现统计学上显著的移动时才触发信号。它通过动态设置 反转阈值 来消除假突破,使其在所有市场条件下都有效——无论是平静的盘整还是爆炸性的趋势。 ATR 动态枢轴指标的关键特点: 动态、过滤噪音的反转: 使用可自定义的 ATR 因子 来调整反转阈值,使其适应当前市场波动性,忽略次要回调。 高信心信号: 直接在主图表上提供明确的 买入 (绿色)和 卖出 (红色)箭头,标记确认主要摆动枢轴的确切价格柱。 不重绘技术: 信号在K线收盘时确认并锁定。该指标采用防闪烁逻辑设计,确保对每个历史和实时信号的信任。 趋势识别: 清晰地跟踪市场状态(上涨/下跌趋势),为您提供简洁的视觉框架来确定方向偏差。 简单且高效: 易于安装,仅有两个关键输入参数可根据您的交易风
FREE

Hidden Edge – High-Low PreUS High-Low PreUS is a clean and lightweight indicator that marks key reference levels before the US session begins.
It draws a session box from 00:01 to 09:00 CET, identifying the high and low of the Asian session, and includes additional reference elements to support structured intraday trading decisions. Features Draws a rectangular range from 00:01 to 09:00 CET Marks the high and low of the session clearly Plots a horizontal yellow line as a suggested stop level bas
FREE
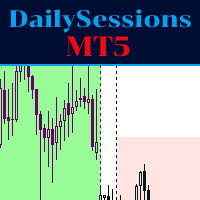
The indicator represents the session boxes for the Asian, European and American sessions. It is possible to change the time of each session, such as color. It is also possible to disable the display of each session. You will find in input parameters variables to modify in format hh:mm. In Colors tab you can change the color of boxes of each sessions. If you need some implementations please contact me.
FREE

The Three Candle Types Label Name Condition 1 Inside Bar High ≤ prev High AND Low ≥ prev Low 2 Directional Bar Higher High XOR Lower Low (one, not both) 3 Outside Bar High > prev High AND Low < prev Low Additional Failed type 2FU (red, above) = Higher High but candle closed red (bearish) → Failed Up 2FD (red/orange, below) = Lower Low but candle closed green (bullish) → Failed Down
FREE

Introduction MT5 ships with the Envelopes indicator. This indicator allows you to create equidistant bands from a moving average by specifying a “deviation.” Unfortunately, the deviation is an arbitrary number. You might determine that 0.220 works well to contain 95% of close prices for USDCHF,H1, but when you change the period to H4, most of the bars are now outside the bands. So, I created this self-tuning indicator. Instead of specifying a percent “deviation,” you specify the percent of bars
FREE

Market Time Watch 一款轻量、简洁且对每位交易者都至关重要的时间显示工具 Market Time Watch 是一款专业的图表时间显示工具,为需要精确本地时间、服务器时间和当前 K 线倒计时的交易者设计。 该工具可以在图表上直接显示 本地时间 、 服务器时间 和 K线倒计时 , 无需复杂界面或多余元素。 无论您是剥头皮交易、波段交易、新闻交易,或只是需要一个简洁清晰的时间参考, Market Time Watch 都能以最简约、最优雅的方式呈现所有关键信息。 为什么交易者喜欢 Market Time Watch 超轻量级 ,适用于所有 MT4/MT5 环境 不重绘图表 ,不干扰 EA 或指标 零延迟 、零负载、几乎不占用 CPU 完美适配剥头皮、日内交易、消息面交易以及指数 (US30, NAS100, Gold, Forex) 专业视觉设计,适用于任何图表主题 主要功能 实时时钟 在图表上清晰显示当前时间(本地或服务器)。 K 线倒计时 显示当前 K 线剩余时间,特别适合剥头皮和新闻交易者。 现代信息面板 精美弹出面板包含: 所有 TesterM
FREE

MA Assistant MT5 介绍 可视化趋势识别 – 通过平滑且多彩的图表区域,快速识别市场的多头和空头走势 MA 交叉提醒 – 当快慢均线发生交叉时,提供实时提醒 多周期 MA 热力图 – 在一个清晰的表格中分析不同周期的均线状态 MA 差值测量 – 每10根K线显示两条均线之间的差值,帮助衡量趋势强度和动量 专业版本可用 – 包含 16+ 交易策略 的高级工具可在 Strategy Assistant 立即体验 保持更新 – 加入我们的 MQL5 社区 频道 @hdtradinglab 获取最新更新和免费工具 观看 YouTube 视频: 请观看 YouTube 视频以获取有关 MA Assistant 的完整信息,并订阅我的频道以获取更多免费产品视频。
简短描述 :
MA Assistant 是一款强大且免费的交易工具,通过简洁直观的方式简化均线分析。它使用彩色区域突出显示 多头 和 空头 趋势,提供交叉提醒,并包含 多周期 MA 热力图 以提升决策能力。 独特功能是 MA 差值概念 ,可直接在图表上显示动量强度,帮助交易者快速识别强势或弱势市场。 输入参数结构 均线设置
FREE

DS RVOL: The Relative Volume Indicator for MT5 RVOL is a straightforward Relative Volume (RVOL) indicator for MetaTrader 5. It shows you how current volume compares to a historical average, providing a quick way to gauge the strength of a price move. How it Works Relative Volume is a simple ratio: R V O L = C u rre n t V o l u m e / A v er a g e H i s t or i c a l V o l u m e RVOL > 1.0 : Volume is higher than usual. This suggests there's strong interest and potential for a sustained move. RVOL
FREE
- Chart Time Indicator is very simple and easy, but it can be very important to control the time before opening any manual trade. This indicator shows the time on the chart between 3 different options. Input Parameters: - Show Time : Select all the time options that you want to see. Local Time (Personal Computer Time), Server time (Broker Time) or GMT Time. Recommendations: - Use only one Chart Time Indicator for each Chart.
FREE
学习如何在MetaTrader AppStore上购买EA交易,MetaTrader平台的应用程序商店。
MQL5.community支付系统支持通过PayPay、银行卡和热门付款系统进行交易。为更好的客户体验我们强烈建议您在购买前测试EA交易。
