
PnF Chart
- 指标
-
Marcin Konieczny
 Marcin Konieczny - Soft4FX
High-quality trading solutions for Metatrader 4
Indicators, simulators, scripts and more...
http://soft4fx.com - 版本: 1.3
- 更新: 18 十一月 2021
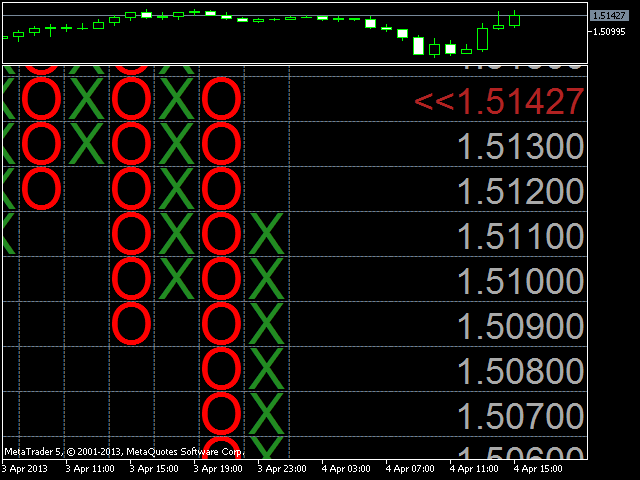
This indicator displays Point & Figure charts (PnF charts) in the indicator window. PnF charts show only price movements that are bigger than the specified box size. It helps to eliminate noise and allows focusing on main trends.
Time is not a factor here. Only price movements are taken into account. That is why PnF chart is not synchronized with the main chart it is attached to.
More about PnF charts: http://stockcharts.com/school/doku.php?id=chart_school:chart_analysis:pnf_charts
Indicator works in two modes:
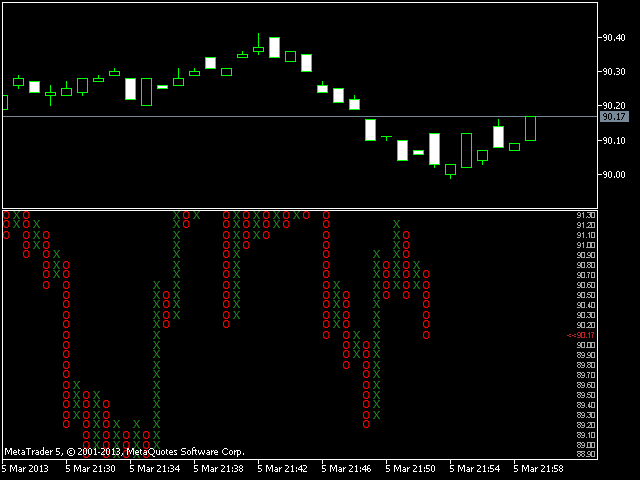
- CLOSE - only close prices are taken into account while building the chart;
- HIGH_LOW - only high/low prices are taken into account.
The box size can be specified in a two different ways:
- PIPS - as an absolute value of pips;
- ATR - as a current value of ATR indicator (Note: current ATR value will be different every time you reinitialize or reattach the indicator!).
Other features:
- Reversal amount can be changed;
- Indicator colors are fully customizable;
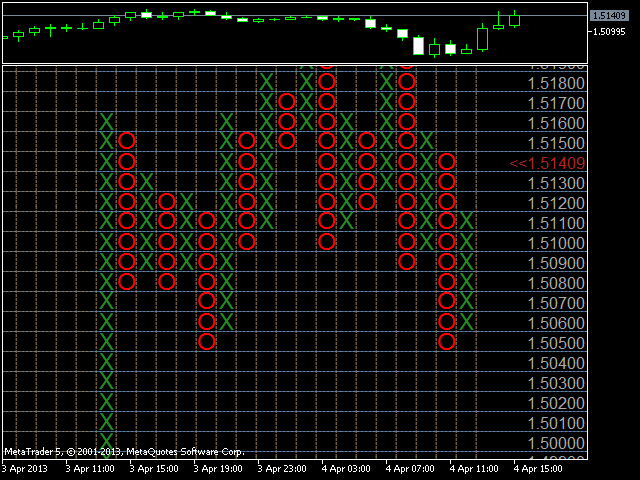
- Grid can be turned on and off;
- The chart can be moved and zoomed in/out using keyboard.
Keys:
- W, S, A, D - move the chart;
- Q, E - zoom in/out;
- G - show/hide grid.
Note: The indicator does not work in the Strategy Tester (backtesting).


Awesome job! Props Man!