 MetaTrader 5
 专家
专家 指标
指标 程序库
程序库 实用工具
实用工具 窗口小部件
窗口小部件 规则
规则适用于MetaTrader 5的免费技术指标 - 29
 技术指标的信号外汇和股票市场的开仓交易和平仓交易起着至关重要的作用。指标的本质就是一种交易品种的数学转换,旨在预测未来的价格变化。
测试技术指标可以更有利于预测市场行为并从中获利。
技术指标的信号外汇和股票市场的开仓交易和平仓交易起着至关重要的作用。指标的本质就是一种交易品种的数学转换,旨在预测未来的价格变化。
测试技术指标可以更有利于预测市场行为并从中获利。 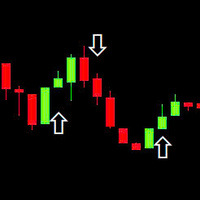
This indicator is based on the RSI (Relative Strength Index) to identify potential Breakout points and draw arrows on the chart to suggest buy/sell signals. Use RSI to find breakout signals. Draw Buy/Sell arrows on the chart. Send alerts when there is a trading signal. Buy (Orange Arrow - 0xFFAA00): When a buy signal appears. Sell (Blue Arrow - 0x0000FF): When a sell signal appears. DRAW_ARROW: Used to draw arrows on the chart.
FREE

If you love this indicator, please leave a positive rating and comment, it will be a source of motivation to help me create more products <3 Key Takeaways Provides both trend and momentum signals in a single view. Entry and exit signals are based on the crossover of the RSI and Signal Line. Market Base Line offers insight into the overall trend direction. Volatility Bands help identify overbought and oversold market conditions.
FREE

Divergence Hunter - Professional Multi-Oscillator Divergence Detection System Overview Divergence Hunter is a professional-grade technical indicator designed to automatically detect and visualize price-oscillator divergences across multiple timeframes. Built for serious traders who understand the power of divergence trading, this indicator combines precision detection algorithms with an intuitive visual interface. Key Features Multiple Oscillator Support: RSI (Relative Strength Index) MACD (Mo
FREE

Mattrix Auto Refresh Short Description Keeps custom symbol charts up to date. Forces periodic candle recalculation without Journal spam.
Essential for any synthetic or custom symbol chart in MT5.
Full Description Custom symbols in MetaTrader 5 do not receive broker ticks. Their charts often show outdated or incomplete candles, especially on lower timeframes.
This lightweight indicator solves the problem. Drop it on any custom symbol chart. It forces a periodic full bar recalculation by re
FREE

速度略有变化。 测试人员需要一个新的顾问,谁有兴趣,写信给我通过电子邮件777basil@mail.ru https://backoffice.aurum.foundation/u/DHXP1U
该指标基于历史价格变化计算,并以数学方式计算,每次再次接收数据时重新计算。 它可以在不同的时间框架上使用。 从70%的指标边界来看,价格运动或整合方向发生变化。 通过这种方式,您可以在趋势和通道中间从其边界进行交易。 最好在趋势交易中使用它来确定阻力位/支撑位。 在视频中,您可以看到指标是如何工作的: https://youtu.be/UG2ZZEH9B_U 通讯联系人 777basil@mail.ru 我们将为您的任务准备一个专家,一个指标。
该指标基于历史价格变化计算,并以数学方式计算,每次再次接收数据时重新计算。 它可以在不同的时间框架上使用。 从70%的指标边界来看,价格运动或整合方向发生变化。 通过这种方式,您可以在趋势和通道中间从其边界进行交易。 最好在趋势交易中使用它来确定阻力位/支撑位。 在视频中,您可以看到指标是如何工作的: https://youtu.be/0
FREE

Clock GMT Live 拥有您需要了解的有关我们经纪人的所有信息,很多时候您会想知道我现在的格林威治标准时间或我的经纪人正在处理什么格林威治标准时间,使用此工具您将能够实时了解格林威治标准时间和格林威治标准时间 经纪人和你当地时间的时间偏移,你也会不断地知道经纪人的 ping 只需将它放在一天中的某个时间,您就可以获得信息
每次收购价格都会上涨,我们将以此来保护,这样很少有人可以拥有我独特的策略 我的其他开发可以在这里查看
准确的时机可能是交易中的一个关键因素。 目前,伦敦或纽约证券交易所是否已经开市或仍处于关闭状态? 外汇交易的营业时间何时开始和结束? 对于手动交易和实时交易的交易者来说,这不是什么大问题。 使用各种互联网工具、金融工具的规格和时间本身,您可以快速了解何时是根据自己的策略进行交易的正确时间。 对于一些只关注价格走势并在价格走势向他们发出信号时进行买卖的交易者而言,时间本身并不重要。 对于在纽约(股票)市场收盘后和欧盟(股票)市场开盘前进行“夜间剥头皮”交易的交易者,或者专门在“伦敦休市”或其他时间进行交易的交易者而言,情况有所不同 最忙的时候,还是所有买卖
FREE

Monte Carlo Equity Projection (蒙特卡洛权益预测)基于您账户自身的历史平仓交易运行自助法(bootstrap)模拟,并直接在图表上绘制未来权益路径的百分位锥形区间——无需假设收益分布,也无需外部数据源。 将其附加到任意图表后,指标通过原生 MT5 API 读取账户的真实平仓交易记录,进行数千次有放回重采样,绘制出当前统计特征所隐含的真实结果区间,而非固定的回测曲线。所有计算均在本地完成:不连接外部服务器,不使用 WebRequest,也无需联网权限。 为何采用重采样而非单一回测 一份回测报告只展示一条路径:事情发生的经过及顺序。它无法展示如果同样的交易以不同顺序出现会怎样,也无法显示结果在多大程度上依赖于少数几笔极端的盈利或亏损。自助法重采样直接解决了这个问题:将同一批平仓交易反复打乱重排数千次,生成一组可能的权益曲线分布,而不是单一曲线。这个分布的宽度——而不仅仅是其中位数——才能说明某项优势在统计上是否足够稳健以支持加大仓位,还是当前的交易记录尚且太少或运气成分太重,尚不足以下结论。 方法论 模拟器对已平仓交易进行有放回抽样(自助法重采样——不假设任何
FREE
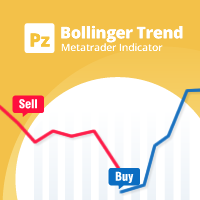
A personal implementation of the famous Bollinger bands indicator as a trend following mechanism, which uses a moving average and the standard deviation to define what a trend is and when it changes. Bollinger bands are usually used as an oversold/overbought indicator only, but in my opinion, the trading approach is more complete using the trend variant as an exit strategy. [ Installation Guide | Update Guide | Troubleshooting | FAQ | All Products | Get Help ] Easy to trade Customizable co
FREE

Mahdad Candle Timer 是一款轻量级且精确的 MetaTrader 5 指标,它会在最新一根K线旁边显示当前K线的剩余时间。该工具专为依赖精准时机的交易者设计——无论是剥头皮、日内交易,还是等待K线确认的波段交易。 主要功能 精准倒计时 – 以 HH:MM:SS 显示剩余时间(可选毫秒) 动态定位 – 始终与最新K线对齐,不受图表缩放或比例影响 智能颜色适配 – 文本颜色会根据背景和K线方向(看涨/看跌)自动调整 自定义提醒 – 在K线收盘前X秒发出声音或弹窗提醒 完全可定制 – 字体、大小、颜色、刷新速度和提醒参数均可调整 轻量高效 – 占用极低CPU资源,不影响其他指标或EA运行 ️ 输入参数 ShowMilliseconds (true/false) Update Interval (ms) Bullish/Bearish Colors (Light/Dark) Font & Size Enable Alarm (true/false) Alert Seconds Before Close Alert Sound File 使用场景 剥头皮交易者
FREE

ALCHEMIST POI & AOI 黄金、白银及其他市场的精准关键交易区域 不要再追逐价格,而是在机构资金留下痕迹的地方进行交易。 ALCHEMIST POI & AOI 是一款专业级 MT5 指标,专门用于识别高概率的 兴趣点(POI,Point of Interest) 和 兴趣区域(AOI,Area of Interest) 。这些区域通常是大型机构、流动性和订单流最活跃的地方,也是价格最有可能发生反应的重要位置。 该指标针对 黄金(XAUUSD) 和 白银(XAGUSD) 进行了特别优化,帮助交易者提前发现关键反转区、趋势延续区以及流动性驱动的交易机会。 为什么交易者选择 ALCHEMIST POI & AOI 机构级关键交易区域 指标能够自动识别市场中的重要价格区域,这些区域通常聚集了大量流动性、机构订单和市场失衡。许多强劲行情往往从这些区域启动。 专为黄金和白银打造 黄金和白银是全球波动性最高、最具挑战性的交易市场之一。 ALCHEMIST POI & AOI 针对贵金属市场的独特价格行为进行了优化,帮助交易者在快速波动的市场环境中更准确地把握机会。 适用于所有时间周
FREE

Very simple, yet powerful, indicator that helps you get notified every time a candle touches your trend line, horizontal line, and/or your rectangular. Powerful indicator yet very simple to use! All you need to do is draw your MT5 trend lines, horizontal lines, and/or rectangles and SmartLine takes care of notifying you the moment the current price touches one of your key levels! No brainer If you like the indicator, please leave a review and share the tool with your peers. WARNING: Please use t
FREE

Next Bar Countdown 是一款高精度、高性能的 MetaTrader 5 時間指標,專為向交易者顯示當前燭台結束前的剩餘時間而設計。精確的時間對許多交易策略至關重要,尤其是在新燭台開啟時需要立即做出決策的情況下。 主要功能: 該指標提供多種超越標準計時器的功能: 雙時間框架顯示: 您可以同時顯示當前圖表時間框架和第二個可自由選擇的時間框架(例如 H4 或每日)的倒數計時。 防滯技術: 透過伺服器時間與本地系統時間之間的智能同步,計時器運行絕對流暢。即使市場波動性較低或週末未收到報價,它也不會跳過任何秒數。 個性化設計: 字體、大小和在圖表上的位置都可以完全根據您自己的圖表設置進行調整。 視覺警報: 在烛台收盤前的最後幾秒鐘,該指標可改變倒數計時的顏色,及時引起您的注意。 全面的通知系統: 當烛台即將收盤時,您可透過終端警報或直接發送到智慧型手機的推送通知隨時掌握最新資訊。 操作與反饋 安裝完成後,您可透過輸入視窗輕鬆設定所有參數。該指標可立即使用,無需複雜的預設設定。 由於此工具為免費提供,您的反饋或評價對我們而言非常寶貴。如果您有任何疑問或進一步優化的建議,可隨時使用內
FREE
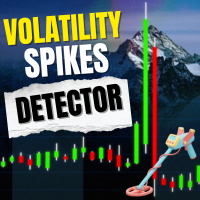
Volatility Monitor – 实时波动检测指标 概述 Volatility Monitor 是一款轻量级且专业的 MT5 指标,用于跟踪突发价格波动并实时提醒交易者。无论您交易外汇、黄金、日元货币对还是加密货币,该工具都能通过 ATR 自动检测或手动点数阈值提供清晰的市场波动信号。 它会在图表上直接标记蜡烛,并发送渐进式提醒,帮助交易者快速应对行情波动、新闻事件和突破行情。 主要功能 实时波动检测 – 即时识别市场波动。 灵活的检测模式 – ATR 自动模式或手动点数模式。 渐进式提醒 – 声音提示 (1–3 次),弹窗通知和推送提醒。 智能蜡烛标记 – 彩色圆点 (黄色/橙色/红色) 标示不同波动强度。 自动适配颜色 – 自动识别深色或浅色图表背景。 内置仪表盘 – 显示实时蜡烛范围、ATR 值、波动百分比及历史峰值。 通用支持 – 兼容外汇、黄金、日元货币对和加密货币。 输入与设置 检测模式: ATR 自动或手动点数。 历史回溯: 自定义分析蜡烛数量。 标记设置: 启用/禁用标记,选择大小和颜色模式。 提醒: 启用声音、弹窗、推送提醒。 仪表盘: 可调整位置,实时显示波
FREE

Session Liquidity Pro (SLP) – Professional ICT/SMC Session & Liquidity Indicator Unlock the power of institutional session dynamics with precision-engineered tools designed for serious traders. Session Liquidity Pro is a broker-agnostic, high-performance MT5 indicator that visualizes key liquidity and session concepts used by professional ICT/SMC traders. Built with clean architecture and focused on accuracy, it eliminates common pitfalls like incorrect session times caused by broker offsets or
FREE

GDS Risk Calculator Panel - Free Risk and Position Size Utility for MetaTrader 5 GDS Risk Calculator Panel is a free risk and position-size utility for MetaTrader 5. It helps traders review basic trade risk, lot size logic and position planning before making manual trading decisions. This tool does not analyze the market, does not generate buy or sell signals and does not open trades automatically. Its purpose is to support a more disciplined manual workflow where risk is checked before executio
FREE

分析仪表盘是一个指标,用于分析您过去和当前的交易,并生成分析仪表盘,您可以通过附加的饼图查看详细信息。
主要考虑四类分析:1)业绩指标;2)交易行为指标;3)执行质量指标;4)持仓水平指标。
这四项通用分析指标已进一步细分为以下更具体的指标。
业绩指标: 毛利润 毛亏损 总盈利因子 总预期收益 总胜率 平均风险回报比 最大回撤 最大涨幅
所有这些指标均以图表形式显示,并借助饼图进行展示。
交易行为指标: 总交易次数 总盈利次数 总亏损次数 平均持仓时间 平均交易规模 触发止损的交易次数 触发止盈的交易次数 手动止损次数
除平均交易规模外,其他指标均以图表形式显示。
执行质量指标: 平均滑点 平均入场点差 平均出场点差 总佣金+隔夜利息 对毛利润的影响 对毛亏损的影响
这些指标以饼图形式呈现,方便进行图表细分。滑点和点差需要历史数据才能计算,因此如果您需要所有指标的准确性,则需要在策略测试器中运行图表,以便下载历史数据。
持仓层面指标: 未平仓头寸总数 未平仓盈利总数 未平仓亏损总数
FREE

PINBAR SCANNER PRO with TREND and RSI + CCI OSCILLATORS filter This indicator has been designed to automatically and constantly scan entire market to find high probability pinbar formations, so you can just wait for the perfect trading opportunity come to you automatically.
PINBAR is the strongest candle reversal pattern known in technical analysis. It shows excellent areas to determine potential entries and exits with opportunity to use excellent risk and reward ratios. It includes an RSI and
FREE
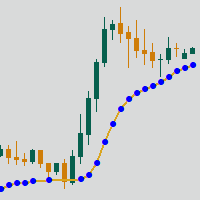
Adaptive Moving Average (AMA) is a trend indicator using moving average and market noise filter. Indicator feature are blue and red points, showing the power of trend. Recommendations for trading: Auxiliary Indicator Detecting trend Detecting power of trend Detecting potential reversal points Main indicator Shows entry points for swing trading Serves as dynamic support and resistance Recommendations for use: Any instrument Any timeframe Input parameters: Period - AMA period Fast Period - fast MA
FREE
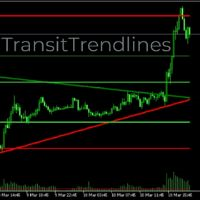
TransitTrendlines this is a automatically trendline drawer, it draw both horizontal and diagonal trendlines. The horizontal trendlines are the pivot points of the day timeframe and the diagonal trendlines are based on the current time frames. You can adjust the diagonal trendlines by increasing the number of bars to draw the diagonal trendline and can also adjust the steepness. Note that the Horizontal trendlines are based on the day pivot points not currant time frame. Join mql5 transitbk98 cha
FREE

CV Session Range Pro – Professional Trading Session Indicator for MetaTrader 5 CV Session Range Pro is a professional trading session indicator for MetaTrader 5, designed for precise visualization and analysis of global market sessions, trading ranges, and important price areas. The indicator helps traders analyze market activity, volatility phases, and liquidity zones of different trading sessions with a clean and structured visual interface. Supported Sessions: Tokyo Session Frankfurt Session
FREE

RSI Turn Finder 指标是一套适用于 MetaTrader 5 的 非重绘型动能拐点捕捉系统 。它监测 14 周期 RSI 穿越可配置的正向阈值(默认 65)向上突破的精确时刻,并要求 5 周期收盘价 EMA 同时向上,从而确认动能。确认后会将得到的趋势方向锁定为当前状态,并在图表上以双配色 EMA(low, 10) 趋势线进行展示。每次状态切换时都会在图表上打印 “Positive” 或 “Negative” 标签,并实时触发四通道提醒。在相同数据上,MT4 与 MT5 版本在视觉效果和逻辑输出上完全一致。 MT4 版本请查看: RSI Turn Finder MT4 更多作者产品: 查看所有产 品 想查看实盘示例和最新工具,请访问我的个人主页并发送好友请求,以免错过更新! 工作原理 RSI 穿越 + 动能确认 “Positive” 正向拐点只会在收盘完成的 K 线上,同时满足以下四个条件时触发: 前一根 K 线上的 RSI 低于正向阈值 当前 K 线上的 RSI 高于正向阈值(向上穿越事件) 当前 K 线上的 RSI 高于负向阈值(区间保护) EMA(close,
FREE

Support Resistance Channels Advanced is a MetaTrader 5 indicator that finds the strongest support and resistance from pivot points and draws them as channels (zones) rather than single lines, which better reflects how price reacts to areas. Features Automatic level detection: identifies pivot highs and lows and ranks the strongest current levels. Zone-based levels: shows support and resistance as channels, not thin lines, matching how price actually reacts. Cleaner reading: focuses on the most s
FREE
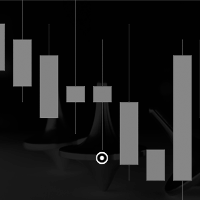
真正的陀螺指示器
它检测图表上准确的陀螺,平衡的主体和灯芯高度比,这是陀螺的真正含义,不同于锤子和十字线或空烛台。
该指标在图表上找到的陀螺数量处绘制了一个翼形图标。
设置包括
条数:调整搜索条数
图标颜色:更改图标颜色
图标代码:更改图标的wingdings代码
真正的陀螺指示器
它检测图表上准确的陀螺,平衡的主体和灯芯高度比,这是陀螺的真正含义,不同于锤子和十字线或空烛台。
该指标在图表上找到的陀螺数量处绘制了一个翼形图标。
设置包括
条数:调整搜索条数
图标颜色:更改图标颜色
图标代码:更改图标的wingdings代码
真正的陀螺指示器
它检测图表上准确的陀螺,平衡的主体和灯芯高度比,这是陀螺的真正含义,不同于锤子和十字线或空烛台。
该指标在图表上找到的陀螺数量处绘制了一个翼形图标。
设置包括
条数:调整搜索条数
图标颜色:更改图标颜色
图标代码:更改图标的wingdings代码
FREE

简介 这是一款结合了经典震荡指标 Williams %R 与 Bollinger Bands (布林带) 的复合型技术指标。它不同于传统直接基于价格的布林带,而是通过对 Williams %R 进行平滑处理后再进行标准差计算。 这种创新的组合能够有效捕捉动量爆发的瞬间,并利用布林带的动态特性来过滤普通震荡信号。当平滑后的 WPR 突破布林带上下轨时,通常预示着一个强力波段行情的开启。
核心功能与优势 双重过滤机制: 指标首先对原始 Williams %R 进行平滑处理(参数可调),有效减少了传统 WPR 常见的锯齿状噪点。 动态动量阈值: 与固定在 -20/-80 的静态超买超卖线不同,本指标引入了布林带作为动态边界,能够根据市场近期波动率自动调整信号触发点。
直观的视觉信号: 颜色变换: 指标线会根据其与布林带的位置关系自动变换颜色(突破上轨为绿,跌破下轨为红,震荡为灰)。 箭头提示: 当发生“穿透性”突破时,系统会在副图自动标注 L (Long) 或 S (Short) 信号。 高度可定制化: 用户可以自由调整 WPR 周期、平滑周期以及布林带的标准差倍数,以适应从 sc
FREE
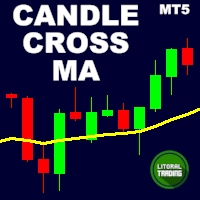
Candle cross MA is an indicator that works "silently", that is, drawing only a moving average on the chart.
It alerts you when the last candle cross with a moving average that you set. Alert is given only when the candle closes.
The moving average settings are fully customizable.
The indicator sends popup, and push notifications. You can also deactivate alerts when the chart is inactive. Are you the trend type? Do not miss another opportunity!
FREE

Engulfing Overlap Zone by RWBTradeLab
A clean, non-repainting engulfing OVERLAP detector for MetaTrader 5 — the most selective member of the RWBTradeLab engulfing family. It finds the rare, high-interest moment when a FAILED engulfing zone is overlapped by a CONFIRMED opposite engulfing zone: trapped traders on one side, fresh confirmed pressure on the other, both at the same price area. Every overlap is sorted into 8 types and graded by how much price the two zones actually share. All from CL
FREE

LIVE TRADES CHARTS – MQL5 INDICATOR
DESCRIPTION Live Trades Charts is a MetaTrader 5 indicator that displays active trading positions directly on the chart.
The indicator reads open trades and shows basic trade and account information in real time.
It updates on every tick.
FUNCTIONS Displays open trades on chart
Per trade information: Symbol Lot size Direction (Buy or Sell) Floating profit or loss Trade duration
Account information: Total floating profit/loss Number of open trades Balanc
FREE

Bias Scanner Pro identifies market direction and trend strength, giving you a clear view of bullish, bearish, or neutral bias. By combining EMA crossovers with ADX trend analysis, it provides structured market context suitable for any trading style. How It Works Bias Detection
Fast and slow EMA crossovers identify bullish, bearish, or neutral market direction. Trend Strength Confirmation
ADX measures trend intensity, confirming whether the market is trending, ranging, or choppy. Real-Time Anal
FREE

Ichimoku 多层趋势振荡器专业版是一种先进的 趋势解读 和 进出场 系统,它将 Ichimoku 计算转换为四个强大的振荡器层。这些图层清晰地展示了趋势强度、动量和最安全的进出场点。 该指标还包括可选的 RSI 、 MACD 、 EMA 和 ATR 确认,构成一套完整的交易决策方案。 独特的 多层振荡器结构 该系统创建了 四个基于 Ichimoku 的振荡器层 ,每一层代表价格行为的不同方面: 1️⃣ 第一层 – 价格距离云的距离: 衡量收盘价与 Ichimoku 云之间的距离 (根据主趋势方向取最小或最大值)。 有助于识别正在进行的趋势的强度。 2️⃣ 第二层 – 迟行线 vs 云: 显示 迟行线 (Chikou) 与云之间的距离, 并向后位移 了特定数量的 K 线。 确认趋势的完整性和长期结构。 3️⃣ 第三层 – 转换线 vs 基准线: 衡量 Tenkan-sen (转换线) 与 Kijun-sen (基准线) 之间的距离。 非常适用于检测动量增强和趋势加速。 4️⃣ 第四层 – 领先线距离: 领先跨度 A 与 领先跨度 B 之间的距离,代表云的厚度和未来趋势强度。
FREE

Mapa płynności KREDZIA organizuje aktywną płynność opartą na brokerach powyżej i poniżej ceny, pomagając inwestorom planować potencjalne cele płynności i monitorować obszary, w których może rozwinąć się zmiatanie, reakcja lub odwrócenie.
PEŁNY OPIS Ważne maksima i minima mogą stanowić potencjalne cele w zakresie wykorzystania płynności, ale ręczne śledzenie bieżących poziomów wraz ze starszymi, niesprawdzonymi odniesieniami szybko staje się trudne. Mapa płynności KREDZIA tworzy ustrukturyzowa
FREE

Trend Direction Filter: 我们可以将其定义为一种专业指标,旨在识别市场的主导方向,帮助交易者理解整体背景并更加有意识地操作。 它不是入场指标,而是一种高级方向过滤器,设计用于突出趋势结构并减少市场噪音的影响。 如何运作
该指标通过一种先进的平滑结构分析价格行为,能够区分: 明确的方向性阶段 放缓或过渡阶段 市场犹豫阶段 结果是对主导方向的清晰且稳定的呈现,有助于评估操作所处的背景。 视觉解读
Trend Direction Filter 使用一种简单但极具信息量的图形表示: 深绿色线
代表市场的主要方向。
当它向上倾斜时,表示正在形成上涨结构;当它失去斜率时,表示推动力减弱。 绿色虚线
表示上涨趋势增强。
它出现在主要深绿色线之上,突出显示运动表现出更大稳固性和连续性的阶段。 红色线
突出显示上涨趋势力量的丧失。
它不代表下跌阶段,而是表示市场可能放缓或进入过渡。 清晰度和视觉整洁
Trend Direction Filter 的主要优势之一是它显示市场方向的清晰度。 该指标旨在提供一种简洁且没有多余元素的可视化,使背景能够被立即且无歧义地读取。
这种图形整洁性有
FREE
Simple indicator to show Breakeven line for all orders on attached chart pair. This indicator also comes with additional information such as Total Lot Size, Floating Drawdown in account's currency and Number of open positions and Difference from current price in Points. Do you use DCA (dollar cost average) or Hedging approach on your trading? Then this indicator you MUST have. Really useful, when you have multiple orders (hedging), this can help you quickly identify breakeven point without calc
FREE

Awesome Oscillator Dynamic 是一款基于经典分析理念的强大技术指标,通过直观的柱状图展示两条应用于中价(Median Price)的简单移动平均线(SMA 5 和 SMA 34)之间的差值。柱状图的颜色会根据市场动能自动变化:绿色代表多头(上涨)动能,红色代表空头(下跌)动能,从而帮助交易者一眼捕捉市场情绪与趋势变化。 快速解读指南: 绿色柱高于零轴 → 上涨动能强 红色柱低于零轴 → 下跌动能强 柱体跨越零轴 → 潜在趋势反转信号 该指标无需复杂设置, 可兼容任意品种与周期 ,直接使用 MetaTrader 5 终端的标准数据进行计算。显示方式为独立窗口,避免干扰主图价格走势,让分析更清晰、直观。 Awesome Oscillator Dynamic 不仅适用于趋势跟踪,还能在震荡市中帮助识别动能变化。当绿色逐渐变短或红色逐渐减弱时,可能意味着当前趋势正在减速,交易者可以结合其他信号判断潜在的转折点。此外,将此指标与支撑阻力、K线形态、或其他动量型指标结合使用,可显著提升交易决策的可靠性。 作为一款轻量且高效的工具,它既适合新手快速理解趋势,也能为资深交易者
FREE

有了这款产品,您无需再手动滚动图表来分析特定的历史数据。“跳转到时间”功能只需单击一下即可完成。此指标允许您浏览图表历史记录。在简洁面板中输入日期和时间,或从下拉日历中选择。单击“跳转到时间”,指标将带您跳转到指定时间。您还可以同时将所有图表同步跳转到指定时间。
实用链接:其他更新 - 链接 ,MT5 版本 - 链接
为了方便快速导航,我们还提供了以下工具:
下拉日历:单击标题即可将图表从日期跳转到月份和年份;只需点击几下即可访问任何日期。 “今天”、“-1D”、“-1W”、“-1M”标记:将字段中的日期向前移动一天、一周或一个月;点击次数会累加。 “所有图表”:切换开关会立即跳转到所有打开的图表;每个图表都会根据其交易品种和时间周期找到最近的K线。 立即按钮:立即返回当前K线和熟悉的自动滚动功能。 目标标记:一条垂直虚线标记找到的K线,并自动消失,在图表上不留痕迹。
如果指定时间恰逢周末或报价缺口,“跳转到时间”功能会跳转到最近的现有K线。对于深度历史数据,该指标会自动请求更多数据并重复跳转。如果经纪商没有数据,它会立即在日志中报告,并将图表移动到最大可用深度。指标面板可以
FREE

Read detailed blog here: https://www.mql5.com/en/blogs/post/772837
Quick Feature List Three strategies in one indicator: Fakeout Reversal, FVG Breakout, Quartile Continuation Heatmap candle coloring using a Linear Regression channel on every bar Configurable anchor session window with automatic timezone offset support Candle color filter to accept or skip signals based on trend strength Signal strength separation: strong signals and weak signals drawn separately so you can style them differentl
FREE
描述: NR4 & NR7 Inside Bar Highlighter 是一款自动检测 价格压缩形态 的指标,基于 NR4 或 NR7 与 Inside Bar(内部条形)组合的策略。 NR4(4日最窄区间)表示当前蜡烛图的范围小于过去 4 根蜡烛中的最小范围;NR7 则比较过去 7 根蜡烛。当这种窄幅震荡形态与内部条形(当前蜡烛完全包含在上一根蜡烛内)结合时,通常代表 市场波动率收缩 ,并可能预示即将出现 强烈的突破行情 。这些信号广泛应用于突破交易策略中。 该指标在图表上用不同颜色直观显示信号: NR4 + Inside Bar:白色(可自定义) NR7 + Inside Bar:橙色(可自定义) 每个信号会在图表上自动标注标签。支持与可视化提醒、推送通知及其他交易逻辑集成。兼容所有品种与时间周期。 适合使用突破或波动率扩张策略的交易者,是一款轻量级、实用性强的工具。
FREE

Simple Vwap with the daily, weekly and monthly
VWAP is the abbreviation for volume-weighted average price , which is a technical analysis tool that shows the ratio of an asset's price to its total trade volume. It provides traders and investors with a measure of the average price at which a stock is traded over a given period of time.
How it's used Identify entry and exit points: Traders can use VWAP to determine when to buy or sell an asset. Understand price trends : Traders can use V
FREE
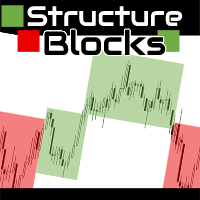
Structure Blocks: a structured way to analyze market structure
This indicator is for you if you are a price action or smart money concept trader. It identifies market trends' ultimate highs and lows and intermediaries' swing lows and highs. It adjusts based on candles' body where most of the volume is, disregarding wicks. Need help or have questions? I am Lio , don't hesitate to reach out! I am always available to respond, help, and improve. How it works:
Each block consists of a move with
FREE

Enhanced FVG Enhanced FVG is a technical indicator for MetaTrader 5 that identifies Fair Value Gaps on the chart and measures the buyer-to-seller volume ratio within each detected gap. Volume classification is performed using M1 timeframe tick volume data, applying the same methodology used in standard Volume Profile analysis. How It Works The indicator scans three consecutive candlesticks to detect Fair Value Gaps. A Bullish FVG is identified when the high of the first candle does not overlap w
FREE

注意:此免費版本只可使用到2026/09/30
交易最怕的不是虧損,而是「方向不明」
為什麼很多交易者會被掃出場?因為他們只看單一時框。本指標透過 AI 降噪技術,將 H1 的穩健與 M15 的靈敏結合,為您打造一個自動化的趨勢過濾網。
「讓數據說話,讓 AI 帶路,您只需負責收穫成果。」本指標在商品行情圖表中顯示H1(圓點)與M15(箭頭)兩個時間段的趨勢方向,其他時間段的計算結果會顯示於下方的曲線圖中。行情的走向、震盪、強度、交易量等請參考Stochastic, MACD, RSI等指標,指標可精準地判斷波段的方向與合適的進出場時機。
指標特色如下:
1. AI 多重時框(MTF)動態演算
本指標搭載 AI 趨勢過濾算法,自動同步 H1 (長期趨勢監測) 與 M15 (精準進場導航)。AI 會自動過濾掉已知趨勢方向中不具備獲利空間的微小波動,確保你始終站在大趨勢的正確一邊並且減少盤整時的心理壓力。
H1 圓點: 您的導航雷達,鎖定大波段方向。
M15 箭頭: 您的開火按鈕,精準捕捉發動瞬間。
2. 雙週期行情圖,一眼看出方向與
FREE
Developed by smart2trader.com
The Didi Index Nuvem Indicator is an indicator based on the original Didi Aguiar (Didi Index) indicator, featuring two visualization methods for the moving averages: as a cloud or as lines (original). This customization offers a new way to visualize the moving average crossovers in the Didi Index indicator. About the Didi Index Indicator The Didi Index Indicator , created by Brazilian trader Didi Aguiar, is a technical analysis tool based on the crossover of three
FREE
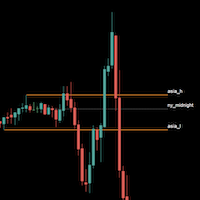
Sessions are very important in trading and often good area where to look for setup. In SMC, ICT we will look for Asian session to serve as liquidity
This indicator displays: High & Low of the Asia session Midnight New York time opening line
Congifuration Line Style, color Label position, size, color Start of the level (Start of the day, Start of the session, Highest or Lowest point in the session)
Any questions or comments, send me a direct message here https://www.mql5.com/en/users/mvonline
FREE

Breakout 4-in-1 Package Core Functionality The indicator serves as a "Trend Confirmation Engine." It identifies when the price breaks through a key structural level and then uses secondary oscillators to verify if the move has enough strength to continue. 1. The Breakout Engine (S&R) The foundation of the indicator is identifying Support and Resistance (S&R) . When price closes above resistance or below support, the indicator triggers an alert. Horizontal Levels: Breaks of previous highs/lows or
FREE
动量(Momentum)指标,支持多时间框架,可自定义视觉信号及可配置警报系统。
自由职业编程服务、更新和其他TrueTL产品可在我的 MQL5主页 获取。
非常欢迎您的反馈和评价!
什么是动量指标? 动量指标通过将当前价格与n个周期前的价格进行比较来衡量价格变化的速度。高于100的值表示上升动量(当前价格高于n个周期前),低于100的值表示下降动量。100处的中心线作为零参考。它是最简单却最有效的趋势强度指标之一,帮助交易者及早进入趋势并识别疲竭点。 动量信号在穿越100线(趋势转换)、穿越自定义水平线或出现背离时生成。价格上涨时动量上升确认趋势,而价格上涨时动量下降则暗示可能的反转。 功能特点: 带箭头和垂直线的视觉信号标记 三个具有可配置触发器的独立信号缓冲区 信号检测选项:方向变化、穿越水平线、峰值/谷值 每个信号的可配置警报功能(邮件、推送、声音、弹窗) 支持插值方法的多时间框架(MTF)功能 柱状图或折线图绘制模式 多种颜色模式(简单、基于方向、基于水平) 通过自定义指标调用(iCustom)访问缓冲区,支持Expert Advisor(EA)集成 输入参数: 基本设
FREE

MORE THAN A PIP/POINTS CALCULATOR
AlgoCore Calculator is a complete position sizing, growth, performance, movement-value and basket-analysis workspace for MetaTrader. It reads live account, symbol and broker data but does not open, modify or close trades.
23 individual calculation functions 39 types of calculated outputs 4 organized calculation panels
WHAT IT COVERS
Works with Forex, metals, indices, commodities and other broker-supported CFD instruments. Reads live account, symbol, tick,
FREE

Personality Type Indicator MT5 — Non-Repainting Entry & Exit Signals
Personality Type Indicator MT5 is a non-repainting buy/sell signal indicator for MetaTrader 5 with clear entry and exit rules, built on an adaptive personality type concept. Instead of one-size-fits-all settings, it adapts the trading engine configuration to different trading styles.
Why is this indicator different? A scalper and a swing trader utilize different approaches — so why should they use identical settings? Persona
FREE

Hourly xx:00 Candle Direction Signal for MT5 Know the direction of every hourly opening candle. The Hourly xx:00 Candle Direction Signal automatically analyzes the candle that starts exactly at xx:00 on your selected timeframe (M1–H1) and instantly tells you whether it closed LONG , SHORT , or DOJI . Designed for traders who want a simple and reliable hourly bias, the indicator displays clear chart signals and can send real-time notifications to your desktop or mobile device. Features Detects
FREE
FREE

Day Direction Scanner is an indicator that uses the direction of the current candlestick on the 1-Day, 4-Hour, 1-Hour, 15-Minute, and 5-Minute periods to determine the market's direction. When all the candlesticks converge in a single direction, the indicator indicates whether the day is bullish or bearish, or if there is no clear direction. It is useful for easily getting an idea of the market's direction during the day.
Features:
- Works on all currency pairs, indices, and commodities.
- F
FREE

DailyChameleon(每日变色龙) 会根据价格是高于还是低于当日开盘价,为图表上的K线自动上色——就像变色龙随环境变色一样。只有当日的K线会被上色,之前几天的K线保持图表原生样式,历史行情一目了然。 主要功能: 根据K线收盘价高于(看涨色)或低于(看跌色)当日开盘价,为实体、影线和边框上色。 显示自上次价格穿越当日开盘价以来经过的时间的实时计时器。 可自定义的换盘(Rollover)倒计时,颜色随时间临近逐步变化(绿色 → 黄色 → 红色)。 每次价格穿越当日开盘价时可选择播放提示音,看涨与看跌穿越使用不同音效。 位置、字体大小和颜色均可通过输入参数完全自定义。 轻量级设计:计时器和换盘标签每秒刷新一次,不会拖慢终端运行速度。 非常适合日内交易者,只需一眼即可判断价格是在当日开盘价上方还是下方,以及已经持续了多长时间。
FREE

A heatmap is a graphical representation of data in two dimensions, using colors to display different factors. Heatmaps are a helpful visual aid for viewers, enabling the quick dissemination of statistical or data-driven information. The MP Heatmap indicator provides a graphical representation of the relative strengths of major currencies compared to others, organizing data from pairs into color-coded results and producing a clear overview of the entire Forex market. The MP Heatmap indicator dis
FREE

The ADX Histogram is a modern and visual upgrade of the classic Average Directional Index (ADX) .
It transforms the standard ADX and DI+ / DI– values into a color-coded histogram , making trend analysis much clearer and faster. Key Features: Histogram with four states : Blue = Normal Buy Trend Green = Strong Buy Trend Orange = Normal Sell Trend Red = Strong Sell Trend Automatic strength detection : uses the ADX line to separate “normal” vs. “strong” signals. Fully customizable: ADX
FREE

This is a simple RSI indicator, but unlike the original one, it sends alerts when volume falls below the upper level or rises above the lower level, so you never miss a trading opportunity. Combined with support and resistance levels, it can provide strong entry opportunities into the market. I recommend keeping the levels as they are, i.e. 75 above and 25 below Check out my signal " PipStorm Invest ", save it to your favorites and come back from time to time to check it again :)
FREE

HTF Open Markers + ICT Silver Bullet Zones — Usage & Strategy Guide What it draws Session 1 / Session 2 lines : vertical lines at the open of every bar on two independently configurable higher timeframes (defaults: H4 and D1), including a projected line for the rest of today's not-yet-opened bars on sub-daily timeframes, so you can see where the next candle will open before it happens. ICT Silver Bullet zones : shaded rectangles over the three classic ICT kill-zone windows, converted from New Yo
FREE

Smart MCD (Hot Money) is a MetaTrader 5 indicator that visualizes three market-participant groups as color-coded histograms in a separate window, all normalized to a 0-20 scale. It uses a sensitivity-weighted, offset-adjusted RSI engine to suggest when large capital is entering or leaving the market. Features Three participant views: Retailer (a fixed ceiling reference at 20), Hot Money (short-term institutional flow) and Banker (longer-term smart-money flow). Normalized scale: all groups read o
FREE

Free forever simple pip meter for MT5 with customizable font color. Display profit or loss in both points count and currency value. Supports 4 currency symbols ($,€,£ ,¥). For unsupported currencies, it shows a 3-character currency short form. Enhance your trading interface with clarity and precision. Easy to use and tailored for diverse Forex traders. Perfect for MT5!
FREE

M30 Power: Pullback Analyzer Unlock the precision of multi-timeframe analysis with the M30 Power: Pullback Analyzer . Designed for serious day traders, this indicator bridges the gap between M30 market structure and M1 execution, helping you identify high-probability pullback entries with surgical accuracy. NOTE: Dont overtrade inside a M30 Period. If you took one or two scalps, wait for the next M30 Candle/Period.
Core Functionality The indicator divides the trading day into 30-minute stru
FREE

How many times have you looked for a PIVOT that works on a specific candle every day?
Many traders like to estimate the direction of the day's trend based on a specific time each day, such as 30 minutes after the market opens, or at 12 noon, and so on.
This indicator allows you to specify a certain time (hour and minute) and plots a pivot from that time to the next day at the same time. It shows five lines based on that specific candle/hour: median, maximum, minimum, support and resistance.
FREE

# Statistic Titan — Lịch Sử Giao Dịch Của Bạn, Được Biến Thành Huyền Thoại
**Lịch trình hiệu suất hàng tháng hiển thị ngay trên biểu đồ của bạn — không cần bảng tính, không cần ứng dụng bên thứ ba, không cần xuất dữ liệu.**
Hầu hết các nhà giao dịch theo dõi kết quả trong một mớ hỗn độn các báo cáo của nhà môi giới, sổ tay và các tab Excel, những thứ nhanh chóng trở nên lỗi thời ngay khi một giao dịch mới kết thúc. Statistic Titan thay thế tất cả những điều đó chỉ bằng một cái nhìn: toàn bộ
FREE

Aegis Current Force
Aegis Current Force is a professional signal indicator designed to identify structured trading opportunities using market direction, trend strength, momentum recovery, and predefined risk levels.
The indicator combines an internal Gann and Fibonacci price-alignment engine with ADX directional confirmation and CCI recovery filtering. A signal appears only when the selected conditions agree, helping reduce weak and unstructured entries.
BUY and SELL arrows are displayed dir
FREE
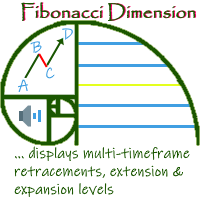
'Fibonacci Dimension' indicator allows display of preset or user-defined multi-timeframe Fibonacci levels. It automatically takes the previous high and low for two user-defined timeframes and calculates their Fibonacci retracement levels. It also considers the retraced level to draw the expansions on every change of price. A complete visual dimension in multiple timeframes allows deriving profitable strategies for execution. Enhanced functionality to view and customize the default Fibonacci Rang
FREE

Introduction The Parabolic SAR (Stop and Reverse) indicator is a technical analysis tool designed to identify potential trend reversals and provide trailing stop-loss levels. This enhanced version of the standard Parabolic SAR for MetaTrader 5 offers improved visual clarity, customizable alerts, and an optional trend confirmation filter to assist traders in their analysis. Features Enhanced Visualization: Displays Parabolic SAR dots in two distinct colors (Lime for uptrends, Red for downtrends)
FREE

Investment Castle Horizontals — Key Levels, Mapped Clearly
The Horizontals Indicator gives you a clean, comprehensive map of the horizontal levels that matter — the prices where the market repeatedly reacts — so you can plan entries, exits and targets around real structure instead of guesswork.
What it does for you Key horizontal levels: the important support and resistance prices, drawn for you. Comprehensive yet clean: a clear map of structure without chart clutter. Plan with structure: set
FREE

趋势,趋势指标,动量,振荡器,直方图,趋势强度,市场流动,趋势确认,看涨,看跌,技术分析
Trend Flow Oscillator 是一个市场流动性与动量指标,旨在帮助交易者清晰、简洁、快速地识别价格走势的强度和方向。 在 M5 时间周期中效果尤为显著,因为该周期中市场流动变化更加频繁。 功能 识别买卖力量的变化与延续 显示价格运动的加速与减速 帮助确认顺势入场 以独立柱状图形式展示市场流动 作为方向性动量振荡指标使用 适用人群 主观交易者 短线和日内交易者(特别是 M5) 寻求流动性确认而非自动信号的交易者 趋势及回调交易者 喜欢简洁直观指标的用户 使用方法 推荐使用时间周期:M5 柱状图解读: 正值柱表示买方力量增强 负值柱表示卖方力量增强 柱体越大,动量越强 该指标可用于: 确认顺势交易入场 避免逆势交易 验证突破及趋势延续 建议结合以下方法使用: Price Action 支撑与阻力 市场结构 说明:该指标为确认工具,不应作为单一入场信号使用。 限制 不是交易机器人 不会自动开仓或平仓 不预测市场走势 不替代风险管理 不保证盈利 风险提示 金融市场交易具有高风险。
历史表
FREE

免费 — Donchian 突破通道、SMA 趋势过滤器,以及管理交易的 ATR 移动止损,汇聚于一图。针对主流加密货币(BTC、ETH)调校。
加密货币会以漫长而干净的行情推进,然后剧烈震荡。原始的突破指标在两种情形下都会触发。本指标只有在突破同时与长期 SMA 一致时才标记它——这正是趋势型加密 EA 避免在区间内假突破时买入的方式。
=== 它绘制什么 ===
- 最近 N 根已收盘 K 线的 Donchian 通道(上轨与下轨)。
- 趋势 SMA(默认 200)。
- 金色箭头,标记在某根 K 线收盘突破通道且位于 SMA 正确一侧之处——趋势系统真正会采取的那个突破。
=== 不重绘 ===
通道与 SMA 均基于已收盘 K 线读取,突破则依据上一根 K 线的收盘价判定。不会从正在形成的 K 线绘制任何内容,因此箭头绝不会在之后消失。
=== 设置 ===
- EntryChannel(默认 20):Donchian 长度。
- TrendSMA(默认 200):仅标记沿 SMA 方向的突破。
- Trail_ATR(默认 4.0)与 ATR_Period(默认 14
FREE

Price breaks out. You want the continuation, but the entry usually comes too early, too late, or directly into a weak pullback.
Without structure, most traders can see the move but still cannot define where the retracement remains healthy and where the setup starts to fail.
Pullback Execution Map turns the current swing into a visual execution plan on the chart and a pullback meter below price. What it shows: Fibonacci execution pocket: Maps the active swing with a clear pullback pocket from the
FREE

每位交易者都熟悉这套流程:打开指标设置,改一个数字,点 OK,盯着图表看半天,觉得不对,再打开设置。MACD 一次就给你三个可以纠结的数字——Fast、Slow 和 Signal——而所谓标准的 12/26/9 只是习惯,并非定律。MACD Live Tuner 让这套流程到此为止。 这是一款可以 直接在图表上实时调节 的 MACD,运行在自己的独立子窗口中。图表上有一个小面板,带有 Fast EMA 周期、Slow EMA 周期和 Signal 周期三个滑块。拖动任意一个,MACD 线、Signal 线和 Histogram 都会立即重新计算并重绘,全过程看得见。「用 12/26/9 还是用适合我这个品种的参数」,几秒钟就有答案,不必再去论坛翻帖子。 大多数交易者搞错的一个细节:Signal 线是 Simple Moving Average,不是 EMA。 人们很容易以为 Signal 线和 MACD 线本身一样采用指数平滑——多数教科书对 MACD 的笼统描述也给人这种印象。但平台自带的标准 MACD 实现,把 Signal 线定义为对 MACD 线取的普通窗口 Simple Mo
FREE

This indicator extracts a trend from a price series and forecasts its further development. Algorithm is based on modern technique of Singular Spectral Analysis ( SSA ). SSA is used for extracting the main components (trend, seasonal and wave fluctuations), smoothing and eliminating noise. It does not require the series to be stationary, as well as the information on presence of periodic components and their periods. It can be applied both for trend and for another indicators.
Features of the me
FREE
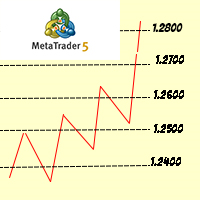
The big figure is a crucial aspect of forex trading, serving as a reference point for trade execution, risk management, and technical analysis. By understanding the importance of the big figure and incorporating it into their trading strategies, forex traders can improve their decision-making process and increase the likelihood of successful trades. Why is the Big Figure Important? The big figure is important for several reasons: Simplification: Traders often refer to the big figure when discu
FREE
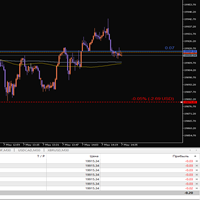
This indicator is designed for visual risk management and monitoring of open positions on the chart. It automatically calculates and displays: The average entry price for all open positions of the current instrument. The total volume of positions. A horizontal Stop Loss line, which can be moved manually. The potential loss if SL is triggered – both as a percentage of the account balance and in the account currency.
FREE
MetaTrader市场是一个简单方便的网站,在这里开发者可以出售自己的交易应用程序。
我们将帮助您发布您的产品,并向您解释如何为市场准备您的产品描述。市场上所有的应用程序都是加密保护并且只能在买家的电脑上运行。非法拷贝是不可能的。
