Dashboard Statistics
- 指标
- 版本: 1.0

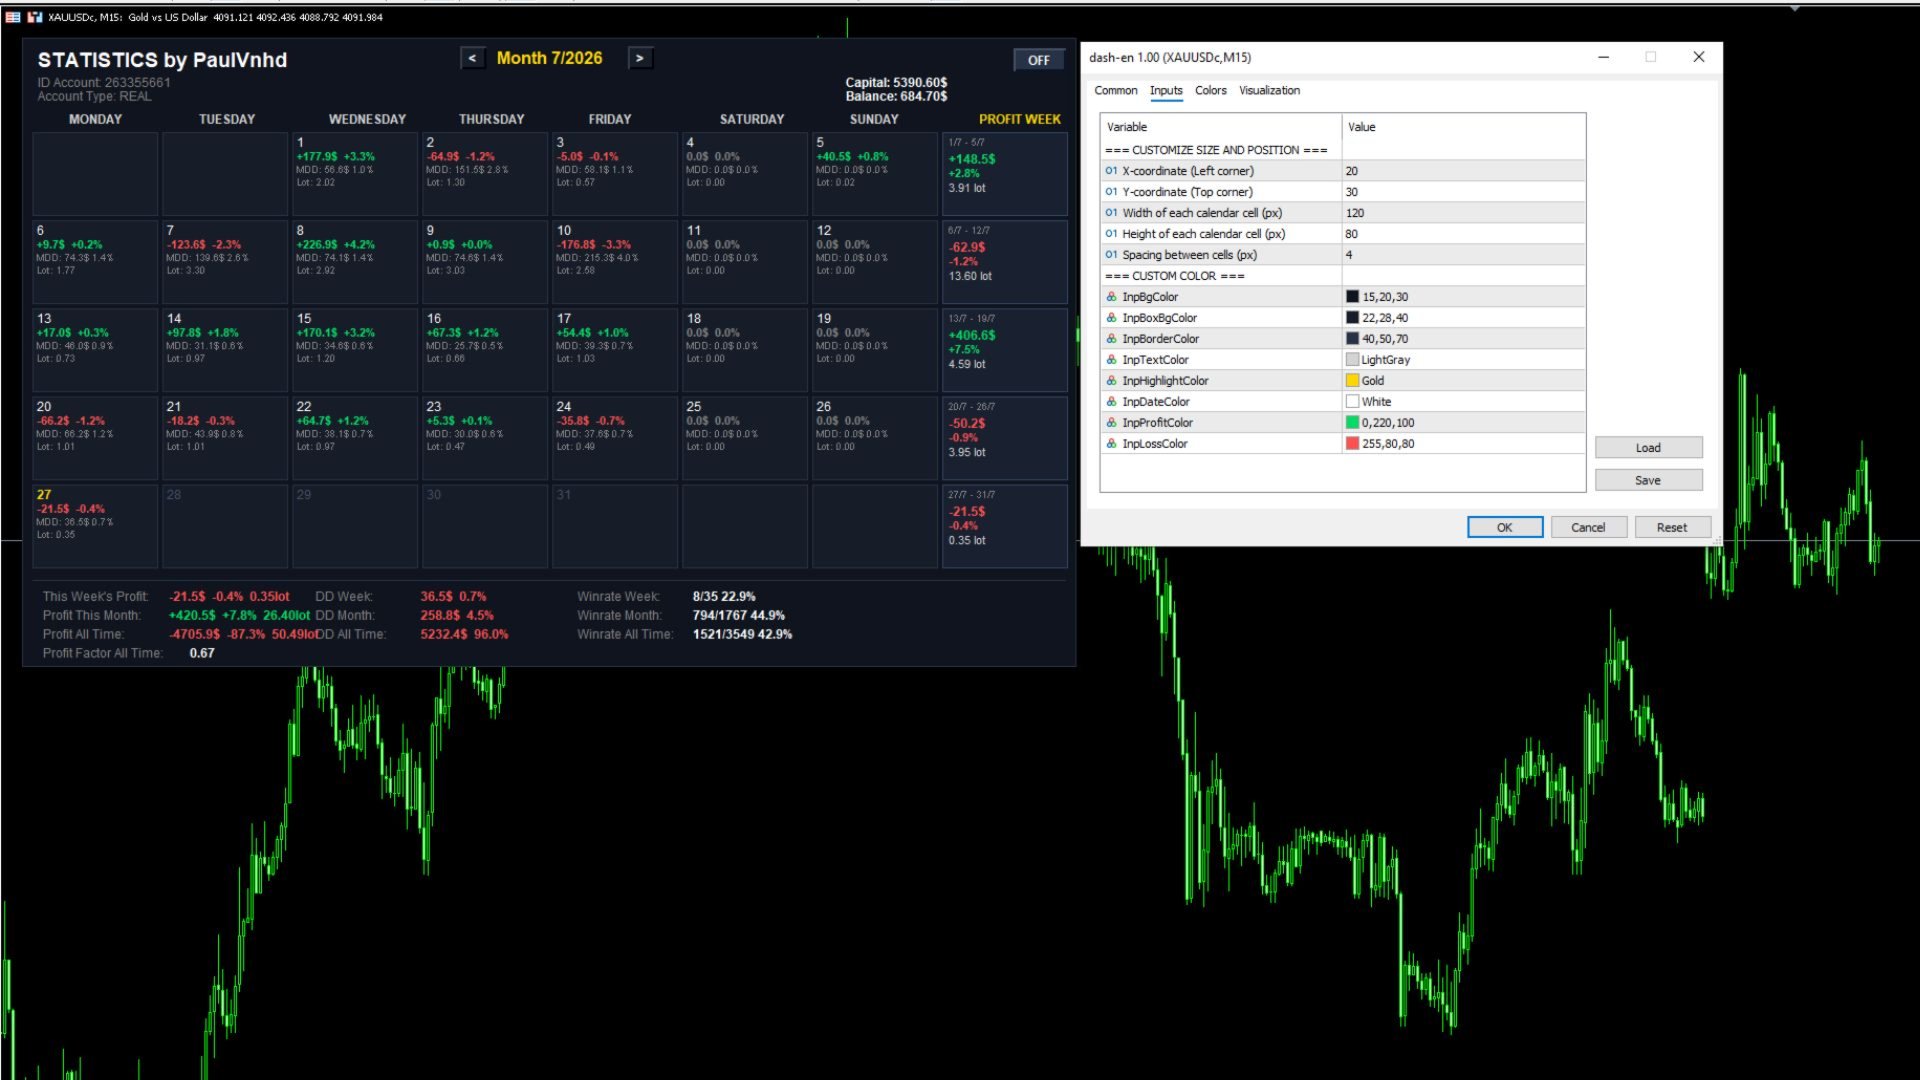
Trading Dashboard FULL - Real-Time Performance & Analytics Calendar
Trading Dashboard FULL is an advanced, interactive visual analytics tool for (MT5). Designed for serious traders, prop firm challenge takers, and portfolio managers, this indicator converts your raw trading history into a clear, comprehensive monthly calendar and real-time statistics dashboard right on your main chart window.
No more switching between account tabs or downloading report files to analyze your trading performance. Track your daily pnl, drawdowns, lot volume, and key statistical metrics dynamically as you trade!
Key Features
-
Interactive Calendar View: Displays your daily trading performance (Profit/Loss in USD and percentage, Lot volume, Max Intraday Drawdown) arranged by day and week.
-
Weekly Performance Breakdown: Automatically aggregates total weekly profits, ROI percentages, and traded volume in dedicated summary columns for each trading week.
-
Comprehensive Multi-Timeframe Statistics:
-
Profit Metrics: Real-time breakdown of current week, current month, and all-time total net profit ($ and %).
-
Risk & Drawdown Tracking: Peak-to-trough Maximum Drawdown ($ and %) calculated for weekly, monthly, and all-time history.
-
Win Rate & Trades Breakdown: Win/Loss count and Win Rate percentage across all timeframes.
-
Profit Factor (PF): Instant evaluation of your strategy's overall risk-to-reward efficiency.
-
-
Month-by-Month Navigation: Easily browse through previous or future months using intuitive and chart buttons. < >
-
Interactive UI & Hide/Show Toggle: Dynamic ON/OFF button to quickly minimize or expand the dashboard without cluttering your chart space.
-
Lightweight & Auto-Updating: Optimized event-driven timer updates account statistics automatically without freezing or lagging your chart.
-
Full Customization: Fully custom color schemes and UI dimensions to match any light or dark chart template.
Dashboard Breakdown
-
Header Panel:
-
Account Info: Login ID, Account Type (REAL / DEMO / CONTEST).
-
Equity & Capital Overview: Real-time Account Balance and Total Deposit (Capital Base).
-
Month Selection Controls & Dashboard Toggle Button.
-
-
Calendar Grid:
-
Daily Cell: Day Number | Net PnL ( $and \%) \vert{} Max Daily Drawdown (MDD$ and %) | Traded Volume (Lots).
-
Weekly Summary Cell: Start-to-End Date Range | Net Weekly Profit ($ and %) | Total Traded Volume.
-
-
Bottom Summary Statistics Bar:
-
Profit Row: This Week / This Month / All-Time Profit & Volume.
-
Drawdown Row: Maximum Drawdown ($ and %) for Week, Month, and All-Time.
-
Win Rate Row: Win Ratio (Win Trades / Total Trades) & Percentage for Week, Month, and All-Time.
-
Performance Metrics: All-Time Profit Factor.
-
Input Parameters
-
=== CUSTOMIZE SIZE AND POSITION ===
-
InpStartX (default: 20): X-coordinate position on the chart (pixels).
-
InpStartY (default: 30): Y-coordinate position on the chart (pixels).
-
InpBoxW (default: 120): Width of each individual calendar box cell.
-
InpBoxH (default: 80): Height of each individual calendar box cell.
-
InpPadding (default: 4): Spacing between calendar boxes.
-
-
=== CUSTOM COLOR ===
-
InpBgColor : Main dashboard background color.
-
InpBoxBgColor : Calendar box inner color.
-
InpBorderColor : Border lines color.
-
InpTextColor : Default label text color.
-
InpHighlightColor : Highlight color for current date and weekly headers.
-
InpDateColor : Text color for active dates.
-
InpProfitColor : Color used for positive profits/growth.
-
InpLossColor : Color used for negative profits/drawdowns.
-
How to Use
-
Drag and drop TradingDashboard_FULL onto any chart window (e.g., EURUSD, XAUUSD).
-
Adjust visual colors or sizes in the Inputs tab if necessary.
-
Use the < and > buttons on top of the dashboard to view past historical months.
-
Click OFF to collapse the dashboard into a minimal button view; click SHOW to display it again.