 MetaTrader 5
 专家
专家
 指标
指标
 程序库
程序库
 实用工具
实用工具
 窗口小部件
窗口小部件
 规则
规则
适用于MetaTrader 5的免费技术指标 - 35
 技术指标的信号外汇和股票市场的开仓交易和平仓交易起着至关重要的作用。指标的本质就是一种交易品种的数学转换,旨在预测未来的价格变化。
测试技术指标可以更有利于预测市场行为并从中获利。
技术指标的信号外汇和股票市场的开仓交易和平仓交易起着至关重要的作用。指标的本质就是一种交易品种的数学转换,旨在预测未来的价格变化。
测试技术指标可以更有利于预测市场行为并从中获利。 
FusionAlert StochRSI Master is an indicator available for MT4/MT5 platforms, it is a combination of RSI & Stochastic indicator which provide "alerts" when the market is inside "overbought and oversold" regions combined for both indicators, results in more precise and accurate signals to be used as a wonderful tool, in the form of "buy or sell" signals. This indicator comes with many customization options mentioned in the parameter section below, user can customise these parameters as needful. Jo
FREE
Linear Regression Channel – Indicator The Linear Regression Channel is a custom MT5 indicator that plots a regression line through price over a specified number of bars, with dynamic support and resistance boundaries. Central Line (BlueViolet):
Represents the linear regression line (best-fit line) based on the selected price type (Close or High/Low). Upper Line ( Li me):
Represents the regression-based resistance level, adjusted dynamically according to the highest deviation from the regressi
FREE

该指标基于著名的分形指标,但具有很强的定制性 和灵活性,
这是识别趋势逆转并最大化您的利润潜力的强大工具。
凭借其先进的功能和用户友好的界面,它是各个级别交易者的最终选择。 MT4 版本: Ultimate Fractals MT4 特征 :
可定制的分形蜡烛数。 反转线。 可定制的设置。 用户友好的界面。 主要参数: 左侧蜡烛 - 左侧形成分形的条形数量。 右侧蜡烛 - 分形右侧的条形数量。
不要让市场的不确定性阻碍您。使用“终极分形”指标提升您的交易游戏。
加入成功交易者的行列,依靠此工具做出自信的决策并实现财务目标。 请随意定制此产品描述,以突出显示您的特定“Ultimate Fractals MT5”指标的任何独特功能或优点,
并向我询问有关产品的任何问题或建议。
FREE

Murrey Math Channels Identifying key market reversal points and core trading ranges can be challenging.
Traditional analysis often lacks clear mathematical structure, leading to inconsistent entries.
Murrey Math Channels provides a mathematically grounded price framework based on the Law of Octaves to help traders define precise support, resistance, and reversal zones. How to Read the Chart: The indicator divides the price action into 8 main octaves (levels), each representing a different marke
FREE

Forex Pulse Matrix is a professional multi-currency strength dashboard for MetaTrader 5. It scans the 8 major currencies and monitors up to 28 forex pairs from a single chart, displaying a clear real-time strength matrix directly on your screen. The indicator helps traders identify the strongest and weakest currencies in the market, making it easier to spot high-probability momentum pairs and avoid single-pair noise. Main Features Multi-currency strength matrix for USD, EUR, GBP, JPY, CHF, CAD,
FREE

**IAT Sessions** marks the London, New York, Sydney, and Tokyo trading sessions directly on your chart, with an optional magnified price display.
**Key features:** - **DST-aware session hours** — Auto mode adjusts London, NY, and Sydney times for daylight saving automatically (Tokyo has none); an Auto+Cut variant ends a session the moment the next one opens; Manual mode lets you set exact hours yourself. - **Flexible display** — draw sessions as a rectangle box, a filled box, or horizontal hig
FREE

Detect Trend and Consolidation : Push Notif for Mobile Trading Overview Push Notif for Mobile Trading: Detect Trend and Consolidation is a custom MetaTrader 5 (MT5) indicator developed by Ritz_EANEHA that intelligently detects whether the market is in a trend (bullish/bearish) or in consolidation (sideways) . It uses a proprietary comparison of Standard Deviation (StdDev) and Average True Range (ATR) to assess volatility and market structure, and sends mobile push notifications to alert trade
FREE

A dynamic Fibonacci trend envelope indicator for identifying structured pullback zones inside active market trends. Golden Pocket Indicator by Pricewerk is a MetaTrader 5 indicator designed to help traders analyze trend direction, pullback depth and important Fibonacci retracement zones directly on the chart.Instead of manually drawing static Fibonacci levels, the indicator builds a dynamic ATR-based trend envelope and calculates key Fibonacci levels inside the current trend structure.The main f
FREE
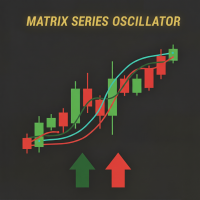
Matrix Series – 支撑、阻力及动量指标 在一个指标中显示关键支撑/阻力区域、超买/超卖水平以及市场强度。 Matrix Series 结合了 动态CCI 、平滑移动平均和标准差通道,为市场方向和关键水平提供清晰视图。蜡烛根据多空压力着色,并显示动态支撑/阻力区及超买/超卖可视化警报。 主要特征 趋势蜡烛颜色: 绿色=多头, 红色=空头 支撑与阻力区域: 根据可配置CCI周期动态计算 超买/超卖指标: 可视化警报提示极端状态 易于理解: 蜡烛方向与区域交互显示市场强度 完全可配置: 周期、平滑、OB/OS水平及区域显示 使用方法 趋势识别: 绿色蜡烛 → 多头; 红色蜡烛 → 空头 支撑/阻力交易: 观察价格与动态区域的交互以进行入场和出场 OB/OS确认: 信号穿越OB/OS水平增强交易决策 实际示例 绿色蜡烛,CCI高于阻力 → 强劲上升趋势,可能继续 红色蜡烛,CCI接近支撑 → 下跌趋势,可能出现新低 可视化OB/OS警报 → 显示潜在趋势反转 竞争优势 将多个工具整合到一个指标中:趋势蜡烛、CCI、支撑/阻力及OB/OS警报 在图表显示之前捕捉市场强度变化 过滤噪
FREE

RSI + EMA Momentum for MetaTrader 5 RSI-Based Momentum Analysis with Multi-Timeframe Evaluation RSI + EMA Momentum is a MetaTrader 5 indicator designed to measure momentum through the relationship between RSI and its Exponential Moving Average (EMA). Instead of relying exclusively on traditional overbought and oversold levels, the indicator evaluates the distance between RSI and its EMA and normalizes the result using standard deviation. This process produces a momentum score that adapts to dif
FREE

If you love this indicator, please leave a positive rating and comment, it will be a source of motivation to help me create more products <3 Key Takeaways Fisher is a repaint indicator. It recalculates previous bars when new bars become available. Modified to avoid repainting to accommodate some merchants. Fisher indicator is quite a simple histogram indicator that detects the trend's direction and strength and signals about trend changes. Traders look for extreme readings to signal potential p
FREE

Donchian Master Pro upgrades the traditional Donchian Channel with powerful tools that help you spot big moves before they happen. It highlights trend direction, detects squeeze conditions where volatility is hiding, and alerts you when price breaks through the channel with a strength rating so you can act with confidence. What You Get Color-coded Donchian Channels showing whether the market is trending up or down. Squeeze Detection reveals periods of low volatility that often precede major brea
FREE

Prior Day PRO is an advanced trading indicator for MetaTrader 5 that automatically identifies the market's most significant price levels using the previous day's range and the current trading session. Designed for professional traders, it provides high-probability trading zones for entries, exits, profit targets, and potential market reversals in real time—eliminating the need for manual calculations. Key Features 1. Previous Day High & Low Automatically calculates: Previous Day High (High Day)
FREE

โครงสร้างตลาด ZigZag (ความลึก 30) – คําอธิบาย + การตั้งค่า อินดิเคเตอร์นี้ใช้หาโครงสร้างตลาดแบบ: HH (Higher High) = ยอดสูงขึ้น → แนวโน้มขึ้น HL (Higher Low) = ยกฐาน → แนวโน้มยังขึ้น LH (Lower High) = ยอดต่ําลง → แนวโน้มลง LL (Lower Low) = ทําโลว์ใหม่ → แนวโน้มลงชัด ใช้ร่วมกับ ZigZag เพื่อ "คัดเฉพาะสวิงใหญ่" ไม่มั่ว หลักการทำงาน ZigZag จะหา "จุดกลับตัว" ตามค่า Depth เอาจุดเหล่านั้นมาเปรียบเทียบ: สูงกว่าเดิม → HH ต่ํากว่าเดิม → LH โลว์สูงขึ้น → HL โลว์ต่ําลง → LL แสดง label + เส้นแนวนอน
FREE

SwingStrength Pro – Swing High & Low Strength Scoring for MT5 Not every swing high or low is equal. Some are formed by a sharp rejection on heavy volume and hold for weeks; others are minor pauses that break at the first retest. SwingStrength Pro finds every swing high and swing low that price has not yet closed through, scores each one from 0 to 100, and shows you the strongest resistance and support directly on your chart. How it works Finds swings. The indicator scans the chosen timeframe for
FREE
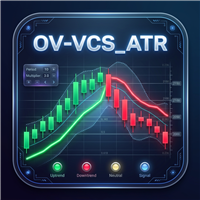
OV-VCS_ATR 交易规则 OV-VCS_ATR 指标是一种流行的趋势跟踪技术分析工具,帮助交易者识别当前市场趋势和潜在的入场/出场点。以下是使用 OV-VCS_ATR 指标的一般交易规则: 1. 指标概述 OV-VCS_ATR 指标由一条绘制在价格图表上的线组成,其颜色变化用于指示趋势方向: 绿色线: 表示 上升趋势 (买入信号)。 红色线: 表示 下降趋势 (卖出信号)。 2. 交易规则 买入信号(上升趋势) 入场: 当 OV-VCS_ATR 线变为 绿色 时,表示潜在的买入机会。当价格收盘高于 OV-VCS_ATR 线时,开立多头头寸(买入)。 止损: 将止损设置在 OV-VCS_ATR 线下方或最近的摆动低点。 止盈: 使用追踪止损(例如,跟随 OV-VCS_ATR 线)或基于支撑/阻力位设置固定盈利目标。 卖出信号(下降趋势) 入场: 当 OV-VCS_ATR 线变为 红色 时,表示潜在的卖出机会。当价格收盘低于 OV-VCS_ATR 线时,开立空头头寸(卖出)。 止
FREE
The indicator shows the current timeframe and symbol name. It is also possible to turn on the indication of time until the end of the current bar. In the settings, you can specify: - the location of the indicator in relation to the terminal window, top left, top right, bottom left and bottom right - a row of text display arrangements so that the inscriptions do not overlap each other - color - font - font size.
FREE

============================================================ Smart Pips Measure - product description ============================================================
A free indicator that measures any distance on the chart in pips, by dragging a bar.
How wide is that stop. How far did price just travel. How many pips away is my entry. In scalping and day trading those questions come up again and again, and doing the arithmetic every time is a waste of attention.
Forex, Gold (XAUUSD) and Bitcoin
FREE

MACD Sniper Signals PRO
SHORT DESCRIPTION
MACD Sniper Signals PRO is a momentum-based indicator designed to deliver clear buy and sell signals through refined MACD logic, structured visual trend shifts, and alert notifications. This indicator does not repaint.
FULL DESCRIPTION
MACD Sniper Signals PRO is built for traders who require clarity, speed, and objectivity in market decision-making.
It focuses on identifying momentum transitions using an optimized MACD framework combined with real-tim
FREE

M5 H1 24H Analyzer — Free MT5 Indicator M5 H1 24H Analyzer is a lightweight and easy-to-use MT5 indicator designed to analyze the recent 24 hours of H1 candle direction based on the current running M5 candle time . The indicator automatically uses the current M5 candle as the reference time and displays the corresponding H1 candle results from the previous 24 hours. Key Features ️ Automatic M5 Reference Time 24-Hour H1 Candle Analysis BUY / SELL / DOJI Detection Automatic Up
FREE
Free Until 1st Jan 2026
VWAR 2.2 (Volume Weighted Average Roadmap) is an advanced institutional-grade MT5 indicator that brings you the most powerful multi-timeframe VWAP (Volume Weighted Average Price) analysis—plus filtered trade signals using robust trend and momentum confirmations. Key Features: Multi-Timeframe VWAP Lines:
Plots Daily, Weekly, and Monthly VWAP levels for instant market structure insight. Dynamic Buy/Sell Signals: Big, bold colored arrows indicate confirmed buy or sell opp
FREE

VWAP Sigma Bands 3DV is designed for intraday traders and scalpers who want a cleaner statistical view of price in relation to volume and session equilibrium. The indicator combines the VWAP — Volume Weighted Average Price — with 1σ, 2σ and 3σ standard deviation bands , allowing traders to identify key areas of balance, extension, potential reversal and trend validation. Unlike bands based only on moving averages, sigma bands provide a statistical reference of how far price has moved away from
FREE

Enhanced FVG Enhanced FVG is a technical indicator for MetaTrader 5 that identifies Fair Value Gaps on the chart and measures the buyer-to-seller volume ratio within each detected gap. Volume classification is performed using M1 timeframe tick volume data, applying the same methodology used in standard Volume Profile analysis. How It Works The indicator scans three consecutive candlesticks to detect Fair Value Gaps. A Bullish FVG is identified when the high of the first candle does not overlap w
FREE
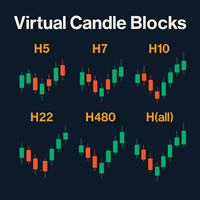
虚拟K线块(Virtual Candle Blocks)—— 视觉化无界市场 虚拟K线块 是一款为 MetaTrader 5 设计的高级指标,它能让你创建并观察任何自定义周期的 K 线,即使是那些平台本身不提供的周期。 主要特点: 自定义周期 :将基础 K 线组合成任意时长的 K 线块(例如:5 小时、14 小时、28 小时、72 小时等),从而创建全新的虚拟 K 线。这使你能够使用像 TradingView 等高级平台独有的周期。 清晰的视觉效果 :直接在图表上绘制带有实体和影线的虚拟 K 线。你可以自定义颜色、实体宽度,并选择是否显示影线,以便进行纯粹的价格行为分析。 高度可定制 :该指标包含一个简约面板,用于显示你选择的虚拟周期。它与 MT5 的所有绘图工具兼容,允许你在虚拟 K 线上标记支撑位、阻力位和趋势线。 高级分析 :将图表周期用作“缩放”功能,以检查每根虚拟 K 线的内部结构,从而提高你发现模式和趋势变化的能力。 理想用户: 价格行为交易者 :喜欢干净、无干扰图表的人。 技术分析师 :使用非标准周期来获得视觉和概念优势的人。 使用建议: 为了获得无重叠的视觉效果,我们建
FREE

Candle Time Phases Et Indicator - Split any candle into three time-based phases and control the sequential development of the candle in real time. Candle Time Phases is a precision timing indicator that divides the current candle into three time-based phases as a percentage of its total duration.
The indicator determines and clearly separates the initial uncertainty phase, the main movement, and the completion phase, while also analyzing the structure and sequential development of the candle in
FREE

Mabrouk RSI Sniper Pro: High-Precision Reversal Signal Indicator Unlock the power of professional price action combined with volume momentum. Mabrouk RSI Sniper Pro is designed for traders who demand precision and reliability. It identifies high-probability reversal points by analyzing candle formations and volume spikes. Key Features: Zero Repaint: Signals are permanent once the candle closes. Volume-Filtered: Only signals with strong market conviction are shown. Smart Price Action: Detects eng
FREE

TurnPoint Indicator – Market Reversal & Trend Signal Tool The TurnPoint Indicator is designed to help traders identify potential turning points and key levels in the market. By analyzing price action, it highlights areas where reversals or continuations are likely to occur, allowing traders to anticipate trend changes more effectively. This tool incorporates advanced logic to filter signals, reducing noise and false alerts. Users can choose between breakout and pullback modes, depending on their
FREE

My other indicators https://www.mql5.com/en/market/product/156702 https://www.mql5.com/en/market/product/153968 (FREE) https://www.mql5.com/en/market/product/153960 (FREE) MyFXRoom Equal Highs & Lows – Intelligent S/R Detector
What it does MyFXRoom Equal Highs & Lows automatically detects, validates, and draws Equal Highs and Equal Lows from confirmed 5-bar swing points. It highlights key support and resistance formed by multiple unbroken reactions at the same price area — the zones many tra
FREE
Excellent tracking performance and minimal noise! This trend detection indicator that avoids whipsaws and uncertain market noise and is also agile enough to react to changes in trend.
It is also designed to adapt to dynamic markets.
Functions mainly as a filter to help you trade in the direction of the trend.
Features.
Simple and easy to use. Low load and easy to try out The excellent tracking performance and smooth lines that make it ideal for market analysis Can be used as a trend filter for
FREE

CRYSTAL TIMELESS - Trade With Pure Price, Not Time The clock lies. Price tells the truth. Every standard chart forces you to watch the market through time - one candle per minute, per hour, per day - whether the market is moving or not. The result is endless noise, fake moves and dead candles that hide what really matters. Crystal Timeless removes time completely and rebuilds your chart from pure price movement, so the real trend and real turning points finally become obvious at a glance. Powere
FREE

Prop Risk Meter – 为 Prop Firm 交易者打造的免费回撤仪表盘。Prop Risk Meter 是面向自营交易公司(Prop Firm)和资金账户交易者的免费只读回撤仪表盘与风险面板,实时监控每日亏损、每日回撤和净值回撤 — 适用于 FTMO、FundedNext、Funding Pips、The5ers、E8 及任何资金账户。 在您的图表上实时显示: - 今日亏损对照您可配置的每日亏损限额(金额、已用百分比、信号灯进度条) - 从净值峰值起的当前回撤,对照您的最大回撤限额 - 以账户货币显示的剩余每日缓冲 - 总持仓手数与持仓数量 - 清晰的状态判定:OK · NEAR LIMIT(默认 80%)· OVER LIMIT 设计上即为只读。本工具以指标形式构建。MQL5 中的指标无法发送、修改或关闭订单——这是技术属性,不是承诺。Prop Risk Meter 只显示您的数字;它绝不触碰您的交易,绝不索取密码,不使用 DLL,不发起任何网络请求。 为什么免费?交易者失去资金账户最常见的原因不是策略差,而是没看到每日亏损限额逼近就已越线。这个面板让这段距离时刻可见
FREE

AutoFibonacci draws Fibonacci retracement and extension levels automatically. It finds the significant swing high and low on the chart itself, so the levels appear without you drawing anything, and they update as new highs and lows form. Drawing Fibonacci by hand has a practical problem: you choose the swing. Two traders looking at the same chart pick different points and get different levels. This indicator removes that step. It works on any symbol and any timeframe. How the range is chosen Thr
FREE

概述 Multi Timeframe Open Lines是一款适用于MetaTrader 5的轻量级指标,可在当前图表上直接显示所选时间周期的开盘价水平线。 本指标可以显示更高时间周期、更低时间周期以及相同时间周期的开盘价。 例如,可以在H1图表上显示H4和D1的开盘价,也可以在H1图表上显示M15的开盘价。 最多可以同时设置三个时间周期,并且每个时间周期都可以单独配置。 本指标仅用于辅助图表分析。它不会提供交易信号,不会开仓、修改持仓或平仓。 工作原理 每条开盘价线从所选时间周期的开始时间绘制到下一个周期的开始时间。 通过这种分段显示方式,可以清楚地确认每个开盘价所属的时间区间,并查看当前市场价格位于该开盘价的上方还是下方。 本指标也可以显示当前正在形成周期的开盘价,并自动更新显示。 主要功能 最多同时显示三个时间周期的开盘价 支持更高、更低和相同时间周期 可单独启用或关闭每个时间周期 可单独设置每条线的颜色、样式和宽度 可调整历史周期的显示数量 可显示当前周期的开盘价 可使用垂直线连接连续的开盘价水平 在图表右侧显示最新开盘价标签 可调整标签文字大小 可调整刷新间隔 自动使用当前
FREE
This is the demo version of "All Harmonics 26" indicator . "All Harmonics 26" searches for 26 types of harmonic patterns and outputs them in a convenient way. You can check out the documentation here . This demo version has the following limitations: The indicator searches only for one type of harmonic patterns out of 26:- Gartley. The indicator outputs new patterns with a lag of 10 bars.
FREE

HiLo Ladder 是经典 HiLo 指标 的全新演绎版本。HiLo 指标长期以来被交易者广泛使用,用于识别市场趋势的方向和潜在的反转点。无论是短线交易者还是长期投资者,HiLo 都是帮助他们判断市场节奏的重要工具。 与传统的 HiLo 不同, HiLo Ladder 在图表上的绘制采用阶梯式结构 —— 也就是交易者常说的 “阶梯线” 。这种表现形式不仅在视觉上更直观,而且能够有效地避免连续曲线带来的模糊感。每一段阶梯代表一个清晰的趋势区间,使得价格的上升和下降状态一目了然。 主要优势: 绿色表示价格处于上涨阶段,红色表示下跌阶段,让用户快速区分市场情绪。 阶梯式的走势比传统连线更稳定,减少了噪音干扰。 分析更加直观,无需复杂的解读,新手也能轻松使用。 能够帮助交易者更快地识别趋势变化,尤其是在震荡行情中。 可用作确认入场信号、辅助离场策略或仅作为趋势跟踪工具。 对于希望快速把握市场节奏的交易者来说, HiLo Ladder 提供了一种现代化的方式来解读价格走势。它结合了 HiLo 经典的核心逻辑,同时通过 “阶梯” 视觉效果增强了清晰度和可操作性。在快节奏的市场环境下,它
FREE

Version 1.5: manual color change added
This indicator helps to trade price action and momentum strategies like Guerrilla Trading or similar strategies.
The indicator displays: most recent highs and lows number of consecutive breaks past breaks of most recent highs and lows retest lines flag formations manual color change User can change colors. Go to Indictor Properties/Input, set "Auto Color" to false and change the colors. Set "Auto color" back to true to go back to pre-set colors. Please wa
FREE

Welcome to OmniZones Pro. Unlike traditional Supply & Demand indicators that simply draw rectangles at swing highs and lows, OmniZones features a State-Aware Algorithmic Pipeline that evaluates, scores, and tracks the lifecycle of every single zone in real-time. Perfect for scalping High-Liquidity Assets (Nasdaq, DAX, Gold, US30) or forex majors. Key Features: Quantitative Scoring Matrix: Zones are not created equally. OmniZones algorithmically evaluates Tick Volume Participation , Escape
FREE

AdnanEdge is a technical signal indicator for MetaTrader 5. It analyzes market conditions using five independent strategies and displays BUY or SELL arrows on the chart when a valid signal appears. The indicator is read-only and does not place trades. The built-in dashboard shows the current signal direction, strategy name, quality score, market regime, and relative volume. An adaptive mode automatically selects the best strategy for current conditions. Key Features Five signal strategies: MA C
FREE

The Stochastic Oscillator is one of the main indicators used in the analysis of financial assets. It is one of the highlights in the study of price movements and can be an important indicator of changing trends in the capital market. Stochastic is an oscillator used to identify when an asset is overbought or oversold. It consists of two lines: %K, which is calculated from the highs and lows of a period, and %D, which is a moving average of %K. Our version contains color filling, which facilitate
FREE

Daily VWAP — Institutional Reference for Intraday Value The Daily VWAP is a professional indicator based on the Volume-Weighted Average Price (VWAP) , designed to reveal the true balance between price and volume throughout the trading session. Unlike traditional moving averages, the Daily VWAP incorporates the weight of traded volume in every price movement, providing a much more accurate reference to the behavior of institutional traders and large market participants. What the indicator deliver
FREE

简介 这是一款结合了经典震荡指标 Williams %R 与 Bollinger Bands (布林带) 的复合型技术指标。它不同于传统直接基于价格的布林带,而是通过对 Williams %R 进行平滑处理后再进行标准差计算。 这种创新的组合能够有效捕捉动量爆发的瞬间,并利用布林带的动态特性来过滤普通震荡信号。当平滑后的 WPR 突破布林带上下轨时,通常预示着一个强力波段行情的开启。
核心功能与优势 双重过滤机制: 指标首先对原始 Williams %R 进行平滑处理(参数可调),有效减少了传统 WPR 常见的锯齿状噪点。 动态动量阈值: 与固定在 -20/-80 的静态超买超卖线不同,本指标引入了布林带作为动态边界,能够根据市场近期波动率自动调整信号触发点。
直观的视觉信号: 颜色变换: 指标线会根据其与布林带的位置关系自动变换颜色(突破上轨为绿,跌破下轨为红,震荡为灰)。 箭头提示: 当发生“穿透性”突破时,系统会在副图自动标注 L (Long) 或 S (Short) 信号。 高度可定制化: 用户可以自由调整 WPR 周期、平滑周期以及布林带的标准差倍数,以适应从 sc
FREE

Volatility Dragon Align Alert is a multi-timeframe SuperTrend indicator.
It shows H1, H4 and D1 SuperTrend on one panel.
ALIGNED = all three timeframes match.
MISALIGNED = they do not match.
When aligned it draws:
- StopLoss line (H1 ATR)
- TakeProfit line (H1 ATR)
Alerts:
- Aligned
- Misaligned
- H1 flip
- Price testing the stop line
- StopLoss hit
- TakeProfit hit
The panel also shows floating profit of open positions on the same symbol.
Designed for Deriv Volatility indices (V10, V25, V2
FREE

H4 CONTAINER MTF BOXES (MetaTrader 5) | //| | //| One H4 container box holds every H1, M30, M15, M5 and M1 box | //| that falls inside it. Each inner timeframe has its own on/off | //| switch. | //| | //| LEVELS | //|
FREE

注意:此免費版本只可使用到2026/09/30
交易最怕的不是虧損,而是「方向不明」
為什麼很多交易者會被掃出場?因為他們只看單一時框。本指標透過 AI 降噪技術,將 H1 的穩健與 M15 的靈敏結合,為您打造一個自動化的趨勢過濾網。
「讓數據說話,讓 AI 帶路,您只需負責收穫成果。」本指標在商品行情圖表中顯示H1(圓點)與M15(箭頭)兩個時間段的趨勢方向,其他時間段的計算結果會顯示於下方的曲線圖中。行情的走向、震盪、強度、交易量等請參考Stochastic, MACD, RSI等指標,指標可精準地判斷波段的方向與合適的進出場時機。
指標特色如下:
1. AI 多重時框(MTF)動態演算
本指標搭載 AI 趨勢過濾算法,自動同步 H1 (長期趨勢監測) 與 M15 (精準進場導航)。AI 會自動過濾掉已知趨勢方向中不具備獲利空間的微小波動,確保你始終站在大趨勢的正確一邊並且減少盤整時的心理壓力。
H1 圓點: 您的導航雷達,鎖定大波段方向。
M15 箭頭: 您的開火按鈕,精準捕捉發動瞬間。
2. 雙週期行情圖,一眼看出方向與
FREE

这是一个正在积极维护的版本,已针对当前的MT5版本进行了重新编译和功能扩展。
手动扫描每一根K线以寻找可识别的反转或延续形态非常耗时,而且很容易遗漏,尤其是在跨多个图表或时间周期时。
Phoenix K线形态监测器可在形态形成时自动检测 18 种标准 K线形态,在图表上进行标记,并实时统计数量,以便您查看该交易品种实际产生了哪些形态。
它如何为您捕捉形态
- 检测三大类共18种形态:单根K线形态(锤头、吊颈、流星、倒锤头及四种十字星变体)、两根K线形态(看涨/看跌吞没、穿刺线、乌云盖顶、看涨/看跌孕线、镊子顶/底)以及三根K线形态(晨星、暮星) - 图表上会显示箭头标记每个检测到的形态 - 实时更新的“形态历史”面板,显示各形态的出现次数 - “仅显示已确认形态”过滤器,可排除当前K线仍在形成中的形态
警报
检测到形态时可配置警报,支持声音和推送通知选项。
使用 Phoenix K线形态监测器可: - 在反转形态确认的瞬间捕捉到它,无需盯着每根K线看 - 查看特定交易品种上实际出现频率最高的形态 - 过滤掉未确认、仍在形成中的形态,以减少噪音
使用方法
1. 将其附
FREE
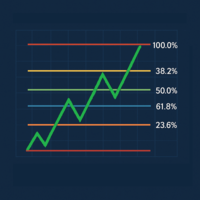
Last Candle Fibonacci is an indicator that makes it easy to see the Fibonacci levels of the previous candle. It can be configured for use on any timeframe, works on major currency pairs, and allows traders to identify reversal zones more clearly. Its design is intended to integrate seamlessly into the chart, highlighting key levels that help confirm pullbacks, potential entries, and targets. It is a lightweight, stable, and practical tool for those seeking a more structured market analysis and t
FREE
SMC Trend Momentum – Adaptive Trend and Momentum Oscillator SMC Trend Momentum is a momentum oscillator plotted in a separate window.
The indicator combines a Donchian position bias with a ZigZag leg normalization and transforms this into a smoothed, color‑coded histogram for assessing trend direction and momentum changes. Optionally, a higher timeframe filter can be applied. The indicator is designed to be flexible for different trading styles (short‑term, swing, indices, FX) using ready‑to‑u
FREE

Direction sets the side. Timing sets the moment. Vector speaks only when both agree.
TrendCue Vector separates market direction from entry timing.
The Context line defines the preferred side of the market. Candle colour shows the current Vector timing state. A fresh setup appears only when a new candle-colour transition agrees with Context.
Simple chart. Clear workflow. No engine parameters to optimize.
HOW IT WORKS
Context is the coloured line.
Green Context → favour long setups Red Con
FREE

Demand and supply zones Support and Resistance areas Show broken zones Show tested and untested zones Show weak zones Fractal factors Notifications when price reaches point of Interest with Push notifications and pop ups Customizable History Clickable Works on all Timeframes Works on all pairs.
Free for a while till further notice and changes. The demand and supply bot coming soon
FREE

This is a simple RSI indicator, but unlike the original one, it sends alerts when volume falls below the upper level or rises above the lower level, so you never miss a trading opportunity. Combined with support and resistance levels, it can provide strong entry opportunities into the market. I recommend keeping the levels as they are, i.e. 75 above and 25 below Check out my signal " PipStorm Invest ", save it to your favorites and come back from time to time to check it again :)
FREE

TANIN POLYLINE MT5 is the ultimate drawing assistant for Price Action traders. If you love the flexibility of the Polyline tool on TradingView, this indicator brings that exact experience to your MetaTrader 5 terminal.
Designed by Tanin Coder , this tool allows you to map out market structures, waves, and trends with speed and precision. A professional, fast, and convenient Polyline drawing tool inspired by TradingView. Supports Magnetic Snap, Straight Lines, and Auto Price Labels. RECOMMENDE
FREE

Weis Waves(魏斯波浪) 是由大卫·魏斯 (David Weis) 开发的技术指标,灵感来源于理查德·威科夫 (Richard Wyckoff) 的原理。
与传统逐根显示的成交量不同,Weis Waves 将成交量累积为连续的上涨或下跌“波浪”,当价格方向反转时重新开始计算。 这种方法使交易者能够清晰地看到市场运动的 真实力度 ,因为每一波浪都反映了支撑一系列K线的成交量强度。 主要特点: 将成交量分组为买入波浪和卖出波浪。 突出显示市场的主导力量(买方或卖方)。 有助于识别 趋势延续 或 潜在反转 。 基于威科夫方法论,被广泛应用于成交量与资金流分析。 Weis Waves 被众多专业交易者使用,用于分析价格与成交量之间的平衡,提供更深入的市场动态视角。
FREE

1. Overview Thank you for choosing the Trend Maximizer. This tool is designed for technical analysis within the MetaTrader 5 platform. It is a sophisticated trend-following indicator that helps traders identify the prevailing market trend and can also function as a dynamic, trailing stop-loss level. The core of the indicator is based on a combination of a user-selected Moving Average (MA) and the Average True Range (ATR) indicator. By analyzing the relationship between the MA and the calculated
FREE

Introducing the "Super Trend Filter Oscillator," your ultimate trading companion designed to enhance your technical analysis and help you make informed decisions in the financial markets. This innovative oscillator is crafted to provide valuable insights into market trends and price movements, assisting traders like you in identifying potential entry and exit points. Features: Trend Identification: The Super Trend Filter Oscillator excels in detecting prevailing market trends, whether they are b
FREE
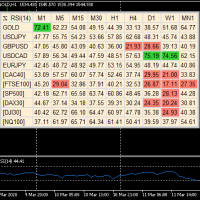
A useful dashboard that shows the RSI values for multiple symbols and Time-frames. It can be easily hidden/displayed with a simple click on the X top left of the dashboard. You can input upper and lower RSI values and the colours can be set to show when above/below these values. The default values are 70 and 30. You can choose whether the dashboard is displayed on the right or left of the chart. If you want to have 2 dashboards on the same chart you must input a different name for each. The sca
FREE

============== -- If you are a fan of FIBONACCI... then this is defenitely a tool for you
-- Please master the optimal trade entry concept and you will become profitable
-- Show me you comment about this tool and I will give you more tools: Tradelist Panel, Watermark, Reversal tool, ... ============== Hallo Trader, This is fibonacci system based on the previous day levels (low and high) and the current day levels.
You can choose your favorite in settings. I use the Previous Day Fibo and use the
FREE

Day Direction Scanner is an indicator that uses the direction of the current candlestick on the 1-Day, 4-Hour, 1-Hour, 15-Minute, and 5-Minute periods to determine the market's direction. When all the candlesticks converge in a single direction, the indicator indicates whether the day is bullish or bearish, or if there is no clear direction. It is useful for easily getting an idea of the market's direction during the day.
Features:
- Works on all currency pairs, indices, and commodities.
- F
FREE
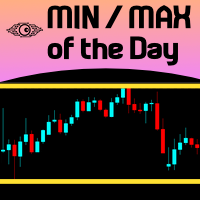
For those Price Action traders who love to trade strong Price points, like yesterday's HIGH and LOW, here is an indicator to ease the identification of those values, drawn directly on your chart! MIN/MAX of the Day will automatically draw 2 lines showing you those points for you, AND, if you like any HIGH and LOW in the past, not just yesterday's prices. It can also be configured to additionally show today's HIGH and LOW prices - just configure the refresh rate of those lines at your own taste/s
FREE

Dynamics Edge: Statistical Precision in Mean Reversion Dynamics Edge is a volatility boundary indicator designed to identify price exhaustion with high precision. Using an advanced standard deviation calculation ( $2.2 \sigma$ ), it maps the extremities where price is statistically likely to return to equilibrium (median). Key Features: Dynamic Exhaustion Edges: Solid lines that expand and contract based on volatility, identifying overbought (Blue) and oversold (Red) zones. OCR-Ready Price Tags:
FREE
Moving Average Color
Moving Average (MA) is a trend indicator, which is a curved line that is calculated based on price changes. Accordingly, the moving average is the trader’s assistant, which confirms the trend. On the chart it looks like a bending line that repeats the price movement, but more smoothly. Moving Average Color it is a standard moving average indicator with a color change when the trend direction changes. The ability to set additional levels has also been added. It is a handy too
FREE
Native Session Volume Splits traded volume by trading session: Asia, London, the London/New York overlap, New York, and everything outside those windows. Free tools that show session times only paint a coloured box on the chart. None of them tell you how much volume actually happened inside each session, because MetaTrader 4 never had real volume at all. MetaTrader 5 does, and this indicator uses it.
WHAT IT SHOWS
A histogram in a sub-window, one bar per candle, coloured by the session it fal
FREE

Description : Rainbow MT5 is a technical indicator based on Moving Average with period 34 and very easy to use. When price crosses above MA and MA changes color to green, then this is a signal to buy. When price crosses below MA and MA changes color to red, then this is a signal to sell. The Expert advisor ( Rainbow EA MT5 ) based on Rainbow MT5 indicator is now available here .
MT4 version is available here .
FREE

This indicator is a zero-lag indicator and displays strength of trend change . True Trend Oscillator Pro works best in combination with True Trend Moving Average Pro that displays exact trend as is. Oscillator value is exact price change in given direction of the trend.
True Trend Moving Average Pro: https://www.mql5.com/en/market/product/103586
If you set PERIOD input parameter to 1 this indicator becomes a sharpshooter for binary options.
Developers can use True Trend Oscillator in Exper
FREE
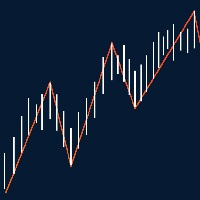
This indicator show Gann Swing Chart (One Bar) with multi layer wave. 1. Wave layer F1: Gann waves are drawn based on candles. SGann wave(Swing of Gann) is drawn based on Gann wave of wave layer F1. 2. Wave layer F2: Is a Gann wave drawn based on the SGann wave of wave layer F1. SGann waves are drawn based on Gann waves of wave layer F2. 3. Wave layer F3: Is a Gann wave drawn based on the SGann wave of wave layer F2. SGann waves are drawn based on Gann waves of wave layer F3. ---------Vi
FREE

VoltTrade Info — Real-Time Account Statistics Panel for MT5 VoltTrade Info is a comprehensive account monitoring dashboard designed for MetaTrader 5. It displays all critical trading statistics in one clean, dark-themed panel — giving you full visibility of your account performance at a glance. Key Features: Account Overview Real-time Balance, Equity, Deposits, Withdrawals Leverage and account currency display Live date and time Exposure Monitor Buy and Sell lots currently open Net lot position
FREE

Bull Bear 180 – Reversal Pattern Indicator The Bull Bear 180 indicator is designed to identify high-probability reversal patterns based on price action behavior. It detects specific candle formations where market pressure shifts from buyers to sellers (or vice versa), helping traders anticipate potential turning points with clarity and objectivity. This tool is suitable for scalping, intraday, and swing trading across multiple markets such as Forex, indices, and cryptocurrencies. How it works Th
FREE
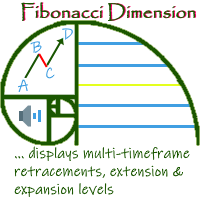
'Fibonacci Dimension' indicator allows display of preset or user-defined multi-timeframe Fibonacci levels. It automatically takes the previous high and low for two user-defined timeframes and calculates their Fibonacci retracement levels. It also considers the retraced level to draw the expansions on every change of price. A complete visual dimension in multiple timeframes allows deriving profitable strategies for execution. Enhanced functionality to view and customize the default Fibonacci Rang
FREE

Candle Volatility ET Classifier Indicator
A candle volatility indicator, candle classifier, and ET classification tool for MT5 that transforms raw price action into a structured market model through volatility classification. Overview
Candle Volatility Structures (CVET) is a custom candle classifier and volatility indicator designed to help traders understand market behavior through structure, volatility, and price action. This indicator provides real-time candle size measurement and candl
FREE
Linear Regression Channel (LRC) Indicator – Overview The Linear Regression Channel (LRC) indicator is a professional tool designed to display dynamic price channels around a regression trendline. It automatically adapts to market conditions, helping traders visualize price movement with clarity. Main Features : Regression-based central line with upper/lower channel boundaries. Fully customizable colors, styles, and levels. Optional labels and forward extensions for better chart visualizati
FREE

MTF Trend Dashboard Pro for MT5 MTF Trend Dashboard Pro adalah indikator Multi Timeframe (MTF) profesional untuk MetaTrader 5 yang membantu trader mengetahui arah trend pada berbagai timeframe secara bersamaan dalam satu panel yang ringan, cepat, dan mudah dibaca. Indikator ini menampilkan status Bullish atau Bearish secara real-time mulai dari M1, M5, M15, M30, H1, H4, D1, W1 hingga MN , sehingga trader dapat dengan mudah melakukan analisis top-down sebelum mengambil keputusan entry. Fitur Utam
FREE
学习如何在MetaTrader AppStore上购买EA交易,MetaTrader平台的应用程序商店。
MQL5.community支付系统支持通过PayPay、银行卡和热门付款系统进行交易。为更好的客户体验我们强烈建议您在购买前测试EA交易。
